Annals of Clinical and Analytical Medicine Original Research
Saziye Senem Basgul1, Akif Avcu2, Ibrahim Goksin Baser3, Saadet Yapan1, Filiz Mega4, Burcu Oguzdogan5, Vahdet Gormez4 1Department of Psychology, Hasan Kalyoncu University, Gaziantep 2 Department of Educational Sciences, Marmara University, Istanbul 3Department of Psychology, Fatih Sultan Mehmet Vakif University, Istanbul 4 Department of Child and Adolescent Psychiatry, Istanbul Medeniyet University Faculty of Medicine, Istanbul
5Clinical Psychologist,, Istanbul Gunes Cocuk Academy, Istanbul, Turkey
A validation study of PAOS
Psychological aspects of outbreaks scale (PAOS): A validation study
DOI: 10.4328/ACAM.20274 Received: 2020-07-04 Accepted: 2020-08-11 Published Online: 2020-08-26 Printed: 2021-03-01 Ann Clin Anal Med 2021;12(3):286-291 Corresponding Author: Burcu Oguzdogan, Gunes Cocuk Academy, Istanbul, Turkey.
E-mail: [email protected] P: +90 555 558 6968
Corresponding Author ORCID ID: https://orcid.org/0000-0001-6401-9462 Abstract
Aim: The aim of this study was set to develop a measurement tool to understand adults’ attitudes towards pandemic and to provide evidence of its validity and reliability.
Material and Method: Items developed from a pool of 59 items were applied to 798 adults. The exploratory factor analysis was made on the data collected, and the size of the measurement tool with factor extraction techniques was analyzed using SPSS and R statistical environment. In an iterative analysis of principal components, items that did not meet predefined criteria were removed and the 16-item final version of the Psychological Aspects of Outbreaks Scale was obtained. The final four-factor solution obtained with principal component analysis was also confirmed by the Exploratory Graph Analysis and Parallel Analysis. The second data collection was carried out by distributing the measurement tool to a group of 62 adults. Data were used to analyze the criterion validity and test-retest reliability of the measurement tool.
Results: The following names were given to the dimensions: fear of harm, considerations on precautions, intolerance of uncertainty, appreciation. PAOS’s sig-nificant relationships with other relevant constructs such as health anxiety, intolerance of uncertainty, and health cognitions supported criterion-related validity support its criterion-based validity. PAOS items had adequate level of internal consistency (α = .77) and test-retest reliability (r = .76).
Discussion: The Psychological Aspects of Outbreak Scale (PAOS) was a valid and reliable tool for evaluating people’s behavior, beliefs, and attitudes during the COVID-19 period.
Keywords
Introduction
The infection associated with the 2019-nCoV agents, which was first detected in Wuhan Province in China on December 30, 2019 spread around the whole world in a very short time and was declared an epidemic by the World Health Organization (WHO) on March 12, 2020. The first confirmed COVID-19 case in Turkey was reported on March 11, 2020 and the novel coronavirus infection spread rapidly from then on.
Pandemics come with a psychological toll on people and a list of scientific studies reporting adverse mental health outcomes related to COVID-19 have been published. All COVID-19 related publications report psychological distress symptoms based on non-specific psychometric assessment tools and the shortage of pandemic specific mental health screening tools is obvious [1]. There is a brief mental health-screening questionnaire, namely “Coronavirus Anxiety Scale” (CAS) developed specifically for the COVID-19 pandemic. In a sample of 775 adults with COVID-19- related anxiety, a 5-item CAS scale was found to be reliable and valid. It has been reported that the scale distinguishes well between individuals with and without dysfunctional anxiety with 90% sensitivity and 85% specificity and can be used as a supportive tool for clinical research and practice as an effective and valid tool [2].
Based on the idea that a reliable assessment of mental health outcomes related to the psychology of pandemics is a prerequisite for formulating effective treatment, the questionnaire we have developed is a short mental health screening scale specific for pandemics.
Material and Methods
Participants and Procedure
Two groups of participants were included in the study. The first group (n=798) consisted of 635 females (79.6%) and 163 males (20.4%) with an age range of 18 – 64 years. The construct validity of the scale was tested with the responses of this group. The second group (n=62) included 52 female (83.9%) and 10 male (16.1%) participants. This group was used for calculation of relevant coefficients of criterion-related validity and test re-test reliability, which was conducted with a two-week interval. The only inclusion criterion was the age range stated above.
The study was approved by the Ethics Committee at Hasan Kalyoncu University (Ref no: 804.01-E.2004130012). All respondents provided written consent to participate in the study and all data were anonymized.
Measures
Preparing the Item Pool For Psychological Aspects of Outbreaks Scale (PAOS) item pool was formed in an exploratory manner via reviewing pandemic-related articles and books, the clinical experience of the authors, and sociocultural conditions. The purpose of choosing an exploratory manner is to let relevant dimensions to emerge without in this novel time. The authors of the present study, who are mental health professionals with academic background, were asked to provide an expert opinion about the possible psychological effects of the pandemics and were then individually asked to make a list of items they thought would be relevant. After two online interviews, the professionals were asked to send the list of items they created
to the corresponding author, and subsequently, a pool of 59 items in total was formed.
Scales to Examine the Criterion Validity of the PAOS: Health Anxiety Inventory (HAI) was developed by Salkovskis et al. to evaluate the health-related anxiety level of adult individuals [3]. It is a self-report scale consisting of 18 four-point Likert type items scored at 0-3 points interval. The higher scores imply a higher level of health anxiety. The scale was adapted to Turkish by Aydemir et al. and a high level of reliability (α=.92) was reported [4].
The Health Cognitions Questionnaire (HCQ) was developed by Hadjistavropoulos et al. (2012); the scale consists of a total of 20 five-point Likert type items [5]. It consists of the following subscales: the likelihood of illness, awfulness of illness, the difficulty of coping, inadequacy of medical services. Altay and Yüksel adapted the scale to Turkish and reported that the Turkish form structurally coincided with the original scale and could provide reliable (α = .82) results (available from: https:// toad.halileksi.net/sites/default/files/pdf/saglik-bilisleri-olcegi-toad.pdf). In addition, the reliability values calculated for the subscales ranged from .65 to .84.
Intolerance of Uncertainty Scale (IUS-12) was developed by Carleton et al. and consists of 14 five-point Likert-type items [6]. It measures the level of tolerance of adults in uncertain situations and higher scores imply a high level of uncertainty-related anxiety. IUS-12 has two dimensions: prospective anxiety and inhibitory anxiety. The scale was adapted to Turkish by Sarıçam et al. [7]. The findings of the adaptation revealed that the Turkish version of IUS-12 is a reliable (α = .88) measuring instrument, and the extracted dimensions are compatible with the original one.
Statistical Analysis
Ferketich and Muller suggested that different factor extraction techniques and other possible options should be tried when validating an instrument [8]. If different factor extraction techniques produce consistent results, the real number of factors could be fully assured. On the other hand, confirmatory factor analysis was not carried out because the data were cross-sectional. Accordingly, a novel strategy has been followed in the present study. In the first step, the principal component analysis was performed with whole item pool consisting of 59 items. As a result of this analysis, a 15-factor solution was obtained based on the Kaiser’ criterion named eigenvalues-greater-than-one [9]. These 15 factors explained 56.4% of the total variance. Due to the overfactoring tendency of Kaiser’s rule [10] and the inability to obtain interpretable dimensions because of possible wording effects [11], item elimination was carried out. This process was done based on two different criteria [15] (a) at least .5 loading value [15] and (b) .1 absolute the difference between the highest two-factor loadings of each remaining item [12].
Based on these criteria, the item elimination process was performed iteratively and a final set of nineteen-item loaded on four dimensions was obtained. The four factors explained 52% of the total variance. A further qualitative screening was carried out to inspect whether or not items of each dimension were similar in terms of their content, and three additional items were further removed. After all, a final sixteen-item
measurement tool with four dimensions was obtained. In the following step, the data was transferred to the R statistical environment [13] and it was examined whether the number and structure of dimensions obtained by alternative methods could yield similar results. We used parallel analysis because it is the most accurate method to truly determine the number dimensions. In addition, we used recently developed Exploratory Graph Analysis (EGA) Golino and Epskamp [14] to investigate the dimensionality of psychological data. This new approach is based on the network psychometrics perspective and recently has been adapted from the network modeling approach to the quantitative field in psychometrics. It also belongs to a broader family of Gaussian graphic models [15]. A network model consists of nodes (observed variables or scale items) and edges (the weight of the relationship between these nodes). The edges show how strong the association between the nodes is [16]. The estimated clusters of nodes in the network correspond to the dimensions. It provides a graphical demonstration of the relationships between items and enables researchers to elicit valuable inferences unique to this approach. In network psychometrics, items are shown in circles in the chart where green lines represent positive relationships while negative relationships were shown with red lines. On the other hand, the thickness of the edge shows the magnitude of the relationship. Golino and Epskamp [14] stated that, unlike traditional understanding, EGA could provide accurate results, especially for multidimensional data.
The reproducibility of the obtained four-dimensional structure of PAOS scale was tested by these two methods. For the PA analysis, psych package developed by Revelle (available from: https://design.northwestern.edu/product-design-development-management) and for EGA, EGAnet package developed by Golino et al. were used [14].
Finally, the test-retest reliability of PAOS scores obtained at two-week intervals was investigated using Pearson correlation statistics. In addition, Pearson correlation statistics were also calculated between the scores of HAI, HCQ, IUS-12 and final form of PAOS in order to evaluate the criterion validity.
Results
Validation of PAOS
The explanatory factor analysis performed with the sixteen retained items after item elimination was completed. This analysis was carried out with varimax rotation. The estimated Kaiser-Meyer-Olkin (KMO) value of 0.829 verified that the data have sampling adequacy to implement factor analysis. Bartlett’s test of sphericity provides evidence for the sufficiency of the observed correlation pattern for factor analysis (χ2 (120) = 3801.175.P <.01). In addition, the communality values of each item were examined as another indicator of factorability. The estimated values are in the range of .483 and .764, which shows that all of them are above the threshold value of 0.3. Thus, it was concluded that the variance of the items can be explained sufficiently by extracted factors. Finally, anti-image correlations between items were found to be between 0.650 and 0.901. In summary, these findings support the factorability of the data.
When evaluated according to K1 criteria, it was found that
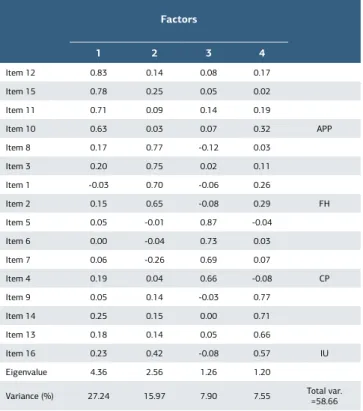
the four-factor solution gave the optimum result to the data. These four factors explain 58.66% of the total variance. Considering the content of these four factors predicted, the factors are named as “Fear of Harm (FH)”, “Considerations about Precautions (CP)”, “Intolerance of Uncertainty (IU)” and “Appreciation (APP)”. The main findings of exploratory factor analysis were presented in Table 1. As can be seen in the table, each dimension contains 4 items and the factor loading of the items varies between 0.87 and 0.57. Further, a cross-check investigation was made to determine the number of factors by Horn’s parallel analysis which also verifies that four-factor solution was the optimum one.
Exploratory Graph Analysis
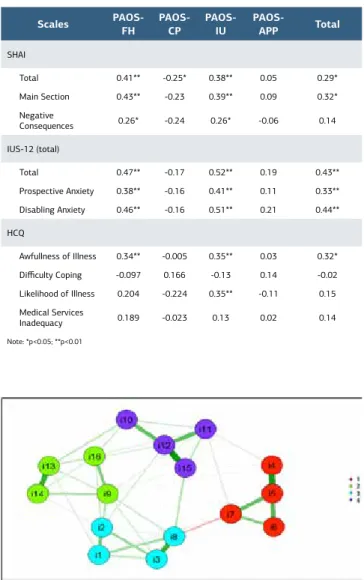
A further cross-check of the dimensional structure of PAOS was made by using EGA which was based on the area of network modeling (available from: psyarxiv.com/ktejp). The exploratory graph obtained was shown in Figure 1. Based on the graph, it could be inferred that the EGA results also support the four-factor structure. In addition, the graphical representation shows us that the items in the APP and CP subscales have higher conditional dependence between each other as inferred from the thickness of lines connecting them. In addition, structure, another output obtained with EGA is the structural stability index. These indices provide information about how stabile an item is located to the dimension it belongs, and can be interpreted similar to internal consistency. The structural consistency values obtained for the APP, CP, FH and IU subscales were 1, 0.88, 0.99, 0.99, respectively. Overall, these values support that the current structure of dimensions is stable for PAOS.
Table 1. Exploratory Factor Analysis of Items of PAOS
Factors 1 2 3 4 Item 12 0.83 0.14 0.08 0.17 Item 15 0.78 0.25 0.05 0.02 Item 11 0.71 0.09 0.14 0.19 Item 10 0.63 0.03 0.07 0.32 APP Item 8 0.17 0.77 -0.12 0.03 Item 3 0.20 0.75 0.02 0.11 Item 1 -0.03 0.70 -0.06 0.26 Item 2 0.15 0.65 -0.08 0.29 FH Item 5 0.05 -0.01 0.87 -0.04 Item 6 0.00 -0.04 0.73 0.03 Item 7 0.06 -0.26 0.69 0.07 Item 4 0.19 0.04 0.66 -0.08 CP Item 9 0.05 0.14 -0.03 0.77 Item 14 0.25 0.15 0.00 0.71 Item 13 0.18 0.14 0.05 0.66 Item 16 0.23 0.42 -0.08 0.57 IU Eigenvalue 4.36 2.56 1.26 1.20
Criterion-Related Validity
The relationships between subscale scores of PAOS and that of SHAI, HCQ, and IUS-12 scales were estimated with the Pearson correlation coefficient as proof of criterion-related validity. The findings are given in Table 2.
Community Detection of PAOS
The APP dimension was represented by purple circles corresponding to APP items; red items correspond to CP dimension; blue items correspond to FH dimension, and green items correspond to IU dimension.
Reliability of PAOS
The reliability of PAOS was investigated by computing Cronbach α correlation coefficient and by computing test-retest correlations. Due to the small number of items retaining in each dimension, α-values were computed for the overall test, while the test-retest reliability was computed for each dimension and overall test scores. The results showed that the internal consistency of the PAOS scale is 0.77. Test-retest reliability values for FH, CP, IU, and APP subscales are found as, 0.731, 0.179, 0.661, and 0.771, while for the overall test score was found as 0.775. These results imply the stability of PAOS scores over time.
Comparison Analysis Results of Sociodemographic Data and Survey
The relationships of PAOS sub-scales with the age of participants were investigated with Pearson correlations. The results revealed no significant relationships between the age of participants and APP, FH, and IU dimensions while a significant negative correlation was found for CP dimensions (r=-0.134, p<0.01).
Next, a series of One-Way Analysis of Variance (ANOVA) was performed to see whether the score distributions differed according to “gender”, “presence of COVID-19-diagnosed person at home”, “presence of a healthcare worker at home”, and “living with a person who goes out to work but has a limited chance of social isolation” or not. The results were presented in Table 3.
The results showed that female participants had significantly higher scores than males for APP and IU subscale scores (p<0.01). In addition, those living with a risky person in the same house reported significantly lower scores in the CP subscale (p<0.05). Finally, participants living with a healthcare worker in the same house reported higher scores in the FH subscale (p<0.05) and IU Distress subscale (p<0.05).
On the other hand, even the significant differences were observed with these analyses, not all differences were significant when considering the associated partial eta-squared (η2) values. Cohen recommended values greater than 0.06 as
Scales PAOS-FH PAOS-CP PAOS-IU PAOS-APP Total
SHAI Total 0.41** -0.25* 0.38** 0.05 0.29* Main Section 0.43** -0.23 0.39** 0.09 0.32* Negative Consequences 0.26* -0.24 0.26* -0.06 0.14 IUS-12 (total) Total 0.47** -0.17 0.52** 0.19 0.43** Prospective Anxiety 0.38** -0.16 0.41** 0.11 0.33** Disabling Anxiety 0.46** -0.16 0.51** 0.21 0.44** HCQ Awfullness of Illness 0.34** -0.005 0.35** 0.03 0.32* Difficulty Coping -0.097 0.166 -0.13 0.14 -0.02 Likelihood of Illness 0.204 -0.224 0.35** -0.11 0.15 Medical Services Inadequacy 0.189 -0.023 0.13 0.02 0.14 Note: *p<0.05; **p<0.01
Table 2. Pearson Correlations Between PAOS, SHAI, HCQ and
IUS-12 Subscale Scores
Figure 1. Dimensional Structure of PAOS based on EGA
Gender Female (n=635) Male (n=163) F (1,796) ŋ2 APP 13.4±2.24 12.1±2.94 36.82** 0.07 FH 11.3±3.22 10.8±3.40 3.52 0.01 CP 8.3±3.07 7.9±3.2 2.20 0.02 IU 9.6±3.39 8.2±3.26 22.44** 0.04
Living with a risky person No (n=488) Yes (n=310) F (1,796) ŋ2 APP 13.2±2.50 13.2±2.40 0.01 0.01 FH 11.2±3.50 11.3±2.85 0.43 0.04 CP 8.4±3.14 7.9±3.2 5.10* 0.03 IU 9.2±3.50 9.5±3.05 1.52 0.02
Living with a healthcare worker No (n=692) (n=106)Yes F (1,796) ŋ2 APP 13.1±2.49 13.4±2.24 1.22 0.01 FH 11.1±3.33 11.8±2.70 4.14* 0.03 CP 8.3±3.11 7.8±3.01 1.96 0.02 IU 9.3±3.45 9.7±3.09 1.28 0.01
Living with a non-health care worker No (n=364) (n=434)Yes F (1,796) ŋ2 APP 13.0±2.48 13.3±2.44 2.86 0.02 FH 11.0±3.28 11.4±3.25 2.26 0.02 CP 8.4±3.07 8.0±3.12 3.27 0.03 IU 8.8±3.38 9.8±3.36 17.67** 0.05 Note: *p<0.05; **p<0.01
Table 3. One-way analysis of variance (ANOVA) showing
medium effect and 0.14 as large effect sizes [17]. Based on these criteria, gender-based differences could be regarded as medium-sized effects while the other observed differences as small ones.
Discussion
The present study reports on the development and psychometric properties of a new screening scale, namely PAOS, which is aimed to be used for assessment of pandemics-related mental health outcomes. The results suggested that items of PAOS are internally consistent and the scores are stable over time. Results of the ANOVA analysis showed that women scored higher in PAOS-APP and PAOS-IU sub-scales and this finding is compliant with the literature that women are more likely to be diagnosed with anxiety disorders than men [18] and differ in terms of the coping strategies and emotional awareness [19]. We have shown that people who live with a risky individual have a lower PAOS-CP subscale score. This outcome can be interpreted, as these individuals are more likely to evaluate the situation based on their personal circumstances and possible damage.
People living with a healthcare worker reported a higher fear of harm; while the probability of transmission of coronavirus and mortality risk for people of different professions can be considered as an ambiguous possibility in terms of viral load, this is an obvious risk to healthcare professionals rather than an ambiguous feature. From this point of view, the fact that the explicit risk differs in terms of the fear scores rather than uncertainty compared to an ambiguous feature is similarly compatible with the literature [20].
Another important result that is compatible with the literature is that individuals who do not have workers sharing the household have lower uncertainty scores compared to those who have [20]. Whilst the results revealed no significant relationships between the age of the participants and PAOS-APP, PAOS-FH, and PAOS-IU subscales, a significant negative correlation was found for the PAOS-CP subscale (r=-0.134, p<0.01). Weak immune systems and chronic diseases have made older adults more susceptible to mortality risk with COVID-19 [21]. Concerns about the mortality risk could be the reason for the older adults finding preventative measures inadequate. Conversely, young people may not be sufficiently concerned with taking precautions because of not seeing themselves in the risk group. In addition, young people exhibited a more appreciative attitude than older people. The elderlies seem to be more resistant to change their lifestyles and habits than younger ones, which seems consistent with the literature [22].
The PAOS-FH and PAOS-IU subscales of the PAOS include structures that play a role in the development of mental health problems including anxiety disorders, depression disorders, posttraumatic stress disorder, etc. The finding that the PAOS-IU subscale can distinguish the theme of intolerance specific to outbreak specific uncertainty, rather than the level of intolerance, supports the strength of the scale.
Given the fact that fear of being harmed and intolerance to ambiguity are important structures in the emergence of mental health problems, the PAOS-FH and PAOS-IU subscales can be used to shape clinical interventions in people with mental
health problems related to the COVID-19 outbreak [20]. There was no significant relationship observed between the PAOS-CP pre-test and post-test scores. This result may be due to the fact that the daily changing data (infection statistics) and the measures taken vary depending on time, and individuals interpreted measure competencies in different ways every day. It was observed that the PAOS-APP sub-scale did not show a statistically significant relationship with any parallel scales. This result can be interpreted as that the PAOS-APP sub-scale measures a different structure than the other scales. At the stage of testing the validity of a similar scale, the fact that the scales used in evaluating structures such as psychological well-being, coping, and emotional awareness reflect the fact that high scores have positive effects on mental health, makes it impossible to make such an interpretation. This is one of the limitations of the study and should be tested in further studies. The findings showed a positive correlation between the PAOS-FH and PAOS-IU subscales with the total SHAI score, which also had a negative and statistically significant relationship with the PAOS-CP subscale. The scores from the PAOS-CP sub-scale refer to the positive evaluation of the precautions. The positive evaluation of the precautions has an inverse relationship with health anxiety levels and is compatible with the literature [23]. The statistically significant relationship between the main part subscale (also known as overexcitation and anxiety) of SHAI and the PAOS-FH and PAOS-IU subscales is compatible with the literature [24]. Hypersensitivity to somatic symptoms subscale of SHAI appears to correlate with the PAOS-IU subscale, which is consistent with the literature that the intolerance of uncertainty is associated with health anxiety [23]. An inverse relationship was observed between the PAOS-CP sub-scale and the overall mean SHAI score, but it did not show a statistically significant relationship with any other parallel scales. This result can be interpreted as that PAOS-CP has an inverse relationship with anxiety and measures a unique structure. There was a significant relationship between the PAOS-FH subscale and the IUS-12 total score as well as the mean scores for its subscales. The concept of fear and the fact that the damage involves uncertainty in one dimension shows that the study is compatible with the literature [24]. While the awfulness of illness subscale of the HCQ is related to both the PAOS-FH and PAOS-IU, the likelihood of illness subscale is related only to PAOS-IU. No relationship was observed between the PAOS subscales and the HCQ coping and sub-scales of the inadequacy of medical services. This situation may have arisen due to the difference between the expressions of HCQ scale items and the PAOS scale.
The present study has some limitations that need to be acknowledged. First and foremost, the sample consisted of young people who are aware of the risk and consequences of the disease. This shows that more studies concerning young people can be done for further examination. The present study lacks confirmatory factor analysis, which requires another set of data. Thus, further analysis is needed to confirm the factor structure of PAOS in a deductive manner. Finally, the data were collected via online participation. As Al-Salom and Miller reports, Internet surveys have some potential problems (available from: https://scholar.utc.edu/mps/vol22/iss2/2). We
strongly recommend performing further studies to investigate whether the extracted dimensions would still remain when the mode of data collection was altered.
Scientific Responsibility Statement
The authors declare that they are responsible for the article’s scientific content including study design, data collection, analysis and interpretation, writing, some of the main line, or all of the preparation and scientific review of the contents and approval of the final version of the article.
Animal and human rights statement
All procedures performed in this study were in accordance with the ethical standards of the institutional and/or national research committee and with the 1964 Helsinki declaration and its later amendments or comparable ethical standards. No animal or human studies were carried out by the authors for this article.
Funding: None Conflict of interest
None of the authors received any type of financial support that could be considered potential conflict of interest regarding the manuscript or its submission.
References
1. Wu P, Fang Y, Guan Z, Fan, B, Kong, J, Yao, Z, et al. The psychological impact of the SARS epidemic on hospital employees in China: Exposure, risk perception, and altruistic acceptance of risk. Can J Psychiatry. 2009; 54(5): 302–11.
2. Lee S. Coronavirus anxiety scale: A brief mental health screener for COVID-19 related anxiety. Death Stud. 2020; 44(7): 393–401.
3. Salkovskis PM, Rimes KA, Warwick HMC, Clark DM. The health anxiety inventory: Development and validation of scales for the measurement of health anxiety and hypochondriasis. Psychol Med. 2002; 32(5): 843–53.
4. Aydemir Ö, Kirpinar I, Sati T, Uykur B, Cengisiz C. Sağlık anksiyetesi ölçeğinin Türkçe için güvenilirlik ve geçerlilik çalışması (Reliability and validity study of the health anxiety scale for Turkish language). Noropsikiyatri Ars. 2013; 50: 325–31. 5. Hadjistavropoulos HD, Janzen JA, Kehler MD, Leclerc JA, Sharpe D, Bourgault-Fagnou MD. Core cognitions related to health anxiety in self-reported medical and non-medical samples. Int J Behav Med. 2012; 35(2): 167–78.
6. Carleton RN, Norton MAPJ, Asmundson GJG. Fearing the unknown: A short version of the Intolerance of Uncertainty Scale. J Anxiety Disord. 2007; 21: 105– 17.
7. Sariçam H, Erguvan FM, Akin A, Akça MŞ. Belirsizliğe Tahammülsüzlük Ölçeği (BTÖ-12) Türkçe formu: geçerlik ve güvenirlik çalışması (Turkish version of the Intolerance of Uncertainty Scale (BTÖ-12): a validity and reliability study). Ress Journal. 2014; 1: 148–57.
8. Ferketich S, Muller M. Factor analysis revisited. Nurs Res. 1990; 39: 59–62. 9. Kaiser HF. The Application of Electronic Computers to Factor Analysis. Educ Psychol Meas. 196020: 141–51. DOI:10.1177/001316446002000116.
10. Hair JF, Black WC, Babin BJ, Anderson RE. Multivariate Data Analysis: Global Edition, 7th ed. Prentice Hall, Upper Saddle River: Perason; 2010.
11. Wang L, Lin W. Wording effects and the dimensionality of the General Health Questionnaire (GHQ-12). Pers Individ Dif. 2011; 50: 1056–61.
12. Stevens J. Applied multivariate statistics for the social sciences. 4th ed. Mahwah NJ: Lawrence Erlbaum Associates; 2020.
13. Velicer WF, Eaton CA, Fava JL. Construct explication through factor or component analysis: a review and evaluation of alternative procedures for determining the number of factors or components. In: Richard DG, Edward H, editors. Problems and Solutions in Human Assessment. USA: Springer; 2000. p. 41–71.
14. Golino HF, Epskamp S. Exploratory graph analysis: A new approach for estimating the number of dimensions in psychological research. PLoS One. 2017; 12(6): e0174035. DOI: 10.1371/journal.pone.0174035.
15. Lauritzen SL. Graphical Models, volume 17. Oxford: Clerendon Press;1996. 16. Epskamp S, Borsboom D, Fried EI. Estimating psychological networks and their accuracy: a tutorial paper. Behav Res Methods. 2018; 50(1):195–212. 17. Cohen J. Statistical Power Analysis for the Behavioral Sciences, 2d ed. Hillsdale NJ: Lawrence Erlbaum Associates;1988.
18. McLean CP, Asnaani A, Litz BT, Hofmann SG. Gender differences in anxiety disorders: Prevalence, course of illness, comorbidity and burden of illness. J Psychiatr Res. 2011; 45: 1027–35.
19. Matud MP. Gender differences in stress and coping styles. Pers Individ Dif. 2004; 37: 1401–15.
20. Taylor S. The psychology of pandemics : preparing for the next global outbreak of infectious disease. UK: Cambridge Scholars Publishing; 2019. 21. Chen N, Zhou M, Dong X, Qu, J, Gong, F, Han, Y, et al. Epidemiological and clinical characteristics of 99 cases of 2019 novel coronavirus pneumonia in Wuhan, China: a descriptive study. Lancet. 2020; 395 (10223): 507- 13. 22. Korkut G, Uysal MT. Opinions of young and old people about old age process: a comparative study. J Aware. 2017; 2: 565–84.
23. Asmundson GJG, Taylor S. How health anxiety influences responses to viral outbreaks like COVID-19: What all decision-makers, health authorities, and health care professionals need to know. J Anxiety Disord. 2020; 71. DOI:
10.1016/j.janxdis.2020.102211.
24. Carleton RN. Fear of the unknown: One fear to rule them all? J Anxiety Disord. 2016; 41: 5-21.
How to cite this article:
Saziye Senem Basgul, Akif Avcu, Ibrahim Goksin Baser, Saadet Yapan, Filiz Mega, Burcu Oguzdogan, Vahdet Gormez. Psychological aspects of outbreaks scale (PAOS): A validation study. Ann Clin Anal Med 2021;12(3):286-291