RESEARCH ARTICLE
236
PERFORMANCE COMPARISON OF UV, UV/H2O2, UV/Fe2+, H2O2/Fe2+, UV/H2O2/Fe2+ PROCESSES IN THE REMOVAL OF COD AND COLOR FROM TEXTILE
WASTEWATER
Nevzat BEYAZIT1,* and Hande KARACA2
1 Ondokuz Mayıs University, Faculty of Engineering, Department of Enviromental Engineering, Samsun, [email protected], ORCID: 0000-0002-8396-5996
2 Ondokuz Mayıs University, Faculty of Engineering, Department of Enviromental Engineering, Samsun, [email protected], ORCID: 0000-0001-5868-0625
Recieved Date: 29.10.2020 Accepted Date: 11.12.2020
ABSTRACT
In this study, the removal of chemical oxygen demand (COD) and color from textile industry wastewater were investigated in comparison with UV, UV/H2O2, UV/Fe
2+
, H2O2/Fe 2+
, UV/H2O2/Fe 2+
processes. Initial pH, hydrogen peroxide dosage, ferrous iron dosage, and UV radiation were selected as variables. A maximum of 95.65% COD and 98.52% color removal were achieved by the photo-Fenton method. Another effective method was photo-Fenton process by which 83.76% COD and 80.44% color removal efficiencies were obtained. It was concluded that the Fe2+/H2O2 process (Fenton) with
UV light (photo-Fenton) can provide higher removal efficiencies in shorter process times in the treatment of textile wastewater.
Keywords: Textile wastewater, COD, Color, Photo-Fenton, UV/H2O2/Fe 2+
1. INTRODUCTION
The textile industry generally creates large volumes of wastewater containing highly concentrated organic dyes, inorganic ions such as chlorides and sulfates, soaps, oils, solvents, salts , and many other soluble compounds. The complex structure of these wastewaters can prevent their biodegradation. For this reason, they must be treated with appropriate methods to avoid environmental risks before being introduced into the receiving environment [1,2]. The main source of COD and color parameters in textile wastewater is dyestuff and polyvinyl alcohol, and they are characterized by high concentrations of COD (150-10,000 mg/L), BOD (100-4000 mg/L), and color content (50-2500 Pt-Co). Also, these wastewaters are considered toxic and carcinogenic [3, 4]. BOD/COD ratios of textile wastewaters are mostly in the range of 0.1–0.25 and are resistant to biodegradation [5,6,7,8]. Physico-chemical processes such as coagulation/flocculation, precipitation, adsorption, ion exchange, membrane separation, and oxidation or biological methods have been applied in most cases. Because of the toxicity possibilities of textile wastewaters, biological methods are seen inefficient especially if the pollutants are present in high concentrations. In physicochemical methods, sludge formation occurs relatively more [4,5]. Recently, electrochemical Technologies such as Advanced Oxidation Processes (AOPs) have been considered as efficient and practical alternatives for the removal of pollutants from textile wastewaters [9]. By using the hydroxyl radicals (●OH) produced in advanced oxidation
Beyazıt N. and Karaca H., Journal of Scientific Reports-A, Number 45, 236-252, December 2020.
237
processes, organic pollutants are converted into carbon dioxide and water quickly and efficiently [10]. Among these methods, especially H2O2/Fe
2+
and UV/H2O2/Fe 2+
(photo-Fenton) processes attract attention. In the Fenton reaction, a highly reactive hydroxyl radical is formed by the H2O2 ferrous
reaction (Eq. 1). In addition, the ferric iron formed can be oxidized by H2O2 to form a hydroperoxyl
radical (●O2H) (Eq. 2) Fe2+ + H2O2 Fe3+ + OH- + ●OH (1) Fe3+ + H2O2 Fe 2+ + ●O2H + H + (2)
Eq. 3 shows that Fe (OH)2+ complexes formed Fenton reactions can transform into hydroxyl radicals by UV light, also ferrous ions can be occurred, which is used in fenton process. This situation creates much less sewage sludge. Eq. 4 show that hydrogen peroxide can be convert to two hydroxyl radicals under exposure to UV light. Thus, the efficiency of fenton processes can be improved by UV radiation [11,12,13].
Fe(OH)2+ + hv Fe2+ + ●OH (3)
H2O2 + hv 2 ●
OH (4)
For removing several pollutants from synthetic or real textile wastewaters, advanced oxidation methods such as electro-Fenton (2), photo-Fenton (4), UV, UV/H2O2, UV/H2O2/Fe
2+
(5) ve peroxi-coagulation were used (6). Most of them were a comparison of one or two methods. In this study, COD and color removal from real textile wastewater by UV, UV/H2O2, UV/Fe
2+ , H2O2/Fe 2+ , and UV/H2O2/Fe 2+
methods were investigated in detail. 2. MATERIAL AND METHODS
2.1. Wastewater Characterization
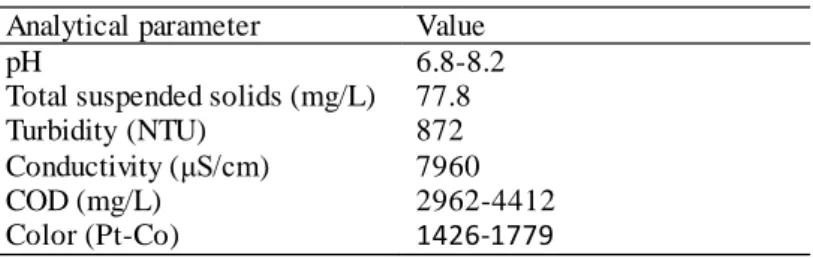
The textile industry wastewater used in the experiments was supplied from the dyeing process effluent of an enterprise operating in the fields of printing services (including clothing) on fabrics and textile products in the organized industrial zone of Fatsa district of Ordu. Wastewater characterization is given in Table 1.
Table 1. Characteristics of untreated textile wastewater. Analytical parameter Value
pH 6.8-8.2
Total suspended solids (mg/L) 77.8
Turbidity (NTU) 872
Conductivity (μS/cm) 7960
COD (mg/L) 2962-4412
Color (Pt-Co) 1426-1779
2.2. Apparatus and Procedure
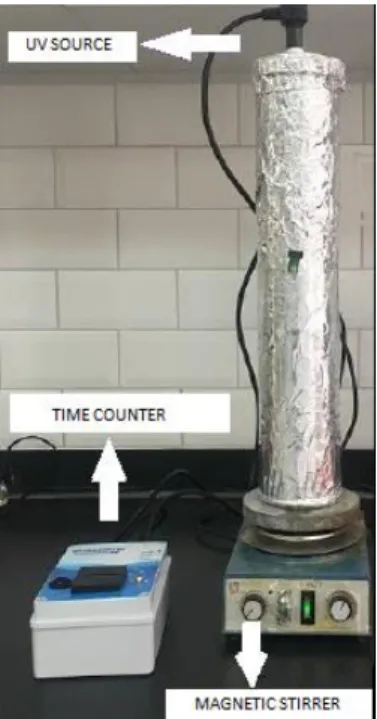
All experiments were carried out in a plexiglass column with an inner diameter of 7.8 cm, an outside diameter of 8.35 cm, and a height of 48.5 cm (Fig. 1). A 16W UV-C (254 nm) low-pressure mercury-vapor lamp mounted in a quartz tube was placed vertically in the center of the reactor. At the base of
Beyazıt N. and Karaca H., Journal of Scientific Reports-A, Number 45, 236-252, December 2020.
238
the reactor, a 2 cm vertical space was left for the magnetic stirrer to rotate. The mixing of the wastewater in the reactor was provided by the magnetic stirrer at the bottom.
Figure 1. Experimental setup.
All experiments were carried out with 2.1 L wastewater volume at room temperature (22 ± 2 ℃). Before each experiment, the wastewater was filtered through 2 coarse filter papers. H2SO4 and NaOH
solutions were used for pH adjustments. The reactor was covered with aluminum foil to prevent light from coming out. With the help of the tap placed in the reactor, samples of treated wastewater were taken at certain time intervals. Final pH values were recorded after each experiment. The treated wastewater samples taken after the experiments were centrifuged at 5000 rpm for 10 minutes to remove the flocs. Thermoreactor (Spectroquant TR 4220) and photometer (Merck Spectroquant NOVA 60A) were used for COD analysis. This photometer was also used for color measurements. COD measurements were carried out according to the closed-reflux colorimetric method (5520-D). Color measurements were made according to the visual comparison method (2120-B) [14]. H2SO4
(98%), potassium dichromate (K2Cr2O7), mercury sulfate (HgSO4), silver sulfate (Ag2SO4), potassium
hydrogen phthalate (C8H5KO4) were used for COD analysis. Ferrous sulfate heptahydrate (FeSO4.7H2O) was used as the Fe
2+
source. H2O2 (35%) was used in Fenton experiments. All reagents
used were analytical grade. 3. RESULTS AND DISCUSSION 3.1. UV Process
3.1.1. Effect of pH
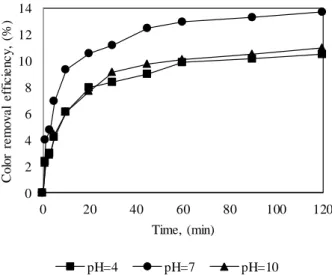
The effect of UV was examined for a process time of 120 minutes. As can be seen from the Fig. 2 and Fig. 3, COD and color removal efficiencies obtained at the initial pH values of 4, 7, and 10 increased
Beyazıt N. and Karaca H., Journal of Scientific Reports-A, Number 45, 236-252, December 2020. 239 0 2 4 6 8 10 12 0 20 40 60 80 100 120 CO D re m o v a l e ffi c ie n c y , (% ) Time, (min) pH=4 pH=7 pH=10 0 2 4 6 8 10 12 14 0 20 40 60 80 100 120 Co lo r re m o v a l e ffi c ie n c y , (% ) Time, (min) pH=4 pH=7 pH=10
with increases in the process time. While the maximum efficiencies achieved were 7.78%, 11.56%, and 8.61% for COD at pH 4, 7, and 10, they were 10.50%, 13.72%, and 11.02% for color. As can be seen from Fig. 2 and Fig. 3, pH 7 was optimal for both COD and color removal. By increasing the initial pH from 4 to 7, the efficiency for COD increased from 7.78% to 11.56% after 120 minutes, while for the color it was slightly increased from 10.50% to 13.72%. This indicates that initial pH is very effective in removing COD and color removal. On the other hand, UV radiation alone was not effective in COD and color removal from real textile wastewater. Concerning the UV effect, a similar result was obtained in the dye removal study by Bali (2004).
Figure 2. Effect of initial pH on COD removal efficiency in UV process.
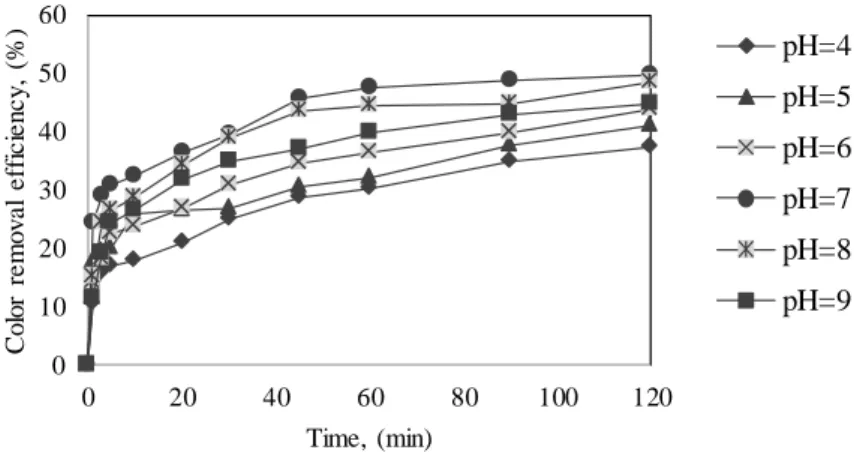
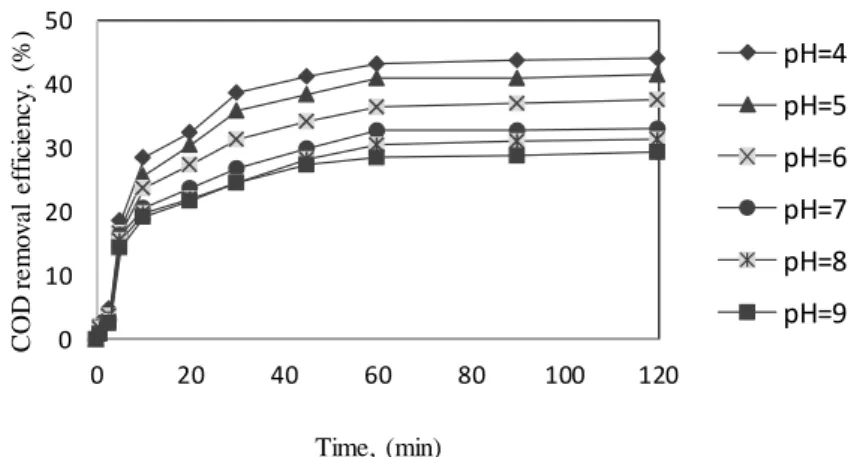
Beyazıt N. and Karaca H., Journal of Scientific Reports-A, Number 45, 236-252, December 2020. 240 0 5 10 15 20 25 30 0 20 40 60 80 100 120 CO D re m o v a l e ffi c ie n c y , (% ) Time, (min) pH=4 pH=5 pH=6 pH=7 pH=8 pH=9 0 10 20 30 40 50 60 0 20 40 60 80 100 120 Co lo r re m o v a l e ffi c ie n c y , (% ) Time, (min) pH=4 pH=5 pH=6 pH=7 pH=8 pH=9 3.2. UV/H2O2 Process 3.2.1. Effect of pH
The change over time of the effects of initial pH values varying between 4 and 9, in which H2O2
concentration was kept constant at 25 mM, on COD and color removal efficiencies is shown in Fig. 4 and Fig. 5. With the increase of pH from 4 to 7, COD and color removal efficiencies increased from 20.58 to 26.70%, and from 37.32 to 49.87%, respectively. Increasing pH from 7 to 9 decreased COD and color removal efficiencies from 26.70% to 25.49%, and from 49.87% to 44.90, respectively. Initial pH values of 7 and 9 reached 7.12 and 9.10, respectively, at the end of 1 20 minutes. No significant changes occurred in other pH values.
Figure 4. Effect of initial pH on COD removal efficiency in UV/H2O2 process.
Figure 5. Effect of initial pH on Color removal efficiency in UV/H2O2 process.
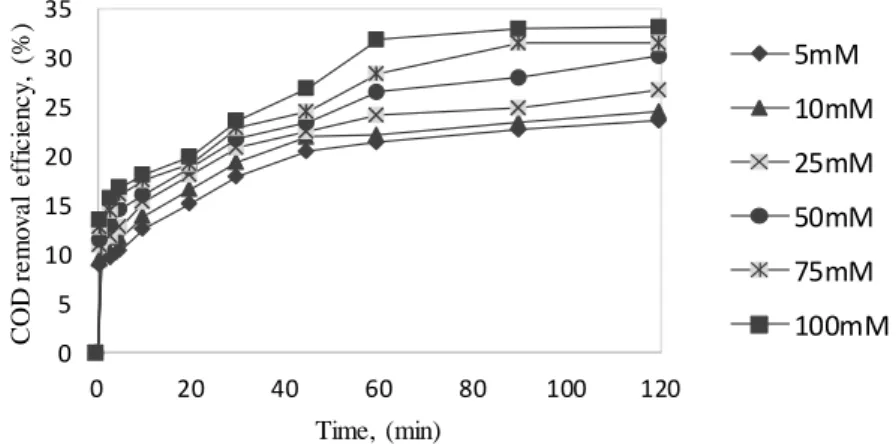
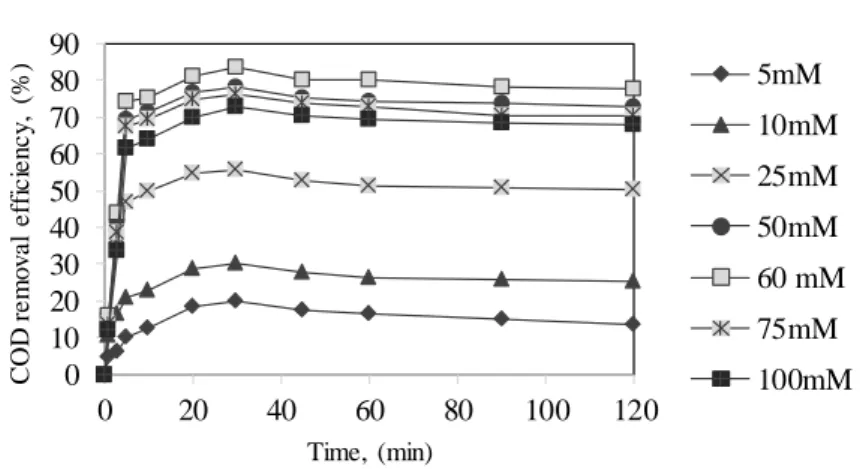
3.2.2. Effect of H2O2
The change over time of the effects of H2O2 concentrations varying between 5 and 100 mM, in which
pH was kept constant at 7, on COD and color removal efficiencies is shown in Fig. 6 and Fig. 7. With the increase of H2O2 concentration from 5 mM to 100 mM, COD and color removal efficiencies
Beyazıt N. and Karaca H., Journal of Scientific Reports-A, Number 45, 236-252, December 2020. 241 0 5 10 15 20 25 30 35 0 20 40 60 80 100 120 CO D re m o v a l e ffi c ie n c y , (% ) Time, (min) 5mM 10mM 25mM 50mM 75mM 100mM 0 10 20 30 40 50 60 70 0 20 40 60 80 100 120 Co lo r re m o v a l e ffi c ie n c y , (% ) Time, (min) 5mM 10mM 25mM 50mM 75mM 100mM
reached 33.08% and 61.21%, respectively, which are the maximum values for both. As can be seen from Fig. 6 and Fig. 7, while the COD removal efficiencies were dependent on different H2O2
concentrations after 60 minutes, the observed dependence for color removal efficiencies was over the entire experiment period. The initial pH value of 7 varied between 7.07 and 7.40 for 5 and 100 mM H2O2 concentrations, respectively.
Figure 6. Effect of H2O2 concentration on COD removal efficiency in UV/H2O2 process.
Figure 7. Effect of H2O2 concentration on Color removal efficiency in UV/H2O2 process.
3.3. UV/Fe2+ Process 3.3.1 Effect of pH
The change over time of the effects of initial pH values varying between 4 and 9, in which Fe2+ was kept constant in 2 mM, on both COD and color removal efficiency is shown in Fig. 8 and Fig. 9. Maximum of 44.02% COD and 55.42% color removal efficiencies were obtained at pH 4 at the end of 120 minutes, while COD removal of 43.21% and color removal of 54.86% were obtained in the first 60 minutes. By increasing the pH from 4 to 9, COD and color removal efficiencies decreased from 44.02% to 29.30% and from 55.42% to 41.09, respectively. Initial pH values between 4 and 9 changed between 4.07 and 9.05 at the end of 120 minutes.
Beyazıt N. and Karaca H., Journal of Scientific Reports-A, Number 45, 236-252, December 2020. 242 0 10 20 30 40 50 0 20 40 60 80 100 120 CO D re m o v a l e ffi c ie n c y , (% ) Time, (min) pH=4 pH=5 pH=6 pH=7 pH=8 pH=9 0 10 20 30 40 50 60 0 20 40 60 80 100 120 Co lo r re m o v a l e ffi c ie n c y , (% ) Time, (min) pH=4 pH=5 pH=6 pH=7 pH=8 pH=9 Figure 8. Effect of initial pH on COD removal efficiency in UV/Fe2+ process.
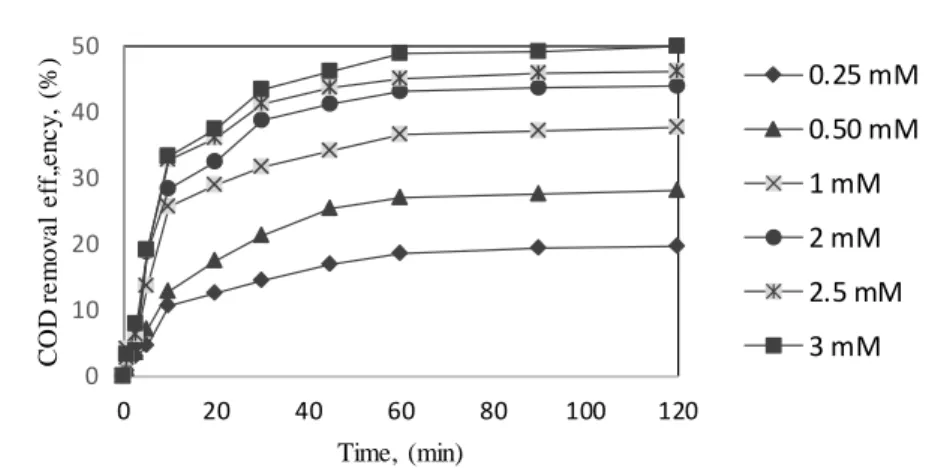
Figure 9. Effect of initial pH on Color removal efficiency in UV/Fe2+ process. 3.3.2. Effect of Fe2+
The change over time of the effects of initial Fe2+ concentrations varying between 0.25 and 3 mM, in which pH was kept constant at 4, on both COD and color removal efficiencies is shown in Fig. 10 and Fig. 11. A maximum COD of 19.62% and 33.74% color removals obtained at the 0.25 mM Fe2+ concentration increased to 49.89% and 59.44%, respectively, by increasing the Fe2+ concentration to 3 mM. The initial pH 4 value changed between 4.03 and 4.04 at the end of 120 minutes.
Beyazıt N. and Karaca H., Journal of Scientific Reports-A, Number 45, 236-252, December 2020. 243 0 10 20 30 40 50 0 20 40 60 80 100 120 CO D re m o v a l e ff, ,e n c y , (% ) Time, (min) 0.25 mM 0.50 mM 1 mM 2 mM 2.5 mM 3 mM 0 10 20 30 40 50 60 0 20 40 60 80 100 120 Co lo r re m o v a l e ffi c ie n c y , (% ) Time, (min) 0.25 mM 0.50 mM 1 mM 2 mM 2.5 mM 3 mM
Figure 10. Effect of initial Fe2+ concentration COD removal efficiency in UV/Fe2+ process.
Figure 11. Effect of initial Fe2+ concentration Color removal efficiency in UV/Fe2+ process. 3.4. H2O2/Fe2+ Process
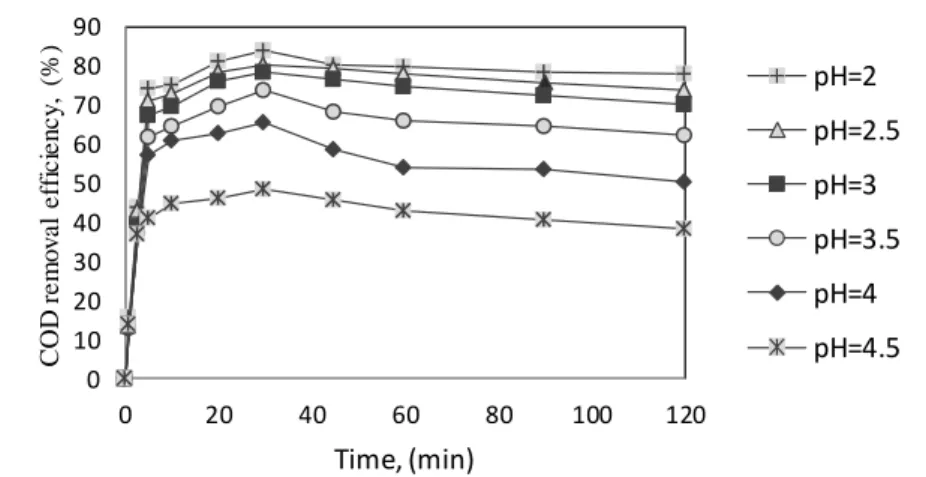
3.4.1.Effect of pH
The effect of initial pH values varying between 2 and 4.5 on COD and color removal efficiencies by keeping the 60 mM H2O2 concentration and the 2 mM Fe
2+
concentration constant (H2O2/Fe 2+
molar ratio: 30) is shown in Fig. 12 and Fig. 13. The maximum COD of 83.76% and color of 80.44% were obtained in the first 30 minutes at pH 2. With increasing pH from 2 to 4.5, COD and color removal efficiencies decreased to 48.54% and 55.42%, respectively, after 30 minutes. Initial pH values varying between 2 and 4 varied between 2.09 and 4.56.
Beyazıt N. and Karaca H., Journal of Scientific Reports-A, Number 45, 236-252, December 2020. 244 0 10 20 30 40 50 60 70 80 90 0 20 40 60 80 100 120 CO D re m o v a l e ffi c ie n c y , (% ) Time, (min) pH=2 pH=2.5 pH=3 pH=3.5 pH=4 pH=4.5 0 10 20 30 40 50 60 70 80 90 0 20 40 60 80 100 120 Co lo r re m o v a l e ffi c ie n c y , (% ) Time, (min) pH=2 pH=2.5 pH=3 pH=3.5 pH=4 pH=4.5 Figure 12. Effect of initial pH on COD removal efficiency in H2O2/Fe2+ process.
Figure 13. Effect of initial pH on Color removal efficiency in H2O2/Fe 2+
process. 3.4.2. Effect of H2O2
The effects of H2O2 concentrations varying between 5 and 100 mM on COD and color removal
efficiencies by keeping the pH 2 and 2 mM Fe2+ concentration constant are shown in Fig. 14 and Fig. 15. As can be seen from Fig. 14 and Fig. 15, COD removal of 83.76% and color removal of 80.44% was obtained at H2O2 concentration of 60 mM in the first 30 minutes. The efficiencies obtained with
50, 75 and 100 mM H2O2 in the first 30 minutes were 78.38%, 76.34%, and 72.71% for COD, while
these values were 77.87%, 67.72%, and 59.25% for color removal. The results indicated that the H2O2/Fe
2+
molar ratio should be at least 25 (50 mM H2O2/2 mM Fe 2+
) in the conditions of this study. Initial pH values of 2 varied between 2.08 and 2.10 at the end of 120 minutes.
Beyazıt N. and Karaca H., Journal of Scientific Reports-A, Number 45, 236-252, December 2020. 245 0 10 20 30 40 50 60 70 80 90 0 20 40 60 80 100 120 CO D re m o v a l e ffi c ie n c y , (% ) Time, (min) 5mM 10mM 25mM 50mM 60 mM 75mM 100mM 0 10 20 30 40 50 60 70 80 90 0 20 40 60 80 100 120 Co lo r re m o v a l e ffi c ie n c y , (% ) Time, (min) 5mM 10mM 25mM 50mM 60 mM 75mM 100mM Figure 14. Effect of H2O2 concentration on COD removal efficiency in H2O2/Fe
2+
process.
Figure 15. Effect of H2O2 concentration on Color removal efficiency in H2O2/Fe 2+
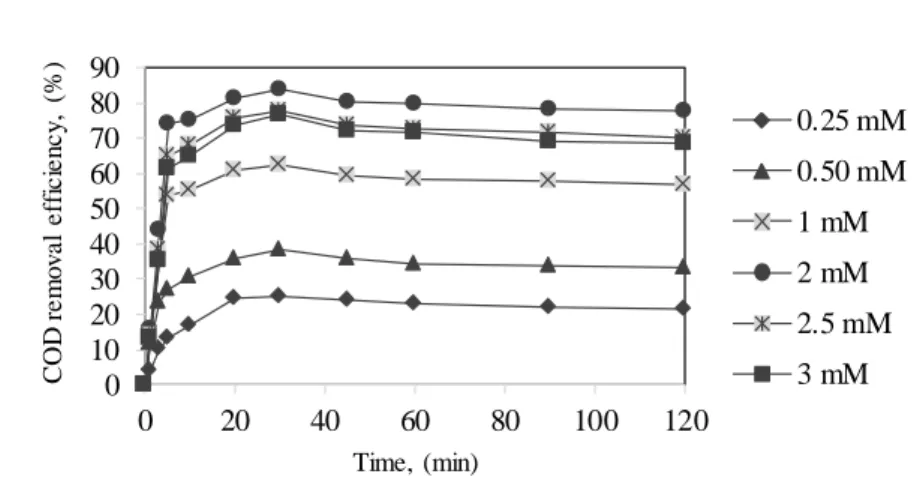
process. 3.4.3. Effect of Fe2+
The effects of Fe2+ concentrations varying between 0.25 and 3 mM, in which pH was kept at 2 and H2O2 was kept in 60 mM, on both COD and color removal efficiency are shown in Fig. 16 and Fig.
17. The maximum of 83.76% COD and 80.44% color removal efficiencies obtained at Fe2+ concentration of 2 mM decreased to 76.54 for COD at the end of 30 minutes when the Fe2+ concentration was increased to 3 mM and decreased to 67.81 for color. Initial pH 2 value varied between 2.03 and 2.02 at the end of 120 minutes.
Beyazıt N. and Karaca H., Journal of Scientific Reports-A, Number 45, 236-252, December 2020. 246 0 10 20 30 40 50 60 70 80 90 0 20 40 60 80 100 120 CO D re m o v a l e ffi c ie n c y , (% ) Time, (min) 0.25 mM 0.50 mM 1 mM 2 mM 2.5 mM 3 mM 0 10 20 30 40 50 60 70 80 90 0 20 40 60 80 100 120 Co lo r re m o v a l e ffi c ie n c y , (% ) Time, (min) 0.25 mM 0.50 mM 1 mM 2 mM 2.5 mM 3 mM Figure 16. Effect of Fe2+ concentration on COD removal efficiency in H2O2/Fe
2+
process.
Figure 17. Effect of Fe2+ concentration on Color removal efficiency in H2O2/Fe 2+
. 3.5. UV/H2O2/Fe2+ Process
3.5.1. Effect of pH
The effect of initial pH values varying between 2 and 4.5, in which H2O2 was kept constant in 60 mM
and Fe2+ was kept in 2 mM, on both COD and color removal efficiencies is shown in Fig. 18 and Fig. 19. COD of 49.86% and color of 53.21% removal efficiencies at pH 2 in the fir st 3 minutes, increased to 71.27% and 82.74%, respectively at the end of the 5 minutes. While the maximum values of 88.60% and 93.95%, of COD and color, are reached after 60 minutes, these values decreased to 79.57% and 83.42 when the pH increased from 2 to 4.5. Initial pH values between 2 and 4.5 varied between 2.08 and 4.53 in parallel with increasing pH values.
Beyazıt N. and Karaca H., Journal of Scientific Reports-A, Number 45, 236-252, December 2020. 247 0 10 20 30 40 50 60 70 80 90 100 0 20 40 60 80 100 120 Co d re m o v a l e ffi c ie n c y , (% ) Time, (min) pH=2 pH=2.5 pH=3 pH=3.5 pH=4 pH=4.5 0 10 20 30 40 50 60 70 80 90 100 0 20 40 60 80 100 120 Co lo r re m o v a l e ffi c ie n c y , (% ) Time, (min) pH=2 pH=2.5 pH=3 pH=3.5 pH=4 pH=4.5 Figure 18. Effect initial pH on COD removal efficiency in UV/H2O2/Fe
2+
process.
Figure 19. Effect initial pH on Color removal efficiency in UV/H2O2/Fe 2+
process. 3.5.2. Effect of H2O2
The effects of H2O2 concentrations varying between 5 and 100 mM, in which pH was kept at 2 and
Fe2+ was kept in 2 mM, on both COD and color removal efficiencies are shown in Fig. 20 and Fig. 21. By increasing the H2O2 concentration from 5 to 50 mM, COD removal efficiency increased from
42.29% to 90.30% in the first 60 minutes and color removal increased from 57.79% to 95.83% at the end of the same period time. With increasing the concentration to 100 mM, the efficiencies increased to 84.87% and 92.86% for COD and color, respectively. No significant differences were determined after the first 60 minutes between efficiencies achieved with H2O2 concentrations other than 5 and 10
mM. The initial pH of 2 varied between 2 and 2.08 for 5 and 100 mM H2O2 concentrations,
Beyazıt N. and Karaca H., Journal of Scientific Reports-A, Number 45, 236-252, December 2020. 248 0 10 20 30 40 50 60 70 80 90 100 0 20 40 60 80 100 120 CO D re m o v a l e ffi c ie n c y , (% ) Time, (min) 5mM 10mM 25mM 50mM 60mM 75mM 100mM 0 20 40 60 80 100 0 20 40 60 80 100 120 Co lo r re m o v a l e ffi c ie n c y , (% ) Time, (min) 5mM 10mM 25mM 50mM 60mM 75mM 100mM Figure 20. Effect of H2O2 concentration on COD removal efficiency in UV/H2O2/Fe
2+
process.
Figure 21. Effect H2O2 concentration on Color removal efficiency in UV/H2O2/Fe 2+
process. 3.5.3. Effect of Fe2+
The effects of Fe2+ concentrations varying between 0.25 and 3 mM, in which pH was kept at 2 and H2O2 was kept in 50 mM, on both COD and color removal efficiency are shown in Fig. 22 and Fig.
23. Maximum COD and color removal efficiencies of 95.65% and 98.52% were achieved in the first 60 minutes with 3 mM Fe2+ concentration. Fe2+ concentrations of 0.25 and 0.50 mM were not sufficient for COD removal. While relatively high Fe2+ concentrations were required for high COD removals, this was not determined for color removal. For example, the COD and color removal efficiencies of 95.65% and 98.52%, respectively, at a concentration of 3 mM Fe2+ at the end of 60 minutes were 59.97% and 82.36%, respectively, at 0.25 M Fe2+ concentration. The initial pH 2 changed between 2 and 2.03. By examining all experimental conditions, pH: 2, H2O2: 50 mM, Fe
2+
: 3 mM, and process time: 60 minutes were determined as optimum operating conditions.
Beyazıt N. and Karaca H., Journal of Scientific Reports-A, Number 45, 236-252, December 2020. 249 0 10 20 30 40 50 60 70 80 90 100 0 20 40 60 80 100 120 CO D re m o v a l e ffi c ie n c y , (% ) Time, (min) 0.25 mM 0.50 mM 1 mM 2 mM 2.5 mM 3 mM 0 10 20 30 40 50 60 70 80 90 100 0 20 40 60 80 100 120 Co lo r re m o v a l e ffi c ie n c y , (% ) Time, (min) 0.25 mM 0.50 mM 1 mM 2 mM 2.5 mM 3 mM Figure 22. Effect Fe2+ concentration on COD removal efficiency in UV/H2O2/Fe
2+
process.
Figure 23. Effect Fe2+ concentration on Color removal efficiency in UV/H2O2/Fe 2+
process. 3.6. Comparison of Processes
Under the optimum conditions determined for each process (UV: pH 7; UV/H2O2: pH 7 and 100 mM
H2O2; UV/Fe 2+
: pH 4 and 3 mM Fe2+; H2O2/Fe 2+
: pH 2 and 60 mM H2O2; UV/H2O2/Fe 2+
: pH 2, 50 mM H2O2 and 3 mM Fe
2+
) obtained COD and color removal efficiencies are given in Fig. 24 and Fig. 25, respectively. As can be seen from Fig. 24 and Fig. 25, a maximum of 95.65% COD and 98.52% color removal efficiencies were obtained at the end of 60 minutes by the photo-Fenton method. It was understood that a combination of UV radiation with Fenton process caused an increase of 9.99% and 18.08%, respectively in 83.76% COD and 80.44% removal efficiencies obtained by Fenton process. In the H2O2/Fe
2+
process, the decreases in COD and color efficiency after 30 minutes indicated that no H2O2 could react and the remaining Fe
2+
ions created color and COD. Also, the UV process was not effective alone. UV/H2O2 and UV/Fe
2+
Beyazıt N. and Karaca H., Journal of Scientific Reports-A, Number 45, 236-252, December 2020. 250 0 20 40 60 80 100 0 20 40 60 80 100 120 CO D re m o v a l e ffi c ie n c y , (% ) Time, (min) UV (16 W) UV/H2O2 UV/Fe H2O2/Fe UV/H2O2/Fe 0 10 20 30 40 50 60 70 80 90 100 0 20 40 60 80 100 120 Co lo r re m o v a l e ffi c ie n c y , (% ) Time, (min) UV (16 W) UV/H2O2 UV/Fe H2O2/Fe UV/H2O2/Fe
Figure 24. Comparison of UV, UV/H2O2, UV/Fe2+, H2O2/Fe2+, UV/H2O2/Fe2+ processes on COD
removal efficiency.
Figure 25. Comparison of UV, UV/H2O2, UV/Fe 2+ , H2O2/Fe 2+ , UV/H2O2/Fe 2+ processes on Color removal efficiency. 4. CONCLUSION
UV process alone was not effective in COD and color removal. Maximum of 11.56% COD and 13.72% color removal efficiencies were achieved at the optimum conditions.
Beyazıt N. and Karaca H., Journal of Scientific Reports-A, Number 45, 236-252, December 2020.
251
While UV/H2O2 process achieved a maximum of 33.08% COD and 61.21% color removal efficiency,
a maximum of 49.89% COD and 59.44% color removal efficiency were achieved with the UV/ Fe2+ process.
While the maximum COD and color removal was 83.76% and 80.44% in the first 30 minutes in the Fenton process, these values were reached in a short time like 10 minutes in the photo-Fenton process. For the photo-Fenton process, a maximum of 95.65% COD and 98.52% color removal efficiencies were achieved within 60 minutes.
In UV, UV / H2O2, UV/Fe 2+
, H2O2/Fe 2+
, and UV/H2O2/Fe 2+
processes, maximum COD and color removal efficiencies were achieved at ph values of pH 7, 7, 4, 2, and 2, respectively.
It has been determined that the textile wastewater treated only with the photo -Fenton method met the COD and color discharge standards of Water Pollution and Control regulation in force in our country. ACKNOWLEDGMENTS
This study was supported by the Scientific Research Project Fund of Ondokuzmayis University (Project No: PYO.MUH.1904.19.008). We would like to thank for the financial support.
REFERENCES
[1] Silva, G.M., Moreira, F.C., Alice, M., Mazur, L.P., Souza, A.U., Boaventura, A.R., Vilar, J.P, (2020), Integration of Fenton's reaction based processes and cation exchange processes in textile wastewater treatment as a strategy for water reuse, Journal of Environmental Management, 272, 111082.
[2] Pereda, B.R., Gallegos, A.A., Terrones, Y.A, Silva, S., Perez, A.H., (2020), Effective Electro -Fenton Treatment for Real Textile Effluent. A Case Study, Journal of Water Engineering, 37, 101434.
[3] Asghar, A., Raman, A.A. and Daud, W.M., (2015), Advanced oxidation processes for in-situ production of hydrogen peroxide/hydroxyl radical for textile wastewater treatment: a review, Journal of Cleaner Production, 87, 826-838.
[4] Kang, S.F., Liao, C.H. and Po, S.T., (2000), Color removal of textile wastewater by photo-fenton oxidation technology, Chemosphere, 41, -1287-1294.
[5] Bali, U., Çatalkaya, E. and Şengül, F., (2004), Photodegradation of Reactive Black 5, Direct Red 28 and Direct Yellow 12 using UV, UV/ H2O2 and UV/ H2O2/Fe
2+
: a comparative study, Journal of Hazardous Materials, B-114, 159-166.
[6] Ghanbari, F. and Moradi, M., (2015), A comparative study of electrocoagulation, electrochemical Fenton, electro-Fenton and peroxi-coagulation for color removal of real textile wastewater: Electrical energy consumption and biodegradability improvement, Journal of Environmental Chemical Engineering, 3, 499-506.
[7] Perez, M., torrades, F., Domenech, X. and Peral, J., (2002), Fenton and photo -Fenton oxidation of textile effluents, Water Research, 36, 2703-2710.
Beyazıt N. and Karaca H., Journal of Scientific Reports-A, Number 45, 236-252, December 2020.
252
[8] Gilpavas, E., Gomez, I.D. and Garcia, M.A.G., (2018), Optimization of solar-driven photo-electro-Fenton process for the treatment of textile industrial wastewater, Journal of Water Process Engineering, 24, 49-55.
[9] Gilpavas, E., Gomez, I.D. and garcia, M.A.G., (2019), Optimization and toxicity assessment of a combined electrocoagulation, H2O2/ Fe2+/UV and activated carbon adsorption for textile
wastewater treatment, Science of the Total Environment, 651, 551 -560.
[10] Sreeja, P.H. and Sosamony, K.J., (2016), A Comparative Study of Homogeneous and Heterogeneous Photo-Fenton Process for Textile Wastewater Treatment, Procedia Technology, 24, 217-223.
[11] Rott, E., Minke, R., Bali, U. and Steinmetz, H., (2017), Removal of phosphonates from industrial wastewater with UV/Fe(II), Fenton and UV/Fenton treatment, Water Research, 122, 345-354. [12] Zhang, H., Choi, H.J. and Huang, C.P., (2005), Optimization of Fenton process for the treatment
of landfill leachate, Journal of Hazardous Materials, B125, 166-174.
[13] Umar, M., Aziz, H.A. and Yusoff, M.S., (2010), Review: Trends in the use of Fenton, electroFenton and photoelectroFenton for the treatment of landfill leachate, Waste Management, 30, 2113 -2121.
[14] Rice, E.W., Baird, R.B., Eaton, A.D., and Bridgewater, L.L., (2012), Standard Methods in Examination of Water and Wastewater, twenty-three ed. Water Environment Federation, American Public Health Association, American Water Works Association (APHA-AWWA).