PREPARATION AND CHARACTERIZATION OF
NIOBIA-CONTAINING SOLID ACID
A THESIS
SUBMITTED TO THE DEPARTMENT OF CHEMISTRY AND THE INSTITUTE OF ENGINEERING AND SCIENCES OF
BILKENT UNIVERSITY
IN PARTIAL FULFILLMENT OF THE REQUIREMENTS FOR THE DEGREE OF
DOCTOR OF PHILOSOPHY
By
ĐLKNUR ÇAYIRTEPE January 2010
i
I certify that I have read this thesis and that in my opinion it is fully adequate, in scope and quality, as a dissertation for the degree of Doctor of philosophy.
———————————————— Assoc. Prof. Dr. Margarita Kantcheva (Supervisor)
I certify that I have read this thesis and that in my opinion it is fully adequate, in scope and quality, as a dissertation for the degree of Doctor of philosophy.
———————————————— Prof. Dr. Ömer Dağ
I certify that I have read this thesis and that in my opinion it is fully adequate, in scope and quality, as a dissertation for the degree of Doctor of philosophy.
———————————————— Assoc. Prof. Dr. Oğuz Gülseren
ii
I certify that I have read this thesis and that in my opinion it is fully adequate, in scope and quality, as a dissertation for the degree of Doctor of philosophy.
———————————————— Assist. Prof. Dr. Emrah Özensoy
I certify that I have read this thesis and that in my opinion it is fully adequate, in scope and quality, as a dissertation for the degree of Doctor of philosophy.
———————————————— Prof. Dr. Gürkan Karakaş
Approved for the Institute of Engineering and Sciences
———————————————— Prof. Dr. Mehmet Baray
iii
ABSTRACT
PREPARATION AND CHARACTERIZATION OF NIOBIA-CONTAINING SOLID ACID
İLKNUR ÇAYIRTEPE Ph.D. in Chemistry
Supervisor: Assoc. Prof. Dr. Margarita Kantcheva January 2010
The research in this work is directed towards (i) the development of effective methods for synthesis of new solid acids based on zirconia and niobia resulting in high concentration of acid sites and (ii) investigation of the potential of these materials as catalysts for the selective catalytic reduction (SCR) of nitrogen oxides (NOx) with
hydrocarbons and alcohol transformations. A series of NbOx/ZrO2 and WOx/Nb2O5
samples have been obtained by the so called “peroxo route” using acidic H2O2 solutions
as a reaction medium. The impregnation of hydrated zirconia with solutions of [Nb2(O2)3]4+ ions allows the synthesis of Nb2O5-ZrO2 samples with niobium loading up
iv
of Zr6Nb2O17 has been observed for the sample containing 25 wt% of Nb. The formation
of Zr6Nb2O17 is favored by the partial solubility of hydrated zirconia in the H2O2 solution.
Among the fully crystallized Nb2O5-based samples, the solid WO3-Nb2O5 solution
containing 20 wt % of WO3 has the highest and strongest Brønsted acidity.
Catalytic activity tests for the C3H6-SCR of NOx have shown that free and
Pd-promoted niobia-based samples containing 20 wt% WO3 are inactive, whereas the
Zr6Nb2O17 and 0.1Pd/ Zr6Nb2O17 samples catalyze this reaction. The conversion of NOx
in the SCR of NOx with propene in excess oxygen over Zr6Nb2O17 passes through a
maximum at 493 K. The mixed oxide displays good water tolerance and resistance toward SO2 poisoning. Based on the in situ FT-IR results, a reaction mechanism is
proposed with nitroacetone and NCO species as the key reaction intermediates. The results of the investigation show that the catalytic properties of the new solid acid Zr6Nb2O17 could be of interest regarding the development of sulfur- and water-tolerant,
low-temperature catalysts for the SCR of NOx with hydrocarbons.
The Zr6Nb2O17 and Nb2O5-containing 20 % WO3 samples have potential as
low-temperature catalysts for oxidant-free or oxidative transformation of alcohols, respectively.
Key words: Nb2O5/ZrO2, WO3/Nb2O5, synthesis from H2O2 precursor solutions,
HC-SCR of NOx; catalytic activity; in situ FT-IR spectroscopy; reaction mechanism; alcohol
v
ÖZET
NİYOBYA İÇEREN KATI ASİTLERİN HAZIRLANMASI VE KARAKTERİZASYONU
İLKNUR ÇAYIRTEPE
Danışman: Doç. Dr. Margarita Kantcheva Ocak 2010
Bu çalışmadaki araştırma, (i) yüksek yoğunluklu asit bölgeleriyle sonuçlanan, zirkonya ve niyobya temelli yeni katı asitlerin sentezlenmesinde etkin yöntemlerin geliştirilmesine; ve (ii) hidrokarbonlarla nitrojen oksitlerin (NOx) seçici katalitik
indirgenmesinde (SKİ) ve alkol dönüşümlerinde katalizör olarak bu malzemelerin potansiyelinin araştırılmasına yönlendirilmiştir. NbOx/ZrO2 ve WOx/Nb2O5 malzemeleri,
tepkime ortamı olarak asidik H2O2 çözeltilerinin kullanıldığı “perokso yol” ile
sentezlenmiştir. Hidratlı zirkonyanın [Nb2(O2)3]4+ iyonlarıyla doyurulması, ayrı Nb2O5
fazı oluşmadan ağırlıkça %30 a kadar niyobyum içeren Nb2O5-ZrO2 numunelerinin
sentezlenmesine izin verir. Zr6Nb2O17 tek fazın varlığı, ağırlıkça % 25 Nb içeren
vi
kısmi çözünürlüğü tarafından elverişli kılınır. Tümüyle kristallenmiş Nb2O5-temelli
numuneler içinde, ağırlıkça %20 WO3 içeren katı WO3-Nb2O5 çözeltisi en yüksek ve
kuvvetli Brønsted asitliğe sahiptir.
NOx C3H6-SKİ tepkimesi için katalitik aktivite testleri göstermektedir ki;
Pd-içermeyen ve Pd-eklenmiş ağırlıkça % 20 WO3 içeren niyobya temelli numuneler aktif
değilken, Zr6Nb2O17 ve 0.1Pd/ Zr6Nb2O17 numuneleri bu tepkimeyi katalizlemektedir.
Bol oksijenli ortamda, propenli NOx SKİ tepkimesinde NOx dönüşümü, 493 K de
maksimumdan geçmektedir. Karışık oksit, su karşı iyi tolerans ve SO2 zehirlenmesine
karşı iyi direnç göstermektedir. FT-IR sonuçlarına göre; anahtar tepkime ara-ürünleri olarak nitroaseton ve NCO türlerinin içerildiği tepkime mekanizması önerilmiştir. Araştırmaların sonuçları göstermektedir ki; hidrokarbonlarla NOx SKİ tepkimesi için yeni
katı asitin, Zr6Nb2O17, katalitik özellikleri kükürt- ve su- toleranslı, düşük-sıcaklık
katalizörleri geliştirme açısından önemlidir.
Zr6Nb2O17 ve % 20 WO3 içeren Nb2O5 temelli numuneler, sırasıyla, alkollerin
oksitleyici-içermeyen ve oksidatif dönüşümlerinde düşük-sıcaklık katalizörleri olarak potansiyele sahiptir.
Anahtar kelimeler: Nb2O5/ZrO2, WO3/Nb2O5, H2O2 öncül çözeltilerinden sentez, NOx
HK-SKİ; katalitik aktiflik; yerinde FT-IR spektroskopi; reaksiyon mekanizması, alkol dönüşümü.
vii
ACKNOWLEGMENTS
It is a pleasure for me to express my deepest gratitude to Dr. Margarita Kantcheva for her supervision, encouragement and guidance throughout the development of this thesis.
I would like to thank Assist. Prof. Emrah Özensoy and Assoc. Prof. Oğuz Gülseren for reading and commenting on this thesis.
I appreciate the moral support by my friends; Yurdanur Türker, Fatih Mustafa Genişel, Cemal Albayrak, Stanislava Andova, Ivalina Avramova and Emine Kayhan.
I would like to thank all present and former members of Bilkent University, Chemistry Department for their help.
I would like to thank Bilkent University and the Scientific and Technical Research Council of Turkey for the financial support.
I would like to express my deepest gratitude to my daughter, Elif, and my husband, Fatih, for endless support, patient and love. I would like to give my special thanks to my family.
viii
TABLE OF CONTENTS
I. Introduction
………..……… 1I.1. Environmental Problems, Regulations and Possible Solutions………...….... 1
I.2. Mechanism of HC-SCR of NOx on non-zeolitic oxide-based catalysts………...……….. 13
I.3. Identification of adsorbed NOx species by FT-IR Spectroscopy………....…….. 16
I.4. Objective of the study………...……... 19
II. Experimental
………...……….. 20II.1. Sample Preparation………....……... 20
II.1.1. Nb2O5/ZrO2………....……...… 20
II.1.2. WO3/Nb2O5………....……….. 22
II.2. Surface area measurements, X-ray diffraction, DR-UV-vis spectroscopy and UV-vis spectroscopy...………..…...… 23
II.3. Micro-Raman spectroscopy………...….. 23
II.4. FT-IR spectroscopy………...…... 24
II.4.1. Experimental Setup………...……. 24
ix
II.4.3. Surface Acidity of the Samples..………...…… 25
II.4.4. Reactivity of the surface species formed upon room temperature adsorption of NO+C3H6+O2 mixture on the samples... 25
II.5. Catalytic activity measurements...………...….. 25
III. Results and Discussion
………...….... 27III.1. Structural Characterization and Surface Acidity of Solid Acids based on Zirconia and Niobia...………....…... 27
III.1.1. Nb2O5/ZrO2………...… 27
III.1.1.1. Niobium species in the precursor solutions……...… 27
III.1.1.2. Structural characterization of the calcined samples………..… 30
III.1.1.3. Micro-Raman spectroscopy………..…... 33
III.1.1.4. DR-UV-vis spectroscopy...…... 35
III.1.1.5. Brønsted acidity……….…….. 36
III.1.1.6. Lewis acidity... 38
III.1.2. WO3/Nb2O5... 39
III.1.2.1. XRD Characterization... 39
III.1.2.2. Micro-Raman spectroscopy... 44
III.1.2.3. DR-UV-vis spectroscopy... 45
x
III.2. Catalytic Properties... 49
III.2.1. Catalytic Activity... 49
III.2.2. Mechanistic Studies... 52
III.2.2.1. Co-adsorption of (NO+O2)... 52
III.2.2.1.1. The ZrO2 sample... 52
III.2.2.1.2. The 25NbZ-P catalyst... 54
III.2.2.1.3. Summary of the Results on NO+O2 Co-adsorption on the samples studied... 58
III.2.2.2. Co-adsorption of (C3H6+O2) on the 25NbZ-P catalyst... 59
III.2.2.3. Reactivity of the surface species formed upon room temperature adsorption of NO+C3H6+O2 mixture on the 25NbZ-P catalyst... 61
III.2.2.4. Adsorption of acetone and its interaction with NO2 over the 25NbZ-P catalyst... 65
III.2.2.5. Adsorption of 1-Nitropropane on the 25NbZ-P catalyst... 71
III.2.2.6. Reactivity of the surface species formed upon room-temperature adsorption of NO+C3H6+O2 mixture on the 0.1Pd/25NbZ-P catalyst... 72
III.2.2.7. Summary of the Results on the Mechanistic studies on the C3H6-SCR of NOx on the 25NbZ-P sample... 75
xi
with Propene over 25NbZ-P catalyst... 80
III.2.3.1. Co-Adsorption of SO2+O2 over ZrO2 and 25NbZ-P samples... 80
III.2.3.2. Coadsorption of C3H6+O2+SO2 on the 25NbZ-P catalyst... 81
III.2.3.3. Effect of SO2 on the C3H6+NO+O2 surface reaction... 83
III.3. Investigation of the possibility for application of the 25NbZ-P and 20WN873 samples as catalysts for alcohol transformations... 85
III.3.1. Adsorption of Propan-2-ol over the ZrO2 sample... 86
III.3.2. Adsorption of Propan-2-ol over the Zr6Nb2O17 sample... 88
III.3.3. Adsorption of Propan-2-ol over the 20WN873 sample... 91
IV. Conclusions
... 95xii
LIST OF TABLES
Table 1. Typical compositions for the exhaust gases of diesel
and gasoline engines[1]... 2
Table 2. Changes in the exhaust emission limits with years[2,3,4].………...…..… 3 Table 3. Spectral characteristics of NOx species observed on
the metal oxides[69,89-91]... 18
Table 4. Composition and surface area of selected Nb2O5-ZrO2 samples... 21 Table 5. Nominal composition of the WO3-Nb2O5 samples... 22 Table 6. Assignments of the Raman bands observed in the spectra
shown in Fig. 4... 30
Table 7. Phase composition of the xNWy samples………...…… 43 Table 8. Assignments of the absorption bands in the spectra observed during
the NO+O2 coadsorption on the ZrO2 sample at room temperature... 54 Table 9. Assignments of the absorption bands in the spectra observed during
the NO+O2 coadsorption on the 25NbZ-P catalyst at room temperature.… 58 Table 10. Assignments of the adsorption bands in the spectra observed during
the high-temperature adsorption of C3H6 + O2 mixture on the 25NbZ-P
catalyst……... 60
Table 11. Assignments of the absorption bands observed during the investigation
of the reactivity of surface species formed upon room-temperature adsorption of NO+C3H6+O2 mixture on the 25NbZ-P catalyst followed
by heating of the evacuated IR cell in the 298–623 K temperature range... 66
xiii
the high-temperature adsorption of acetone and its coadsorption
with NO2 on the 25NbZ-P catalyst………... 68 Table 13. Assignments of the adsorption bands in the spectra observed
during the high-temperature adsorption of 1-Nitropropane
on the 25NbZ-P catalyst...……….. 73
Table 14. Assignments of the absorption bands observed during the investigation
of the reactivity of surface species formed upon room-temperature adsorption of NO+C3H6+O2 mixture on the 0.1Pd/25NbZ-P catalyst
followed by heating of the evacuated IR cell in the 298 – 623 K
temperature range………... 75
Table 15. Assignments of the adsorption bands in the spectra observed during the
high-temperature adsorption of propan-2-ol on the ZrO2 sample... 87 Table 16. Assignments of the adsorption bands in the spectra observed during the
high-temperature adsorption of propan-2-ol on the 25NbZ-P catalyst... 91
Table 17. Assignments of the adsorption bands in the spectra observed during the
xiv
LIST OF FIGURES
Fig. 1. The conversion efficiency (%) of a three-way catalyst as a function air to fuel (A/F) ratio. The lambda window, (A/F=14.7), corresponds to a
stoichiometric operation, λ = 1.…... 4
Fig. 2. UV-vis spectra of aqueous solutions of (NH4)(C2O4)2NbO.xH2O with different concentrations……...……… 27
Fig. 3. UV-vis spectra of peroxo solutions with different concentrations of the Nb(V)... 28
Fig. 4. Raman spectra of the Nb(V) oxalato (a) and peroxo (b) precursor solutions... 29
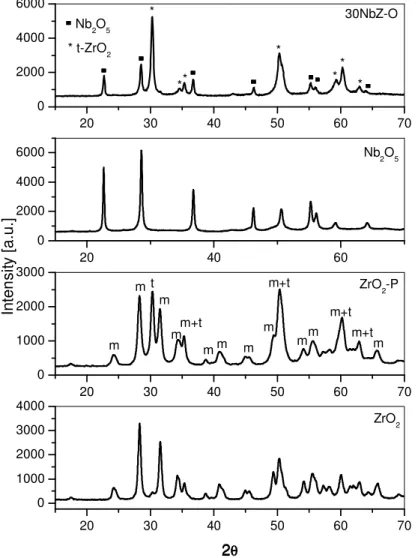
Fig. 5. XRD patterns of ZrO2, ZrO2-P, Nb2O5 and 30NbZ-O samples..……... 31
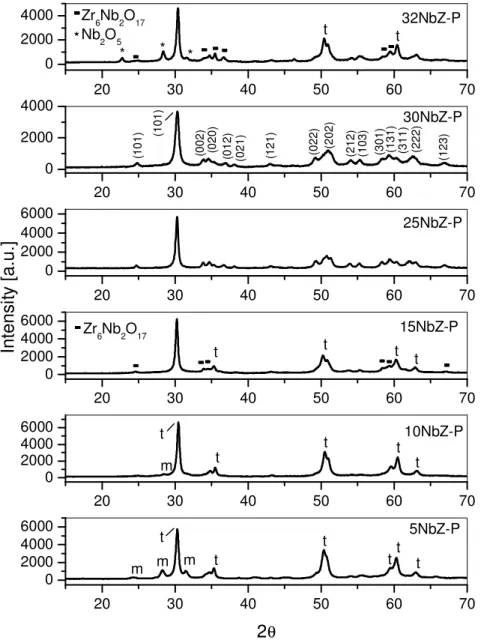
Fig. 6. XRD patterns of samples prepared from the peroxoniobium(V) precursor... 32
Fig. 7. Raman spectra of Nb2O5, 30NbZ-P and xNbZ-P samples………... 34
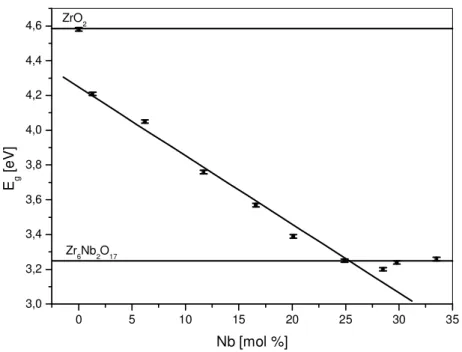
Fig. 8. DR-UV-vis spectra of xNbZ-P samples………... 35
Fig. 9. Absorption edge energies of the xNbZ-P samples………... 36
Fig. 10. Panel A: FT-IR spectra of the activated samples. Panel B: FT-IR spectra of lutidine (2.4 mbar) adsorbed at room temperature for 10 min followed by evacuation at 423 K for 15 min... 37
Fig. 11. FT-IR spectra of CO (17 mbar) adsorbed on the 25NbZ-P (a) and ZrO2 (b) samples at room temperature...……...…… 38
xv
at 773, 873, and 973 K………...………. 40 Fgi. 13. Diffractograms of 40WNy samples exposed to the heat treatment at
773, 873, and 973 K. (* indicates either the TT- Nb2O5 phase or
T- Nb2O5 phase)... 41
Fig. 14. Diffractograms of 60WNy samples exposed to the heat treatment at
773, 873, and 973 K. T- Nb2O5 phase)... 42
Fig. 15. Diffractograms of the 80WNy samples exposed to the heat treatment at
773, 873, 973 and 1073 K. (* indicates the monoclinic phase of WO3)... 43
Fig. 16. Raman spectra of the 20WNy (Panel A), 40WNy (Panel B), 60WNy (Panel C) and 80WNy samples (Panel D) calcined at 773 (a), 873 (b), 973 (c) and 1073 K (d). The peak intensities are normalized with respect to the internal standard BN…... 45 Fig. 17. Diffuse reflectance UV-vis spectra of Nb2O5, WO3 and xWNy samples:
(a) 20WN973, (b) 40WN973, (c) 60WN973, (d) 80WN1073…………... 46 Fig. 18. Band gap energy as a function of WO3 loading at different calcination
temperatures: : 773, O: 873, ∆∆∆:973, ∇∆ ∇∇:1073………...… 47 ∇ Fig. 19. FT-IR spectra of 2,6-lutidine (2.4Torr) adsorbed at RT for 10 min
followed by evacuation at 423 K for 15 min: (a) xWN773 samples, (b) xWN873 samples and (c) xWN973 samples. The spectra are
normalized with respect to the pellet weigh... 48 Fig. 20. Panel A: Catalytic activity for NOx reduction with propene over
25NbZ-P (a) and 0.1Pd/25NbZ-P catalysts (b) at various temperatures. Panel B: Conversion of propene into CO2 over 25NbZ-P (a) and
xvi
0.1Pd/25NbZ-P catalysts (b). Reaction conditions: 245 ppm NOx
(NO/NO2 = 1.77), 504 ppm C3H6, 9 vol.% O2, GHSV = 10 000 h
−1
)...…… 50 Fig. 21. Results of the SO2 poisoning experiment (Panel A), and effect of H2O and SO2
on the coversion of NOx over the 25NbZ-P catalyst (Panel B)...… 51
Fig. 22. FT-IR spectrum (a) of the ZrO2 sample taken after the adsorption of a
(10 mbar NO+20 mbar O2) mixture for 20 min at rt (Panel A) and gas
phase spectra in the presence (a) and absence (b) of the ZrO2 sample
(Panel A´). FT-IR spectra after the evacuation for 10 min at rt (a), and subsequently heating the isolated IR cell for 15 min at 423 K (b), 523 K (c) and 623 K (d) (Panel B) and corresponding gas phase spectra
(Panel B`)...…………...… 53 Fig. 23. Panel A: Gas phase spectra recorded at room temperature immediately
after the admission of a (10 mbar NO+20 mbar O2) mixture to the empty
IR cell (a), after the introduction of the same gas mixture immediately to the IR cell in the presence of the 25NbZ-P catalyst (b), and after 30 min (c). Panel B: FT-IR spectra of adsorbed NOx species taken immediately
during the exposure of the 25NbZ-P catalyst to the same gas mixture at room temperature (b), after 30 min (c) and upon dynamic evacuation
for 30 min (d)...………...… 55 Fig. 24. Panel A: FT-IR spectra of the 25NbZ-P catalyst taken after the adsorption
of a (10 mbar NO+20 mbar O2) mixture to the IR cell for 30 min at
room temperature followed by evacuation for 30 min (a), and after heating the isolated IR cell for 15 min at 373K (b), 423 K (c), 523 K (d) and 623 K
xvii
(e). Panel B: Gas phase spectra collected at 373K (b), 423 K (c), 523 K (d) and 623 K (e)………...…. 57 Fig. 25. FT-IR spectra collected during the exposure of the 25NbZ-P catalyst to
a (3 mbar C3H6 +10 mbar O2) mixture for 15 min at room temperature
(a) followed by heating the isolated IR cell for 15 min at 373K (b), 423 K (c), 473 K (d), 523 K (e), 573 K (f) and 623 K (g)………...… 59 Fig. 26. FT-IR spectra collected during the exposure of the 25NbZ-P catalyst
to a (18 mbar NO+3 mbar C3H6+10 mbar O2) mixture at room
temperature for 20 min followed by evacuation for 10 min (a) and heating the isolated IR cell for 15 min at 373 K (b), 423 K (c), 473 K (d), 523 K (e), 573 K (f) and 623 K (g). FT-IR spectra of the catalyst recorded in the 4000 – 2500 cm−1 region (Panel A), 2500 – 980 cm−1 region
(Panel B) and gas phase spectra (Panel C)……....…………....……...….. 62 Fig. 27. FT-IR spectra of acetone (1 mbar) adsorbed on the 25NbZ-P catalyst for
10 min at room temperature followed by evacuation for 10 min (a) and after heating the isolated IR cell for 15 min at 373 K (b), 423 K (c),
473 K (d), 523 K (e), 573 K (f) and 623 K (g)…………...……… 67 Fig. 28. FT-IR spectra of adsorbed acetone (1 mbar) on the 25NbZ-P catalyst for
10 min at room temperature followed by evacuation for 10 min and addition of 1.4 mbar NO2 (a) and heating the isolated IR cell for 15 min
at 373 K (b), 423 K (c), 473 K (d), 523 K (e), 573 K (f) and 623 K (g). FT-IR spectra of the catalyst recorded in the 4000 – 2500 cm−1 region (Panel A) and 2500 – 1000 cm−1 region (Panel B) and gas phase spectra
xviii
(Panel C)………...….. 69 Fig. 29. FT-IR spectra of 1-Nitropropane (0.1 mbar) adsorbed on the 25NbZ-P
catalyst for 10 min at room temperature followed by evacuation for 10 min (a) and after heating the isolated IR cell for 15 min at 373 K
(b), 423 K (c), 473 K (d), 523 K (e), 573 K (f) and 623 K (g)…...…… 72 Fig. 30. FT-IR spectra collected during the exposure of the 0.1Pd/25NbZ-P
catalyst to a (18 mbar NO+3 mbar C3H6+10 mbar O2) mixture at
room temperature for 20 min followed by evacuation for 10 min (a) and heating the isolated IR cell for 15 min at 373 K (b), 423 K (c), 473 K (d), 523 K (e), 573 K (f) and 623 K (g). FT-IR spectra of the catalyst recorded in the 4000 – 2500 cm−1 region (Panel A) and
2500 – 980 cm−1 region (Panel B)……...………… 74 Fig. 31. FT-IR spectra collected during the exposure of zirconia (dotted line) and
25NbZ-P samples (solid line) to a (0.5 mbar SO2 + 10 mbar O2) mixture
for 10 min at 473 K (a), 523 K (b) and 573 K (c)…………...… 80 Fig. 32. FT-IR spectra recorded during the exposure of 25NbZ-P sample to a gas
mixture (0.5 mbar SO2 + 3 mbar C3H6 + 10 mbar O2) for 20 min at
rt (a) followed by heating the isolated IR cell for 15 min at 373 K (b),
423 K (c), 473 K (d), 523 K (e) and 573 K (f)…………...…………... 82 Fig. 33. FT-IR spectra of the 25NbZ-P sample collected during the exposure
for 10 min to a (2 mbar C3H6 + 6 mbar NO + 4 mbar O2) mixture in the
absence (dotted line) and presence of 0.5 mbar SO2 (solid line) at 298 K
xix
Fig. 34. Panel A: FT-IR spectra collected during the exposure of the ZrO2 sample
to 1 mbar CH3CH2OHCH3 for 10 min at room temperature followed by
evacuation for 10 min (a), and after heating the isolated IR cell for 15 min at 373K (b), 423 K (c), 473 K (d) and 523 K (e). Panel A`: Gas
phase spectra at each temperature…...…... 88 Fig. 35. Panel A: FT-IR spectra collected during the exposure of the 25NbZ-P
catalyst to 1 mbar isopropanol for 10 min at room temperature followed by evacuation for 10 min (a) (in Panel A), and after heating the isolated IR cell for 15 min at 373 K (b), 423 K (c), 473 K (d), 523 K (e), 573 K (f) and 623 K (g). Panel A`: Gas phase spectra at each temperature……...… 90 Fig. 36. Panel A: FT-IR spectra collected during the exposure of the 20WN873
sample to a (1 mbar CH3CHOHCH3 +10 mbar O2) mixture for 1 min
at room temperature (a) followed by heating the isolated IR cell for 15 min at 373 K (b), 423 K (c) and 473 K (d). Panel A`: Gas phase
1
I. Introduction
I.1. Environmental Problems, Regulations and Possible Solutions
Gaseous products of the combustion of fossil fuels, like natural gas, diesel oil, coal, gasoline or fuel oil, are emitted as exhaust gas from mobile sources, e.g. Otto, Diesel, jet and rocket engines, and stationary sources, such as power plants and chemical industry. Air pollution caused primarily by the exhaust gases from the mobile sources is taken attention due to a gradual increase in the number of vehicles in the world. Despite
the fact that the fuel combusted in an ideal system should produce only water vapor (H2O)
and carbon dioxide (CO2), the presence of intolerable amounts of carbon monoxide (CO),
unburned and/or partially burned hydrocarbons (HCs) or particulate matter (PM) due to
incomplete oxidation and nitrogen oxides (NOx), sulfur oxides (SOx) produced from N-
and S-containing components in the fuel are detected in the exhaust gas as undesirable harmful or toxic chemicals. Their concentrations vary depending on the type of engine, fuel specification and driving conditions, e.g. idling, deceleration and acceleration. Typical compositions of the exhaust gases from lean burn (Diesel) and gasoline engines are shown in Table 1 [1].
Exhaust compounds listed in Table 1 can split into two subclasses:
1. Harmless compounds, CO2, H2O, O2 and N2 (not listed in Table 1), because they
do not affect the health of human-being directly. Nevertheless, among them CO2
and H2O cause greenhouse effect. That is why there is consensus on the limit for
the emission of CO2 released by automobiles, for which auto-manufacturers will
have been developing and applying the hybrid systems.
2. Regulated compounds, NOx, HC, CO, SOx and PM, which directly affect our
2
Table 1. Typical compositions for the exhaust gases of diesel and gasoline engines [1]. Exhaust components Diesel engine
Vol % Gasoline engine Vol % NOx 0.003 – 0.06 % 0.1 – 6 % HC 0.005 – 0.05 % C 0.5 – 1 % C CO 0.01 – 0.1 % 0.1 – 6 % O2 5 – 15 % 0.2 – 2 % H2O 2 – 10 % 10 – 12 % CO2 2 – 12 % 10 – 13.5 % SOx
(proportional to fuel S content) 10 – 100 ppm 15 – 60 ppm
PM 20 – 200 mg/m3 1 – 10 mg/m3
λ (A/F) 1.1 – 6 0.9 – 1.1
Since 1992, there exist European emission standards for heavy-duty diesel engines and gasoline and diesel engines for passengers. Table 2 shows the changes in the exhaust emission limits with the years [2,3,4]. Since Turkey import generally all types of engines from EU countries, EU legislations are met automatically [2].
Intense research has been lasting on modified and/or alternative fuels. Unleaded and oxygenated gasoline with higher octane rating reduces the CO and HC emissions
from the Otto engines. The emissions of SOx, NOx and PM are lowered by decreasing the
contents of sulfur and aromatic compounds in the fuel for the diesel engines [1]. EU countries have been using sulfur-free diesel and gasoline fuels (≤ 10 ppm S) since 2005 and sulfur-free fuels will be mandatory after 2009 [2]. Moreover, the use of synthetic diesel fuel and biodiesel can help reducing the regulated compounds. Alternative to the conventional diesel fuel, compressed natural gas and liquefied petroleum gas have
3
Table 2. Changes in the exhaust emission limits with the years [2,3,4].
Date CO NOx Total HC Non-methane HC HC+NOx PM
Gasoline engines g/kg g/kg g/kg g/kg g/kg g/kg 1992, Euro 1 2.72 - - - 0.97 - 1996, Euro 2 2.2 - - - 0.5 - 2000, Euro 3 2.3 0.15 0.20 - - - 2005, Euro 4 1.0 0.08 0.10 - - - 2009, Euro 5 1.000 0.060 0.100 0.068 - 0.005 2014, Euro 6 1.000 0.060 0.100 0.068 - 0.005 Diesel engines g/kg g/kg g/kg g/kg g/kg g/kg 1992, Euro 1 2.72 - - - 0.97 0.14 1996, Euro 2 1.0 - - - 0.7 0.08 2000, Euro 3 0.64 0.50 - - 0.56 0.05 2005, Euro 4 0.50 0.25 - - 0.30 0.025 2009, Euro 5 0.500 0.180 - - 0.230 0.005 2014, Euro 6 0.500 0.080 - - 0.170 0.005
HD Diesel engines g/kWh g/kWh HC, g/kWh Smoke, m-1 g/kWh
1992, Euro I 4.5 8.0 1.1 - 0.36 1996, Euro II 4.0 7.0 1.1 - 0.15 2000, Euro III 2.1 5.0 0.66 0.8 0.10 2005, Euro IV 1.5 3.5 0.46 0.5 0.02 2008, Euro V 1.5 2.0 0.46 0.5 0.02 2013, Euro VI 1.5 0.5 0.13 - 0.01
Another way of satisfying the emission limits is to utilize the advance technology in the diesel engine. Optimization of the engine parameters, e.g. injection rate shaping,
turbocharging, exhaust gas recirculation, fuel nozzle, improves the NOx and PM
emissions [1,5,6].
To ensure the strict emission limits the exhaust gas treatment techniques, which are so called “aftertreatment systems”, should be used by combining with the mentioned
solutions. The aftertreatment systems aim reducing the concentration of NOx over
4
Fig. 1. The conversion efficiency (%) of a three-way catalyst as a function air to fuel (A/F) ratio. The lambda window, (A/F=14.7), corresponds to a stoichiometric operation, λ = 1 [9].
The gasoline engine operating at the stoichiometric air to fuel ratio (A/F=14.7) is equipped with the “three-way catalytic converter” (TWC), which oxidizes CO and HC
and reduces NOx with HC, CO and H2 (Fig. 1) [7,8,9]. The overall catalytic reactions are
the followings:
Oxidation reactions
2CO + O2 → 2CO2
CxHy + (x+ ) O2 → xCO2 + H2O
Reduction reactions
2NO + 2CO → N2 + 2CO2
(2x+ ) NO + CxHy → (x+ ) N2 + xCO2 + H2O
2NO + 2H2 → N2 +H2O
Water-gas shift reaction CO + H2O → CO2 + H2
5
The commercially available three way catalyst contains Pt-Rh and/or Pd-Rh noble
metals dispersed on a washcoat made up of Al2O3, CeO2, ZrO2, CaO, MgO and La2O3
[10]. Although rhodium catalyzes the reduction of NOx, platinum and palladium help
oxidizing CO and HC. Any deviation from air to fuel ratio (A/F=14.7) results in changes of the amounts of oxidizing and reducing agents in the exhaust gas even though the legislation limits must always be met under any conditions. Moreover, fuel economy cannot be achieved since the optimum performance of the TWC is accomplished at the stoichiometric A/F ratio.
The advantages of lean-burn gasoline engines are to promote the complete combustion, which reduces the emissions of CO and HC, and to provide significant fuel economy increasing the air to fuel ratio from 14.7 to 25 without changing the engine
power [11,12]. Nevertheless, the high level of NOx emission appears as the main
drawback. Toyota Motor Corporation developed “NOx storage reduction (NSR) catalyst”
for the lean-burn gasoline engines in 1994 [13]. The working principle is that under lean
burn conditions NOx is stored in the form of nitrate/nitrite on the surface of basic
component (Ba sites). When the cycle shifts to fuel rich or stoichiometric (A/F= 14.7)
conditions, the stored NOx species are reduced by HC, CO and H2 over precious metals in
order to regenerate catalyst for the next cycle [7,8,11,13,14]. The NSR catalyst consists of two noble metals:
1. Pt, which oxidizes CO, NO and HC and promotes the formation of Ba(NO3)2
under oxidizing conditions and facilities the decomposition of Ba(NO3)2 under
reducing conditions [8,14].
2. Rh, which enhances the reduction of NO by CO and acts as a steam reforming
catalyst with ZrO2 making easier the removal of sulfur under reducing conditions
6
The NSR catalyst cannot be used commercially in any countries except Japan due
to high sulfur content of gasoline. The presence of SO2 in the exhaust gas poisons the NOx
storage sites and Pt catalyst forming BaSO4 under lean and PtS species under rich
conditions, respectively [7,8,14]. In order to regenerate NOx traps, the catalyst should be
heated at high temperature (873 – 973 K) under reducing conditions, which causes another problem “thermal degradation” [7,11,14]. Sintering of platinum, losing barium species due to diffusion through the alumina matrix forming barium aluminate and the reduction of surface area cause thermal deactivation, which mainly limits the durability of the NSR catalyst [7,14].
Since Diesel engines operate at even higher air to fuel ratio (A/F=26), the
emissions of CO and CO2 are lower in the exhaust gas compared to gasoline engines.
However, the quantity of particulate matter (PM) is high due to either insufficient
atomization of the fuel or non-optimal fuel injection. Moreover, NOx emission also
increases due to the high temperature combustion and high injection pressure of the fuel
[15]. In order to achieve the emission limits, the following lean NOx control technologies
have been researched and developed:
1. Selective reduction of NOx with PM uses the idea of simultaneous removal of soot
and NOx over the catalyst, i.e. AB2O4 spinel oxides or perovskite type oxides. Yet,
the practical application of this technology for the real diesel engines is not possible due to the inadequate, low-temperature activity of these catalysts [14]. On the other hand, Toyota Motor Corporation developed a new catalyst called “Diesel
Particulate NOx Reduction (DPNR) 4-way catalyst”, which reduces soot and NOx
simultaneously, with the modified engine control technologies [16,17]. In order to increase the particulate matter collection efficiency and to decrease the pressure drop, the pore diameter of the diesel particulate filter (DPF) is optimized, which is
7
coated with modified NOx storage and reduction catalyst comprising
Pt/(Ba+K)/(Al2O3+TiO2+Rh/ZrO2) [16]. The oxides, BaO and K2O, hosting Pt do
not only store NOx species but also create the active oxygen, which oxidizes the
deposited soot at 573 K [14,16,18]. If the system detects the pressure drop due to the accumulation of soot, the post-injection of fuel is achieved, which results in an
increase in temperature, an oxidation of PM and a reduction of NO3− species with
CO and/or HC at around 723 K [16,18]. Despite the fact that the fresh DPNR
system removes 80 % of NOx and PM in the exhaust gas, it may encounter the
problems like engine ash deposit and complexity of data logging [16,18].
2. Selective catalytic reduction of NOx with urea is the commercialized system for
heavy-duty vehicles since 2006, which is inspired from the SCR of NOx by
ammonia developed for the abatement of NOx from stationary sources
[14,19,20,21]. In commercial catalysts applied widely, VOx is the active
constituent supported on titania, whose acidity is enhanced with the addition of
WO3 and/or MoO3 [21,22]. Urea solution (32.5 % wt) is utilized in order to obtain
enough NH3 for the SCR of NOx. Optimum catalytic activity and selectivity are
observed for the oxide-based catalyst at temperatures between 523 and 673 K without losing any surface and structure features [19,20]. Nevertheless, above 873
K it is failing to keep the structure and the oxidation of NH3 starts to be the
predominant reaction. Moreover, urea-SCR system requires various sensors (for
urea, NH3 and NOx), sulfur-free diesel fuel in order to prevent the formation of
ammonium sulfates and pre-heating before the process starts [7,19,20,23]. Alternatively, zeolites-based SCR catalysts are also researched to fulfill EuroV and EuroVI emission limits [14,20]. The possible candidates are Fe-ZSM5 and Cu-ZSM5. The former is especially suitable in the temperature range of 673 – 923
8
K; yet, it suffers from moderate activity and adsorbed ammonia at low temperature
due to huge adsorption capacity for ammonia, which inhibits NOx SCR and causes
NH3-slip [20]. The Cu-ZSM5 catalyst shows better activity at low temperature
(~500 K); however, it has low hydrothermal stability and oxidizes NH3 at high
temperature [20].
3. Selective catalytic reduction of NOx with HC seems to be a promising method,
which either utilizes unburned hydrocarbon available in the exhaust gas or proceeds with the help of the fuel injected in front of the catalytic converter to
abate NOx [7,23]. The HC-SCR technology is not commercialized up to now
because of the following reasons [8,23,24,25]:
(i) Low selectivity toward N2.
(ii) Lack of activity at low temperature, which is around 423 K for the heavy-duty diesel engines.
(iii) Narrow temperature window to display the highest catalytic activity. (iv) Low sulfur and/or water tolerance.
(v) Low thermal stability of metal nanoparticles (against sintering or sublimation).
(vi) Difficulty in keeping the catalyst integrity and inherent property under changing working conditions.
Despite these, intense research on different systems (i.e. Pt-containing systems, Ir-containing catalysts, zeolite-based catalysts and Ag-promoted alumina) is still
proceeding in order to improve the weak features in the HC-SCR of NOx. The NO
reduction over zeolite-based catalysts by alkanes and/or alkenes under the lean conditions has been found promising if the concentration of water vapor in the exhaust is not high [24], which means that the practical application of
zeolite-9
based catalysts is impossible. Pt-containing systems show high activity and
selectivity at low temperature (~473 K) for HC-SCR of NOx [25]. The choice of
support (i.e. Al2O3, SiO2) and organic reductant (i.e. CH4, C2H4, C3H6, C3H8,
n-C4H10, n-C7H16 etc.) affects the activity and performance, which results in that the
direct control of the selectivity towards the N2 formation is challenging [24,25].
Ag-promoted Al2O3 takes attention due to its high activity, selectivity and
relatively wide operating temperature if the Ag loading is kept low [24,25]. The
activity of Ag-Al2O3 catalyst can be shifted to low temperature (~423 K for the
typical heavy-duty diesel engine) using longer hydrocarbon chain as reductants
and H2 in the exhaust atmosphere [16,23-25]. Nevertheless, the presence of
aromatics, which are available in the diesel fuel, affects the activity adversely [24]. This is the major problem to be tackled with. In the literature different metal
oxides (e.g. Al2O3, TiO2, ZrO2, MgO) promoted by additional metal oxides (i.e.
Mn, Fe, Co, Ni, Cu, Sn, Ga, In) or metal nanoparticle (i.e. Ag) are reported as
active catalysts for the SCR of NOx with HC [14,25].
The common problem of all introduced technologies is the temporary or
permanent diminution of the activity in the presence of SO2 in the exhaust gas.
Sulfur dioxide is an acidic oxide and it can interact with the basic centers on the catalyst surface producing various types of surface sulfates. It is often used as a probe
molecule for testing the catalyst basicity [26,27]. However, the interaction of SO2 with
cations cannot be excluded. In the group the oxygen atoms exhibit lone pairs of
electrons. Thus, coordinate covalent bond can be formed between the transition metal cation (Lewis acid) and the sulfate species (Lewis base)..
Ushikubo stated [28] that the promotion of the (VO2)2(SO4)/SiO2 catalyst with
10
gas. Moreover, he mentioned the catalysts, Pd-promoted Nb2O5 or Ta2O5, which
prevented the SO2 poisoning during the oxidation of HCs under the condition of diesel
exhaust [28]. Okazaki et al. reported [29] that the mixed oxides prepared by the
co-precipitation of niobium and iron show high activity for the NH3-SCR of NOx even in the
presence of SO2. Ziólek et al. [30] investigated the decomposition of NO over
Cu-containing mesoporous MCM-41 samples and concluded that the material
(Cu-NbMCM-41-32) can keep its initial activity upon the adsorption of SO2 if Nb is incorporated into
the lattice of this material. Furthermore, Ziólek and co-workers also studied the possibility for application of Pt-promoted niobiosilicate ordered mesoporous materials (NbMCM-41)
as NOx storage (NSR) and C3H6-SCR catalysts [31-33]. The presence of niobium in the
MCM-41 matrix enhanced the oxidative properties of the catalyst and NO was adsorbed in the form of nitrite/nitrate species [31-33]. However, the latter species were bound strongly to the surface, which hindered their further interaction with propene. The introduction of zirconium near niobium in the MCM-41 matrix weakened the bond of the nitrites/nitrates with the niobium species and enhanced the SCR selectivity [33].
Nb-containing oxides (as a promoter or a support) and Nb-containing mixed oxides are active for many industrially important reactions, such as oxidative dehydrogenation of alkanes, oxidation and ammoxidation of olefins, cracking of cumene, CO hydrogenation, oxidation of alkanes [34].
Viparelli and coworkers [35] investigated the acidic properties of niobia-supported catalysts with the decomposition of isopropanol and the oxidative dehydrogenation of
propane. Nb2O5-promoted TiO2 catalyst has high selectivity to propene in both reactions,
which indicates the presence of strong surface acid sites induced by Nb2O5 [35]. Hino et
al. [36], recently, reported a new solid acid based on mixed oxides of tungsten and niobium. This material shows remarkable activity, which is much higher than that of
11
tungstated zirconia, for reactions requiring strong Brønsted acidity, such as cracking of alkylbenzenes, dehydration of ethanol [38]. Carrazan et al. [37] concluded from the
results of pyridine adsorption that tungstated niobia (9.5 wt% WO3) shows strong surface
Lewis and Brønsted acid sites. Because of the high surface acidity, this sample has good selectivity in the formation of butene-2 from butan-2-ol at low temperature (473 K).
Reports on WO3/Nb2O5 samples [38-40] prepared by incipient wetness of stabilized
niobia (calcined at 773 K) state that crystalline WO3 is detected over the niobia support at
tungsten contents higher than 3 W/nm2. Martin et al. [41] found that niobia is able to
disperse WO3 up to 12.7 W/nm2 in samples prepared by impregnation of hydrated
niobium oxide with ammonium metatungstate. This high surface concentration can be due to formation of a solid solution by incorporation of tungsten cations into the niobia
support. The samples under ambient conditions exhibit Raman band at 980 cm−1 assigned
to tetrahedral/octahedral tungsten species [41] or polytungstes of the type W12O408− [40].
The strong surface acidity combined with increased reducibility of the WOx phase on
niobia, gives rise to large activity in the oxidation of ethylene to acetaldehyde and acetate species, and of isopropanol to acetone [41].
Despite the fact that niobium-containing materials show potential applications in various oxidation and acid-catalyzed reactions [34,42], a little attention has been given to
the performance of these catalysts in the SCR of NOx. Regarding the reduction of NO
with hydrocarbons in excess oxygen, Hinode and co-workers [43,44] reported that niobium oxide supported on titania is active in the reaction with ethene and propene showing maximum NO conversion of 30 and 62 %, respectively, at about 648 K. Using a
mechanical mixture of Nb/TiO2 and Mn2O3 improves the activity in the SCR with
propene and lowers the temperature of maximum NO conversion to 473 – 573 K [45].
12
and Co/Al2O3 catalysts in the SCR of NOx in diesel engine exhaust using light gas oil as
reductant [45,46]. The catalytic activity of the promoted catalysts was higher than that of the un-promoted ones and the adsorbed amount of sulfur was lower on the Nb-containing catalysts. It has been reported that the deposition of niobium on the surface of alumina lowers the concentration of basic sites [47], which should result in improved resistance to
SO2 poisoning.
Niobium-containing catalysts are usually prepared by impregnation using different
niobium precursors such as niobic acid, NbCl5, niobium oxalate, ammonium bisoxalato
complex of niobium, (NH4)3[NbO(C2O4)2].xH2O, and Nb alkoxides [48]. However, there
are difficulties in the preparation of niobium catalysts caused by the unacceptable characteristics of most niobium precursors. For example, niobium(V) alkoxides and chloride are moisture sensitive and expensive. Niobium oxalate and its ammonium complex have fairly low prices and are stable. However, the niobium oxalate precursors possess low solubility in aqueous solutions and they may precipitate during the course of catalyst preparation. In addition, these precursors cannot be used directly in the wet preparation of multicomponent systems as most metal ions form relatively insoluble metal oxalates.
Niobium(V) ions easily react with hydrogen peroxide producing peroxide complexes [49-53]. Peroxoniobium compounds are soluble in water [49-53] and are suitable for catalyst preparation. The interaction between the hydrated zirconia and
acidified peroxide solution results in the formation of dissolved ZrO2+ species [54].
Mixing soluble peroxoniobium complexes and ZrO2+ species at a molecular level is
beneficial for low-temperature synthesis of zirconia-based solid solutions and results in pure samples.
13
I.2. Mechanism of HC-SCR of NOx on non-zeolitic oxide-based catalysts
Although a NOx storage system looks more promising from a technical perspective
at present, the easiest and inexpensive way for removal of NOx from the exhaust of
lean-burn engines would be the direct HC-SCR technology. The rational design of efficient HC-SCR catalysts active in low-temperature domain requires the understanding of processes at molecular level.
Recent papers of Burch et al. [8,25] reviewed the main features of the HC-SCR
mechanism over non-zeolitic oxide-based catalysts. The mechanism of NOx reduction
over oxide-supported platinum group metals involves dissociative adsorption of NO over the reduced noble metal and recombination of two adsorbed nitrogen atoms to molecular nitrogen [26]. The role of hydrocarbons is to remove the adsorbed atomic oxygen
originating from NO and O2 dissociation to restore the reduced metal surface [26].
Despite the fact that over noble metals the decomposition mechanism was proven, some authors showed experimental evidence that the mechanisms suggested for oxide-based catalysts (see below) may also be involved for these catalysts [8,25 and the references therein].
Over noble metal-free oxide based catalysts, two DeNOx mechanisms have been
suggested independent of the nature of the catalyst and the nature of the reductant [8,25]. The first pathway (the NO reaction pathway [8,25]) considers the interaction of gaseous
or adsorbed NOx species with the hydrocarbon (HC) [55-74], which leads to the formation
of organic nitro compounds (R−NO2) as intermediates [75,55-72]. These intermediates
may produce molecular nitrogen directly [56-58] or decompose to other intermediates such as isocyanates [75,55,57,59-68], ammonia [61,62,65,66,68], oximes [64], nitriles [67,68], hydrocarbon oxygenates and adsorbed NO [71-74]. Thomas and coworkers [71,72] proposed that the hydrocarbon oxygenates act as reductants of adsorbed oxygen
14
produced by decomposition of NO to N2 to restore the corresponding catalytic sites.
Kantcheva and Cayirtepe [73] detected formation of methyl nitrite through the
intermediacy of nitromethane during the interaction of methane with NOx species
adsorbed on the surface of Pd-promoted tungstated zirconia. The organic nitrite decomposed to adsorbed NO and formates which reacted further to molecular nitrogen.
The same mechanism has been proposed in the case of CH4-SCR of NO over
Pd/Zr2Nb6O17 catalyst [74]. The DRIFT results on Au/γ-Al2O3 [76] indicated that the
initiation of the selective reduction of NO with propene involved the oxidation of NO to
NO2 followed by coupling of NO2 or its adsorbed species (nitrates or nitrites) with
activated C3H6 to form R−NOx adsorbed on the support. Although the latter surface
compound was not observed, it was proposed that it underwent internal rearrangement and decomposition leading to formation of NCO and CN species which further reacted
with NO+O2 or NO2 to nitrogen. The possible role of nitroorganic compounds as
intermediates has been supported by the fact that the decomposition of model nitroorganic compounds yielded similar products observed during the SCR reactions [56,61-63,66-70,73].
The second pathway (the hydrocarbon pathway [8,25]) considers the presence of
two potential oxidants, O2 and NOx, in the reaction gas mixture or strongly adsorbed NOx
species (nitrites and/or nitrates) on the catalyst surface, which can activate the
hydrocarbon producing oxygenates [77-81]. The latter compounds reduce the surface NOx
species to molecular nitrogen. This mechanism is supported by the fact that much higher
DeNOx activity has been observed when using oxygenates as reductants [55,63,82-88].
Scheme 1 (adopted from references [8,25]) summarizes the proposed mechanisms
for SCR of NOx on oxide-based catalysts. In conclusion, it is necessary to point out that
15
[8,25]. The lack of fundamental understanding of the HC-SCR mechanism accounts in part for the unsuccessful development of efficient oxide-based catalysts active in the low-temperature domain.
Scheme1. Reaction scheme of the HC-SCR of NO over oxide catalysts (adopted from references [8,25]).
Each of the DeNOx technologies discussed has weaknesses. The NOx storage and
urea-SCR systems are complex and expensive NOx aftertreatment strategies. The former
has impact on the engine operation and the latter has an impact on the vehicle architecture. The introduction of these two expensive after-treatment technologies in a large scale will increase the price difference existing today between the diesel and gasoline version of a vehicle [8]. Until recently the poor performance below 573 K prevented the commercialization of the oxide-based HC-SCR catalysts. For a car
manufacturer, the most attractive method for NOx removal from the exhaust is through
16
HC-SCR catalyst with right properties – high activity in the low-temperature region (423-623 K), good thermal and hydrothermal stability, good sulfur and water tolerance and low cost. The best candidate would be a material with acidic and redox properties which would prevent excessive sulfatation and ensure good activity in moist feeds.
I.3. Identification of adsorbed NOx species by FT-IR Spectroscopy
Adsorptions of NO and its coadsorption with O2 lead to formation adsorbed NOx
species, whose identifications are important for the mechanistic study of selective catalytic reduction of NO.
The negatively charged species usually observed on the surface of the catalysts are
nitrite ( ) and nitrate ( ) anions. The free nitrite anion has a Cs symmetry and
absorption bands due to νas(NO2) and νs(NO2) modes are at 1330 and 1260 cm-1,
respectively [89]. When is coordinated by one or two of its oxygen atoms, nitrito
species are formed. When is coordinated by its nitrogen atom, nitro compounds are
formed. Characteristic IR regions for nitro/nitrito compounds are given in Table 1.
The free nitrate is planar and has a D3h symmetry. It shows three IR active modes:
asymmetric stretching (ν3) at 1430 cm-1, out-of-bending (ν2) at 825 cm-1 and
in-plane-bending (ν4) at 722 cm-1 [90]. ν1 is symmetric and is only observed in Raman spectra.
After coordination, ν1 becomes IR active and the degeneracy of ν3 is removed so that ν3
splits into two components. The magnitude of the splitting depends on the coordination type of the nitrates. The absorption ranges for nitrates are presented in Table 3.
The IR absorption bands for nitrite and nitrates sometimes overlap in the
1350-1550 cm-1 region. In that case, combination bands of nitrates can be used for structural
identification. The combination bands of the bridged nitrates are at 2845-2800 cm-1
17
cm-1[νs(NO2) + δ(ONO)]. Bidentate nitrates produce combination bands in the region of
2600 cm-1 [ν
s(N=O) + νs(NO2)] and pair of bands at 1755 and 1700 cm-1 [νs(NO2) +
δ(ONO)] [90].
Stability of adsorbed NOx species can give information about their nature. The
noncharged species, e.g. NO, (NO)2, NO2, N2O3 and N2O4, are generally weakly adsorbed
and easily removed from the surface upon evacuation at room temperature. On the other
hand charged species, e.g. , , , are stable. They need to be heated at
elevated temperatures in order to desorb from the surface. The nitro species are more stable than the nitrito species and bridged and bidentate nitrates are more thermally stable than the monodentate nitrates.
18
Table 3: Spectral characteristics of NOx species observed on the metal oxides [69, 89-91].
NOx Species Vibration Modes Wavenumbers (cm-1)
Free nitrite ion,
νas(NO2) νs(NO2) δ(ONO) 1250 1335 830 Nitro, νas(NO2) νs(NO2) δ(ONO) 1370-1470 1320-1340 820-850 Nitrito, ν(N=O) ν(NO) δ(ONO) 1400-1485 1050-1100 820-840
Chelated Nitrito, νas(NO2)
νs(NO2) δ(ONO) 1270-1390 1170-1225 840-860 Bridging nitro, νas(NO2) νs(NO2) 1390-1520 1180-1260
Bidentate nitro νas(NO2)
νs(NO2)
1390-1520 1180-1260
Free nitrate ion, νas(NO2) 1430
Monodentate nitrate, νas(NO2)
νs(NO2) ν(NO) 1450-1570 1250-1330 970-1035 Bidentate nitrate, νas(NO2) νs(NO2) ν(NO) 1200-1310 1003-1040 1500-1620
Bridged nitrate, νas(NO2)
νs(NO2) ν(NO) 1200-1260 1000-1030 1590-1660 M O N O O M O O N O M N O O M O N O M O O N M N O M O M O N O O M
19
I.4. Objective of the study
The aim of the thesis is (i) to develop synthetic routes for novel niobium-containing solid acids and (ii) to investigate the role of niobium for improving the sulfur tolerance of catalysts for selective catalytic reduction of NO with hydrocarbons in excess oxygen and (iii) to study the potential of the niobium-containing solid acids for alcohol transformations.
This study is comprised of three parts:
1. In the first part, synthesis methods are developed for the synthesis of new nanostructured solid acids based on niobium-zirconium and tungsten-niobium. The synthesized materials are characterized structurally by XRD, Micro-Raman spectroscopy and DR-UV-vis spectroscopy with respect to compositional changes and/or calcination temperatures. By means of in situ FT-IR spectroscopy the acidic sites developed on the surface of samples after each modification are probed by the adsorption of 2,6-dimethylpyridine and/or CO.
2. In the second part, the samples possessing the highest concentration of Brønsted
acid sites are investigated as catalysts for the selective catalytic reduction of NOx
with propene. In order to elucidate the reaction mechanism, in situ FTIR investigations of the adsorption and co-adsorption of the reagents have been carried out and their interactions were followed at various temperatures.
Furthermore, what kind of surface SOx species are formed and how the NOx and
CxHyOz compounds are affected by the presence of SO2 are examined in order to
make conclusions about the SO2 poisoning effect.
3. In the last part, by means of in situ FTIR spectroscopy the potential of the samples with the highest Brønsted acidity is evaluated as catalysts for other reactions like dehydrogenation or oxidative dehydration of alcohols.
20
II. Experimental
II.1. Sample Preparation
Amorphous ZrOx(OH)4-2x was prepared by hydrolysis of ZrCl4 (Merck, for
synthesis) with concentrated (25 %) solution of ammonia as already described [92]. After
washing (negative test for Cl− ions) the precipitate, it was dried at 383 K in air for 24 h.
According to XRD, the solid (specific surface area of 298 m2/g) was amorphous. This
material (denoted as ZrO2-383) was used to prepare the tungsten- and niobium-containing
samples.
II.1.1. Nb2O5/ZrO2
A solution of the complex [Nb2(O2)3]4+ was prepared according to the procedure
described in reference [52]. The starting Nb(V) precursor, (NH4)(C2O4)2NbO.xH2O
(Aldrich, x = 19.15), was added under stirring in small portions to a 30 % H2O2 solution
(Merck, without stabilizer) acidified to a pH ~ 0.5 by concentrated HNO3 and then the
solution was heated for 1 h at 323 K. Hydrated zirconia was impregnated for 24 h, under stirring, at room temperature with the peroxoniobium(V) solutions taken in concentrations
ensuring ZrO2:Nb2O5 mole ratios ranging from 150:1 to 4:1. The amount of the hydrated
zirconia was determined according to the weight loss after the calcination for 2 h at 873 K. The liquid was removed from the suspension by gentle evaporation at 343 K and the solid was calcined under static air for 2 h at 623 K and 2 h at 873 K (heating rate 10K/min). The samples obtained from the niobium(V) peroxo precursor are denoted as xNbZ-P, where x stands for the amount of niobium in wt %.
For comparison purposes a Nb2O5-ZrO2 sample containing ZrO2:Nb2O5 mole ratio
21
ammonium niobium oxalate. This sample (labeled as 30NbZ-O) was dried and calcined according to the procedures described above. The nominal niobium content and the
surface areas of selected Nb2O5-ZrO2 samples are summarized in Table 4.
Table 4. Composition and surface area of selected Nb2O5-ZrO2 samples
Sample Nb wt% Mole ratio ZrO2:Nb2O5 Surface area, m2/g ZrO2 - - 25 5NbZ-P 5 30:1 28 10NbZ-P 10 15:1 18 15NbZ-P 15 10:1 - 19NbZ-P 19 8:1 22 25NbZ-P 25 6:1 42 30NbZ-P 30 5:1 37 32NbZ-P 32 4.8:1 - 30NbZ-O 30 5:1 -
Niobium pentaoxide was obtained by the precipitation of Nb2O5.nH2O with a
concentrated (25%) solution of ammonia from an aqueous solution of ammonium niobium oxalate at pH = 8.2. The precipitate was separated from the solution, washed with deionized water (negative test for oxalate ions) and calcined for 2 h at 873K. A
sample of zirconia (denoted as ZrO2-P) was prepared by suspending hydrated zirconia in
H2O2 (30%) for 24 h under stirring. Then the material was filtered off, dried and calcined
for 2 h at 873 K. Monoclinic zirconia was obtained by the calcination of hydrated zirconium oxyhydroxide at 873 K for 2 h.
22
II.1.2. WO3/Nb2O5
Niobium(V) peroxo solutions with different concentrations were prepared as described above. To these solutions various amounts of solid ammonium metatungstate
(AMT, (NH4)6H2W12O40.18H2O) were added ensuring the desired Nb2O5:WO3 mole
ratios (Table 5). The liquid was evaporated by a gentle heating followed by calcination of
the solid substances at various temperatures for 2 h. The WO3-Nb2O5 samples are denoted
as xWNy, where x indicates the amount of WO3 in wt% and y stands for the calcination
temperature.
WO3 was prepared by dissolving (NH4)6H2W12O40.18H2O in 30 % H2O2. After the
evaporation of the liquid the solid material was calcined at 773 K for 2 h.
Table 5. Nominal composition of the WO3-Nb2O5 samples
Sample WO3 wt % Nb2O5:WO3 mole ratio 10WN 10 7.85:1 20WN 20 4:1 40WN 40 1.3:1 60WN 60 0.6:1 80WN 80 0.2:1
23
II.2. Surface area measurements, X-ray diffraction, DR-UV-vis spectroscopy and UV-vis spectroscopy
The BET surface areas of the samples were measured by nitrogen adsorption at 77 K using Monosorp apparatus from Quantachrome Corporation, Autosorp-1-C/MS. Prior
the measurements, the samples were dehydrated under vacuum (~10−2 torr) for 2 h at
623K.
XRD analysis was performed on a Rigaku Miniflex diffractometer with Ni-filtered
Cu Kα radiation (λ = 1.5405Å) under ambient conditions. The scan speed was 2°/min.
DR-UV-vis spectra were obtained under ambient conditions with a fiber optic spectrometer AvaSpec-2048 (Avantes) using WS-2 as a reference. The DR-UV-vis spectra were smoothed before the calculation of absorption edge energy.
UV-vis spectra of liquid samples were recorded using a Varian Cary 5 double beam spectrophotometer with a resolution of 2 nm over a wavelength range from 600 to 200 nm in the absorbance mode.
II.3. Micro-Raman spectroscopy
The micro-Raman spectra were recorded on a LabRam confocal Raman microscope with a 300 mm focal length. The spectrometer is equipped with both HeNe laser operated at 20 mW, polarized 500:1 with a wavelength of 623.817 nm, and dipole-pumped solid state laser operated at 50 mW, polarized 100:1 with a wavelength of 523.1 nm, and a 1024x256 element CCD camera. The signal collected was transmitted through a fiber optic cable into a grating with 600 g/mm spectrometer.
24
II.4. FT-IR spectroscopy
The FT-IR spectra were recorded using a Bomem Hartman & Braun MB-102 model FT-IR spectrometer with a liquid-nitrogen cooled MCT detector at a resolution of 4
cm−1 (128 scans). The FT-IR spectra were smoothed without losing any features.
II.4.1. Experimental Setup
The IR cell allowed recording of the spectra at ambient and elevated temperatures
(with BaF2 windows). The sample holder of the cell can be moved up and down relatively
to the light beam, which gives the possibility for the subtraction of the gas phase spectrum when needed. The IR cell is connected to a vacuum/adsorption apparatus.
II.4.2. Activation of the Samples
The self-supporting discs (0.01 - 0.035 g/cm2) were activated in the IR cell by
heating for 1 h in a vacuum at 723 K and in oxygen (100 mbar, passed through a trap cooled in liquid nitrogen) at the same temperature, followed by evacuation for 1 h at 723 K.
The spectra of the activated sample were taken at high temperature and room temperature, which were used as background references. The spectra of the samples that were subjected to heat treatments at elevated temperatures were recorded at those temperatures. The high temperature background reference was used in the subtraction of the spectra taken at high temperatures and correspondingly the room temperature background reference was used for the spectra registered below 423 K.
25 II.4.3. Surface Acidity of the Samples
The surface acidity of the samples was investigated by in situ FT-IR spectroscopy using 2,6-dimethylpyridine (2,6-DMP or lutidine), CO and NO as probe molecules. The 2,6-dimethylpyridine (lutidine, Sigma-Aldrich, redistilled) adsorption test was carried out by the admission of 2.4 mbar of the base into the IR cell and left in contact with the sample for 10 min. The excess 2,6-lutidine was then evacuated at room temperature for 15 min, followed by desorption of the strongly bonded base fraction in the temperature range 150 – 723 K. The CO (99.95%, BOC) used was passed through a trap cooled by liquid nitrogen before admission to the IR cell. The purity of the NO gas (Air Products) was 99.9%.
II.4.4. Reactivity of the surface species formed upon room temperature adsorption
of NO+C3H6+O2 mixture on the samples
3 mbar of C3H6, 10 mbar of O2 and 18 mbar of NO were premixed in the flange at
room temperature; afterwards the gas mixture was admitted to the IR cell. After reaching the equilibrium between the gas phase and the surface species, the gas phase was evacuated for 10 min. Then, the closed IR cell was heated from 298 K to 623 K in order to follow the reactivity of the surface species. The duration time was 15 min for each temperature level.
II.5. Catalytic activity measurements
The catalytic tests of NOx reduction by propene were carried out in a tubular flow
reactor (quartz glass) with an internal diameter of 6.0 mm. The catalyst sample was loaded in the form of particles with irregular shape and size of 0.6 – 1.2 mm. The gas
26
S.A., Model 31 M), CO/CO2/O2 (Maihak), THC (ThermoFID). Gas supply section was
based on mass-flow controllers manufactured by Bronkhorst. The catalyst was tested at
GHSV of 10 000 h−1. The reaction mixture used in the catalytic test contained 245 ppm of
NOx (NO/NO2 = 1.77), 504 ppm C3H6, 9 vol. % of oxygen and nitrogen for balance to
100 vol. %. The steady-state test was made upon step-wise increase of the reaction temperature and holding at each temperature (approximately 1.5 h) to reach a constant
conversion value. The conversion degrees of NOx (taken as a measure of the catalytic
activity) and propene were calculated using the inlet and outlet concentrations. The SO2
poisoning experiment was performed with 56 ppm of SO2 in the inlet and under fast
poisoning conditions (200 ppm of SO2 in the inlet) at temperature corresponding to the
maximum NOx conversion. The effect of H2O vapour was tested with 1.2 vol % of H2O in
27
III. Results and Discussion
III.1. Structural Characterization and Surface Acidity of Solid Acids based on Zirconia and Niobia
In this part we describe the structural characterization and the surface acid properties of solid acids based on zirconia and niobia.
III.1.1. Nb2O5/ZrO2
Here, we describe the results of structural characterization of Nb2O5, ZrO2 and
Nb2O5-ZrO2 oxide system. The mixed oxides were prepared using acidic solutions of the
peroxoniobium(V) complex, [Nb2(O2)3]4+.
III.1.1.1. Niobium species in the precursor solutions
Fig. 2 shows the UV-Vis spectra of aqueous solutions of (NH4)(C2O4)2NbO.xH2O
with different concentrations. The absorption at 270 nm indicates the presence of the 2:1
oxalato-niobium complex [Nb(OH)2(C2O4)2]− [49].
250 300 350 400 0 1 2 3 A b s o rb a n c e Wavenumber [nm] 270
Fig. 2. UV-vis spectra of aqueous solutions of (NH4)(C2O4)2NbO.xH2O with different
28
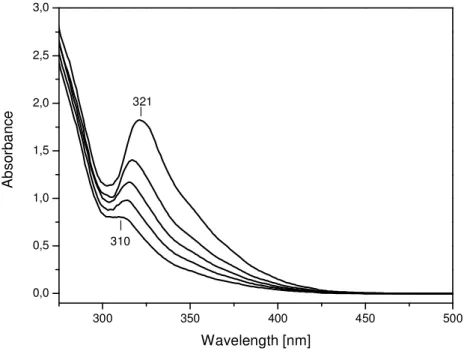
The UV-vis spectra of the peroxo solutions with different concentrations of the Nb(V) are shown in Fig. 3. The color of the solutions is yellow. Three different Nb(V) peroxo complexes with peroxo:Nb mole ratios of 1:1, 1:2 and 2:3 are reported [49-51]. The absorption bands with maxima at 310 – 321 nm observed in Fig. 3 are characteristic of the 2:3 complex and indicate that the Nb(V) peroxo solutions contain the ions
[Nb2(O2)3]4+. The 1:1 and 1:2 complexes absorb below 290 nm [49-51].
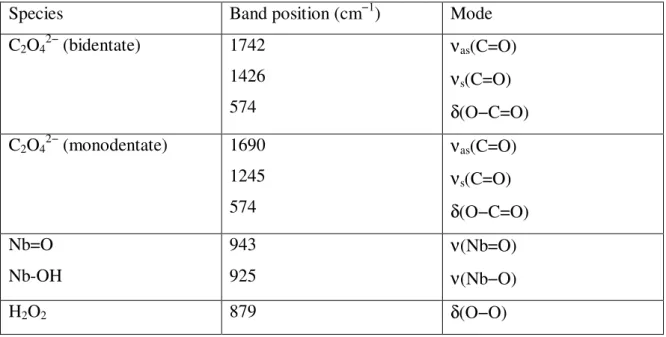
Fig. 3. UV-vis spectra of peroxo solutions with different concentrations of the Nb(V). The Raman spectra of the of the Nb(V) oxalate (spectrum a) and peroxo (spectrum b) precursor solutions used for the preparation of the 25NbZ-P sample are shown in Fig.
4. Coordinated oxalate ion exhibits vibrational modes between 1750 and 1200 cm−1
corresponding to the carboxylic groups [90]. In Fig. 4, spectrum a, four bands are
observed in this region and they are attributed to C2O42− ions coordinated in bidentate and
monodentate modes (see Table 6). The intensities of the oxalate bands in the spectrum of the peroxo precursor (Fig. 4, spectrum b) are very low indicating that decomposition of
the [Nb(OH)2(C2O4)2]− complex has occurred. The intensities of these bands remain
300 350 400 450 500 0,0 0,5 1,0 1,5 2,0 2,5 3,0 A b s o rb a n c e Wavelength [nm] 321 310
29
constant within a period of 30 min of the decomposition process. The signals at 1050 and
720 cm−1 belong to the NO3− ions arising from the dissociation of nitric acid used for pH
adjustment. The strong band at 879 cm−1 is typical of the δs(O−O) mode of hydrogen
peroxide present in excess. The characteristic ν(O−O) vibrations of the Nb(V) peroxo
complexes fall between 890 and 800 cm−1 [52,53] and are not visible because of the
strong H2O2 band. 2000 1800 1600 1400 1200 1000 800 600 In te n s it y [ a .u .] Wavenumber [cm-1] 1745 1 6 9 0 1426 1245 1 0 5 0 720 943 9 2 5 879 5 7 4 a b 5 0 0
Fig. 4. Raman spectra of the Nb(V) oxalato (a) and peroxo (b) precursor solutions. Based on these data, the following processes of decomposition of the Nb(V)
oxalato complex in excess H2O2 can be proposed:
[NbO(C2O4)2]− + H2O → [Nb(OH)2(C2O4)2]−
2[Nb(OH)2(C2O4)2]− + 7H2O2 + 6H+ → [Nb2(O2)3]4+ + 8CO2 +12H2O
![Table 1. Typical compositions for the exhaust gases of diesel and gasoline engines [1]](https://thumb-eu.123doks.com/thumbv2/9libnet/5959239.124483/22.892.132.773.147.537/table-typical-compositions-exhaust-gases-diesel-gasoline-engines.webp)
![Table 2. Changes in the exhaust emission limits with the years [2,3,4].](https://thumb-eu.123doks.com/thumbv2/9libnet/5959239.124483/23.892.136.790.145.731/table-changes-exhaust-emission-limits-years.webp)
![Table 3: Spectral characteristics of NO x species observed on the metal oxides [69, 89-91]](https://thumb-eu.123doks.com/thumbv2/9libnet/5959239.124483/38.892.166.751.145.1152/table-spectral-characteristics-x-species-observed-metal-oxides.webp)