Energy-Price-Driven Query Processing in
Multi-center Web Search Engines
Enver Kayaaslan
Bilkent University Ankara, Turkey[email protected]
B. Barla Cambazoglu
Yahoo! Research Barcelona, Spain[email protected]
Roi Blanco
Yahoo! Research Barcelona, Spain[email protected]
Flavio P. Junqueira
Yahoo! Research Barcelona, Spain[email protected]
Cevdet Aykanat
Bilkent University Ankara, Turkey[email protected]
ABSTRACT
Concurrently processing thousands of web queries, each with a response time under a fraction of a second, necessitates maintaining and operating massive data centers. For large-scale web search engines, this translates into high energy consumption and a huge electric bill. This work takes the challenge to reduce the electric bill of commercial web search engines operating on data centers that are geographically far apart. Based on the observation that energy prices and query workloads show high spatio-temporal variation, we propose a technique that dynamically shifts the query work-load of a search engine between its data centers to reduce the electric bill. Experiments on real-life query workloads obtained from a commercial search engine show that signif-icant financial savings can be achieved by this technique.
Categories and Subject Descriptors
H.3.3 [Information Storage Systems]: Information Re-trieval Systems
General Terms
Algorithms, Economics, Experimentation, Performance
Keywords
Web search engine, data center, query processing, energy
1.
INTRODUCTION
A major challenge in front of web search engines is to cope with the growth of the Web and the increase in user query traffic volumes while maintaining query response times un-der a fraction of a second. The efficiency becomes an even more critical issue as user expectations about the quality of
Permission to make digital or hard copies of all or part of this work for personal or classroom use is granted without fee provided that copies are not made or distributed for profit or commercial advantage and that copies bear this notice and the full citation on the first page. To copy otherwise, to republish, to post on servers or to redistribute to lists, requires prior specific permission and/or a fee.
SIGIR’11,July 24–28, 2011, Beijing, China.
Copyright 2011 ACM 978-1-4503-0757-4/11/07 ...$10.00.
search results and the competitive nature of the search mar-ket enforce the use of more sophisticated and costly process-ing techniques. Consequently, satisfyprocess-ing the efficiency con-straints in web search necessitates the use of large compute infrastructures as well as highly efficient software platforms. The current solution to the efficiency problem is to carry out the web search business over massive data centers, con-taining tens of thousands of computers [3]. Due to space and power requirements, large-scale search engines spread their infrastructures and operations across several, geographically distant data centers. The key operations in a search engine involve web crawling, indexing, and query processing. In practice, a very large index is built over the crawled web doc-uments. Each data center maintains a replica of the most recent version of this index. Queries issued by users are processed on the index replica in the closest available data center, yielding reductions in query response latencies.
As a consequence of their massive scale, search data cen-ters incur significant financial overheads in the forms of de-preciation costs, maintenance overheads, and operational ex-penses, taking away a large slice of the profit made through sponsored search. Among the operational expenses, an im-portant cost is due to high energy consumption [2]. Most standard search engine tasks (e.g., query processing, crawl-ing, indexcrawl-ing, text processcrawl-ing, link mining) are parallelized on many computers, consuming lots of energy. This, in turn, implies high electric bills for search engine companies.
In this work, we make an early attempt to reduce the electric bills of large-scale, multi-center search engines. Our work is mainly motivated by the following two observations: • Energy prices show high spatio-temporal variation, i.e., they differ across countries and change in time [15]. • Query workloads of search data centers show spatio-temporal variation as well, i.e., the workload of a data center varies during the day [6] and some data centers may be under high traffic while others are mostly idle. Based on these observations, we develop a technique that shifts the query workload from search data centers with higher energy prices to those with lower prices, to reduce the total energy cost. Although the idea of shifting the workload between data centers is simple, there are two con-straints that complicate the problem in the context of web search engines. First, in practice, each data center has a fixed amount of hardware resources, i.e., a data center can handle only a certain amount of query volume, at any given
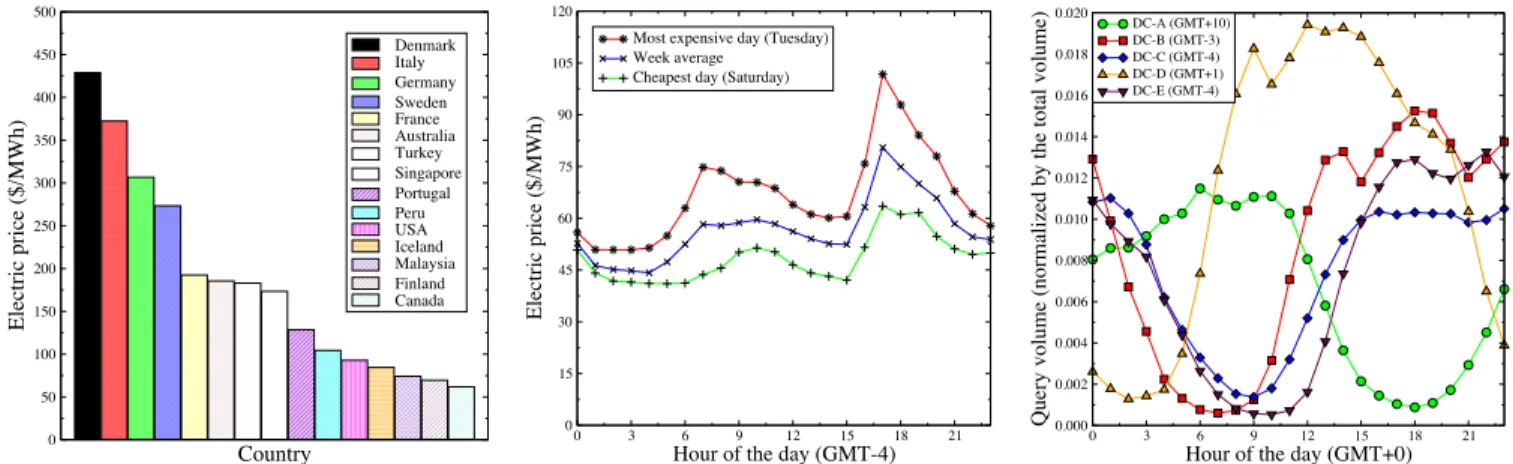
Country 0 50 100 150 200 250 300 350 400 450 500 Electric price ($/MWh) Denmark Italy Germany Sweden France Australia Turkey Singapore Portugal Peru USA Iceland Malaysia Finland Canada
Figure 1: Electric prices in a rep-resentative set of countries in the world (source: Wikipedia).
0 3 6 9 12 15 18 21
Hour of the day (GMT-4)
0 15 30 45 60 75 90 105 120 Electric price ($/MWh)
Most expensive day (Tuesday) Week average
Cheapest day (Saturday)
Figure 2: Hourly prices obtained over 15 different zones in the East Coast of the US (source: NYSIO).
0 3 6 9 12 15 18 21
Hour of the day (GMT+0)
0.000 0.002 0.004 0.006 0.008 0.010 0.012 0.014 0.016 0.018 0.020
Query volume (normalized by the total volume)
DC-A (GMT+10) DC-B (GMT-3) DC-C (GMT-4) DC-D (GMT+1) DC-E (GMT-4)
Figure 3: Hourly query traffic vol-umes observed on search front-ends of a commercial search engine. time. Hence, it is not always feasible to redirect the entire
search traffic volume to the data center with the cheapest electricity. Second, in web search, query response times are bounded. Hence, a query can be transferred from one data center to another only if the network latency between the data centers does not violate a query response time con-straint. Our problem formulation captures both constraints. The following summarizes our contributions. We discuss the energy-price-driven query processing problem in the con-text of multi-center web search engines. As a solution, we propose a probabilistic algorithm that dynamically shifts query workloads between data centers. We evaluate the pro-posed algorithm via simulations over a realistic search engine setting, using user queries obtained from a commercial web search engine, actual search front-ends, a large Web index, and real-life electric price data. Our results indicate signifi-cant financial savings for large-scale web search engines.
The rest of the paper is organized as follows. Section 2 mo-tivates the idea of query workload shifting. In Section 3, we present the energy-price-driven query processing problem, together with the involved issues and performance metrics. The proposed solution is described in Section 4. We discuss, in Section 5, the details of our experimental setup. Section 6 provides the experimental results. A discussion on further issues is available in Section 7. Related literature is surveyed in Section 8. Finally, Section 9 concludes the paper.
2.
MOTIVATION
Search data centers. Multi-center web search engines are known to have advantages over centralized search engines in terms of scalability and performance [7]. In practice, to further increase these benefits, the number and location of data centers should be carefully selected. The decision about data center locations is influenced by many factors, such as branding, user bases, energy prices and availability, climate, tax rates, and the political stability of countries. An impor-tant factor among these is industrial energy prices. A typi-cal commercial web search data center consumes significant amounts of energy, which translates to an electric bill with many zeros for the search engine company.1 Hence, there 1Some back-of-the-envelope calculations in a recent work es-timate Google’s annual electric bill to be $38 million [15].
is a tendency to build data centers in countries where the energy is cheap (without completely ignoring other factors). Variation in electric prices. Electric prices vary de-pending on geographical location. Fig. 1 shows the electric prices in a representative set of countries.2 According to the figure, there is no apparent correlation between energy prices and the spatial distribution of countries. The price ra-tio between the most expensive (Denmark) and the cheapest (Canada) countries is about seven. Even if data center loca-tions are restricted to the five cheapest countries, the price ratio is about 1.5. These numbers demonstrate the poten-tial for financial savings in shifting query workloads from locations having high electric prices to cheaper locations.
Electric prices also vary in time, depending on factors such as supply/demand, capacity of transmission lines, and sea-sonal effects. The reader may refer to [15] for an analysis on the temporal behavior of electric prices in a wide range of markets in the US. Herein, we restrict our focus to hourly price variation within a day. As an illustrative case, we ob-tain the hourly electric prices from the day-ahead market of a power supplier, serving 15 zones in the East Coast of the US, and compute the hourly prices, averaged over all zones, for seven consecutive days in a week of December 2010.3
Fig. 2 shows the hourly electric prices for the cheapest and most expensive days, together with the average prices of the week. In general, there is high correlation across the days in terms of hourly price distribution. Prices make a peak early in the morning and late in the afternoon. Although web queries are online tasks, i.e., the processing of a user query cannot be delayed until the prices fall, temporal price variation provides further flexibility for workload shifting.
Variation in query traffic. The spatio-temporal varia-tion in the query traffic volume provides another motivavaria-tion to shift query workloads of data centers. Due to differences in time zones, some search data centers may operate under heavy workloads while others are underutilized. Moreover, the query traffic volume fluctuates throughout the day [6].
Fig. 3 shows the hourly query traffic volumes observed on five different front-ends of a commercial search engine, 2Wikipedia – Electricity pricing, visited on Dec. 28, 2010: http://en.wikipedia.org/wiki/Electricity_pricing. 3New York Independent System Operator, visited on Dec. 28, 2010: http://www.nyiso.com/public/index.jsp.
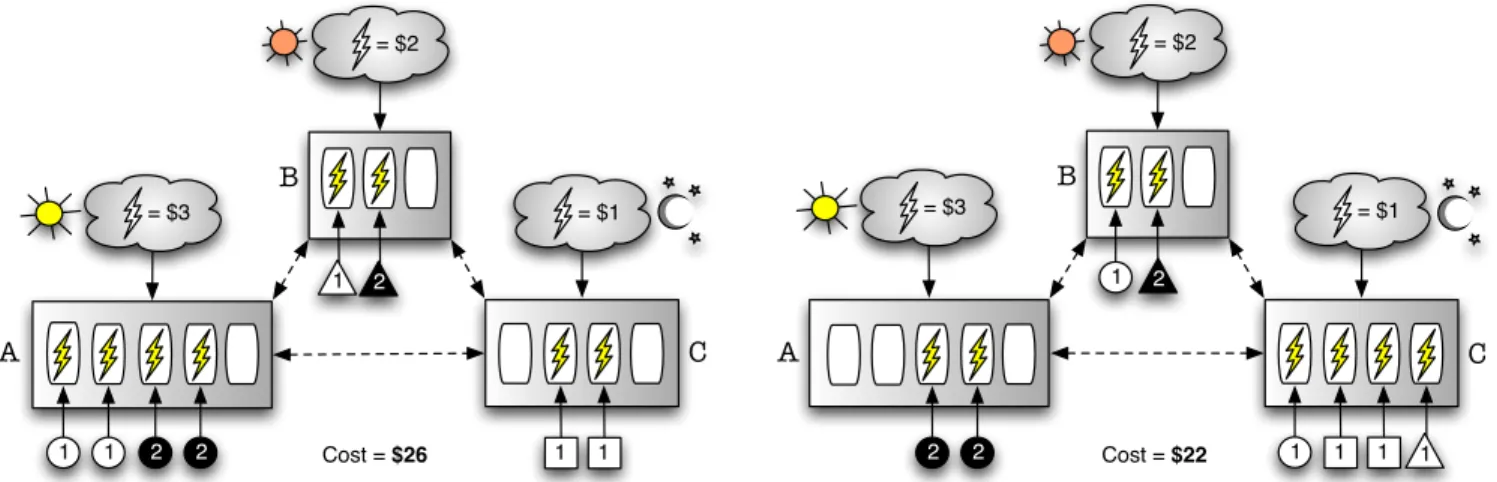
2 1 = $3 2 1 1 1 = $1 2 = $3 2 1 1 1 = $1 A = $2 B C A = $2 1 B C Cost = $26 Cost = $22 2 2 1 1
Figure 4: A sample query workload (left) is shifted between data centers to reduce the electric cost (right). during the same 24-hour period. Query traffic volumes are
observed to correlate with the local time. Typically, the vol-umes are higher during the day and lower during the night. As the time zone difference between two front-ends increases, the difference in their query volumes tends to increase.
Example. We informally describe our problem over the multi-center search engine setting depicted in Fig. 4. The example involves three data centers (A, B, and C), located in time zones that are sufficiently far apart. Data centers are connected through a wide area network. For simplicity, we assume that each data center maintains a number of ho-mogeneous search clusters having the same compute power. In our example, data centers A, B, and C possess processing powers to concurrently process 5, 3, and 4 queries, respec-tively. In the figure, small triangles, circles, and squares represent queries issued to individual data centers at a par-ticular instant in time. To further simplify the scenario, we assume that queries are either cheap or expensive, consum-ing 1 or 2 units of electricity, respectively. We also assume that expensive queries cannot be transferred between data centers due to the high overhead of network transfer, with-out exceeding a given hard limit on query response time. Finally, we assume that, at the instant of our example, each data center is charged a fixed cost for consuming one unit of electricity ($3, $2, and $1 for A, B, and C, respectively).
Given these assumptions, the initial setup on the left, where queries are processed in their local data centers, re-sults in an electric cost of $26. By finding a better query-to-center mapping, this cost can be reduced. For example, in one extreme, if all queries are processed in C, which has the cheapest electricity, the total cost becomes $11. However, this is not feasible as the processing capacity of C can handle at most four concurrent queries. In practice, excess work-load may cause intolerable delays in response time. Hence, in our work, we use data center capacities as a constraint. Moreover, we constrain response times of queries. A query is forwarded to a non-local data center only if its processing can be completed under a given time bound. In our exam-ple (on the right), two queries (one from A and one from B) are forwarded to C, and A further forwards one of its queries to B. However, although B has the capacity to process one more query, A cannot forward one of its expensive queries to B. The query-to-center mapping on the right yields the lowest possible cost ($22), without violating the constraints.
3.
PROBLEM FORMULATION
The objective of the energy-price-driven query processing problem is to find a query-to-center mapping that minimizes the total electric cost incurred by a stream of web search queries. Our constraints are to keep query response times under a given time bound and to keep workloads of data centers under their capacities. Before formally specifying our problem, we introduce some notation and definitions.
Definitions. We are given a set D = {D1, . . . , Dm} of m data centers, a set Q = {q1, . . . , qn} of n queries, and a con-tinuous timeline T . Each data center Dk∈ D is associated with a fixed query processing capacity Ck, which denotes the highest constant query traffic rate under which Dk can continue to process its queries before its waiting query queue starts infinitely growing, i.e., the capacity refers to the peak query processing throughput that can be sustained by the data center. Each query qi∈ Q is associated with a local data center bDi∈ D, a time point ti∈ T at which qi is issued by the user, its processing time ci, and the amount of energy eiconsumed while processing the query in a data center.4
We are given a response time limit r that sets an upper bound on the response time of a query, i.e., r is the maxi-mum response time that can be tolerated by users. We are also given a function `uD: Q×D → R, where `uD(qi, Dk) de-notes the network latency between data center Dkand the user who issued query qi, and a function `DD : D ×D → R, where `DD(Dk, Dk0) denotes the network latency between
data centers Dk and Dk0.5 Moreover, we define an energy
price function π : D × T → R, where π(Dk, t) denotes the financial cost of consuming a unit of energy in data center Dk at time point t. We also define a mapping Φ : Q → D that assigns each query qito a unique data center Dk∈ D.
We now give three definitions that are used in our problem specification. First, we define the financial cost ψ(qi, Dk) of a query qi processed in a data center Dk (at time t) as
ψ(qi, Dk) = eiπ(Dk, t). (1)
Second, the response time %(qi, Dk) for a query qi that is eventually processed on data center Dk is estimated as
%(qi, Dk) = 2 × (`uD(qi, bDi) + `DD( bDi, Dk)) + ci. (2) 4
We assume that processing a query over the full web index consumes the same amount of energy in all data centers. 5
Finally, the workload ω(Dk, t, Φ) of a data center Dk (at time t) for a given query-to-center mapping Φ is defined as ω(Dk, t, Φ) = |{qi: Φ(qi) = Dk, t ∈ [sik, sik+ci]}|, (3) where sikdenotes the time point that qi is received by the data center Dk, i.e., sik= ti+`uD(qi, ˆDi)+`DD( bDi, Dk).
Problem definition. The energy-price-driven query
processing problem is to find a query-to-center mapping Φ that minimizes the total energy cost χ(Φ) incurred when processing a stream Q of queries under the mapping im-posed by Φ, without violating performance constraints, i.e., to minimize
χ(Φ) = X
qi∈Q
ψ(qi, Φ(qi)) (4)
while maintaining the response time of each query qi below the given upper-bound r on query response time, i.e.,
%(qi, Φ(qi)) ≤ r, (5)
and enforcing that the workload of no data center Dk ex-ceeds its capacity Ck at no time point t ∈ T , i.e.,
ω(Dk, t, Φ) ≤ Ck. (6)
Issues. There are three issues that complicate finding a solution to our problem. First, the estimated query response time % of some queries may exceed the response time limit r, i.e., it may not be possible to find a feasible solution to the problem for any given input query stream. In practice, search engines have the freedom to fully process their queries or terminate their processing early so that the response time does not exceed r. While the first approach may lead to response times not tolerable by users, the second approach may yield degraded (low quality) search results [6]. Herein, we adopt the second approach and limit the query response time to r for all queries. This way, we can always satisfy the constraint in (5) at the expense of some degraded queries.
Second, search engines do not have a control on the in-coming query traffic rate, i.e., the workload of a data center is an external, uncontrollable parameter. This may prevent finding a feasible solution to our problem, as the constraint in (6) may be violated. In practice, when the user query traf-fic rate exceeds the peak sustainable throughput rate of the search engine, a fraction of user queries (herein, referred to as overflow queries) are dropped without any processing or processed in degraded mode, spending little time.6 Herein, we adopt a practical scenario and assume that the overflow queries are not processed by the search engine. This way, the constraint in (6) is always satisfied at the expense of some queries that are dropped without being processed.
Third, the query stream is not available from the start. Hence, an online algorithm is required to solve the problem at hand. This implies that the decisions made by the algo-rithm at some point may later turn out to be suboptimal.
Metrics. We have three different performance metrics. The first metric is the objective function given in (4), i.e., the total energy cost incurred by the query mapping Φ. This is our primary metric for evaluating the quality of a solution. The second metric is the rate Rdof queries that are degraded to prevent the violation of the constraint in (5), i.e.,
Rd(Φ) =
|{qi∈ Q : %(qi, Φ) > r}|
|Q| . (7)
6Note that forwarding of queries may lead to constraint vio-lations as well. We will take this into account in our solution.
Algorithm 1 MapQueryToDataCenter(qi, t)
Require: A user query qi
Require: Time t at which the mapping decision is made 1: W ← EstimateWorkloads(t)
2: P ← GenerateProbabilities(W, qi, t) 3: Select Dk∈ D with probability pk∈ P 4: Φ(qi) ← Dk
5: if %(qi, Φ(qi)) > r then 6: Φ(qi) ← bDi
7: end if
The third metric is the rate Ro of overflow queries that are dropped to prevent the violation of the constraint in (6), i.e.,
Ro(Φ) =
|{qi∈ Q : |w0(sik, Dk, Φ)| ≥ Ck}|
|Q| , (8)
where w0(t, Dk, Φ) represents the set of queries being pro-cessed on data center Dk at time instant t, i.e., the set {qi∈ Q : Φ(qi) = Dk, t ∈ (sik, sik+ ci], w0(sik, Dk, Φ) < Ck}, where overflow queries are not included in the workload.
4.
WORKLOAD SHIFTING ALGORITHM
Overview. In this section, we present an online algo-rithm to solve our problem, taking into account the issues mentioned in Section 3. For every given query qi, the algo-rithm decides on the data center Φ(qi) at which qishould be processed. Steps of the algorithm are as follows. First, the query workload of each data center is estimated by the local data center, at time t. Second, estimated data center work-loads are used to compute a set P of probabilities, where pk denotes the probability with which qi should be processed on Dk. Finally, the data center Φ(qi), which will process qi, is selected based on the discrete probability distribution im-plied by P. If the estimated query response time exceeds the response time limit, the query is mapped to the local data center. Algorithm 1 provides an overview of these steps.
Estimating workloads. We assume that data centers exchange messages at regular time intervals to let others know about their current workloads. We approximate the workload of a non-local data center at a certain time by using past workload values, sampled over a period of time, from its recent workload history. In Algorithm 1, W denotes the set of data center workloads estimated at time t. We as-sume that workloads and electric prices do not significantly vary while queries are being forwarded. Hence, the workload estimated for a data center is a close approximation for the workload the data center actually has while it processes qi. Generating probabilities. The basic idea is to forward queries to data centers that consume cheaper electricity with higher probability, also taking the capacities and current workloads of data centers into account. We note that, in practice, it is difficult to accurately determine the actual data center workloads when deciding whether to forward a given query or not. Hence, we resort to a probabilistic ap-proach that spreads queries across data centers to prevent workload concentration in a single data center. Given a query qiand the set W of estimated data center workloads, a local data center computes (at time t) the forwarding prob-abilities among all data centers as follows (see Algorithm 2). Initially, for every data center Dk, the current workload Lk of Dk is set to its estimated workload Wk. The algorithm
Algorithm 2 GenerateProbabilities(W, qi, t) Require: Set W of estimated data center workloads Require: A user query qi
Require: Time t at which the mapping decision is made 1: for each Dk∈ D do
2: Lk← Wk
3: pk← 0
4: end for
5: for each Dk∈ D in increasing order of π(Dk, t) do 6: if Dk= bDi then 7: pk← bLi/ cWi 8: return P = {pk: Dk∈ D} 9: end if 10: if Lk< Ckthen 11: D0← {D `: π(D`, t) > π(Dk, t)} 12: while D06= ∅ do 13: ` ← arg minp{Lp: Dp∈ D0} 14: s ← min {L`, (Ck− Lk)/|D0|} 15: Lk← Lk+ s 16: L`← L`− s 17: D0← D0− {D`} 18: if D`= bDithen 19: pk← s/cWi 20: end if 21: end while 22: end if 23: end for
then iterates on all data centers where the unit energy con-sumption cost is lower than that of the local data center bDi (in increasing order of prices). At each iteration, the algo-rithm picks a data center Dkand simulates forwarding deci-sions from remaining data centers to Dk. First, the current workload Lkof Dkis compared with its capacity Ckto make sure that there is available capacity for additional queries. If there is unused capacity, a set D0 of data centers whose unit energy consumption costs are higher than that of Dkis constructed. Then, until D0becomes empty, the data center D` ∈ D0 with the lowest workload is picked and removed from D0. At each iteration on D0, the available capacity of Dkis evenly shared among the data centers remaining in D0. Hence, the forwarding rate s, from D` to Dk, is computed as the minimum of the current workload L` of D` and an even share of the available capacity at Dk. Subsequently, current workloads of Dkand D`are updated. If the picked data center is the local data center bDi, the probability pkof forwarding to Dk is set to the ratio of the forwarding rate s to the estimated workload cWi. The probability that qi is locally processed is computed as the ratio of the remaining workload bLi of bDito the estimated workload cWi.
The probability generation algorithm satisfies two invari-ants. First, the sum of the probabilities in P equals to one (line 8), i.e., there is at least one data center with non-zero probability. Second, if data centers conservatively estimate the workloads of others, then no data center becomes over-loaded due to forwarded queries. When simulating work-loads (lines 10–22), every data center conservatively assumes that the unused capacity of a candidate center will be evenly shared among centers with higher energy prices (line 14) and only forwards as many queries as its share allows.
30 60 90 120 150 180 210 240 270 300 Price ($/MWh)
DC-A, DC-B, DC-C, DC-D, DC-E DC-A DC-B DC-C DC-D DC-E
0 3 6 9 12 15 18 21
Hour of the day (GMT+0)
30 60 90 120 150 180 210 240 270 300 Price ($/MWh) DC-A DC-B DC-C DC-D DC-E 0 3 6 9 12 15 18 21
Hour of the day (GMT+0)
DC-A DC-B DC-C DC-D DC-E
Universal (PC-U) Temporal (PC-T)
Spatial (PC-S) Spatio-temporal (PC-ST)
Figure 5: Electric price configurations used in the experiments: universal (PC-U), spatial (PC-S), tempo-ral (PC-T), and spatio-tempotempo-ral (PC-ST).
5.
EXPERIMENTAL SETUP
Search data centers. We simulate a web search engine with five data centers, denoted as DC-A, DC-B, DC-C, DC-D, and DC-E. Data centers are assumed to be located in capi-tal cities of five geographically distant countries, which are not disclosed due to the risk of revealing financially sensitive information about query traffic volumes. Network latencies between data centers as well as those between users and data centers are estimated by applying the technique de-scribed in [8]. We assume that the building blocks of data centers are identical, homogeneous search clusters. In our simulations, we determine the number of nodes in a search cluster such that each node serves about three million web documents. The number of search clusters in a data center is determined based on the query traffic volume received by the data center, i.e., each data center is associated with a separate peak sustainable query throughput value.
Result caching. We assume the presence of a query re-sult cache with infinite capacity [6] in every data center. The result cache of a data center maintains results of queries is-sued by users as well as results of queries forwarded by other data centers. A time-to-live mechanism is not implemented as the performance is evaluated on a single day of queries. We assume that the time cost and energy consumption of looking up queries in the result cache are both negligible.
Electric price configurations. We generate four differ-ent price configurations (Fig. 5) based on the daily electric price distribution given in Fig. 2 and the mean of that dis-tribution (about $120): universal (PC-U), temporal (PC-T), spatial (PC-S), and spatio-temporal (PC-ST). PC-U assumes that the price of electricity is fixed during the day and across all data center locations. In this configuration, all queries are locally processed since no cost saving can be achieved by workload shifting. PC-T assumes that prices vary during the day but not across data centers. Price distributions of data
centers are identical to those in PC-U (but, they are shifted in time). PC-S assumes that prices do not vary during the day. However, there is spatial variability based on loca-tion. We obtain the spatial price variability by shifting the mean of the original price distribution by the real-life elec-tric prices in the countries where data centers are located (using the data in Fig. 1). PC-ST is the most diverse, yet re-alistic configuration, where price distributions are computed by assuming both spatial and temporal price variations.
Data. We sample about 38 million queries from five dif-ferent front-ends of the Yahoo! web search engine during four consecutive days (query sets S1, S2, S3, and S4). Queries in S4 are used to evaluate our workload shifting algorithm. Those in S2 and S3 are used for parameter tuning purposes (see Section 6). Each set Siis used to warm up the result cache before an experiment using the query set of day i + 1. As the document collection, we obtain 200 million pages sam-pled from the Web. To prevent a mismatch between queries and the collection, we use only the documents whose pre-dicted region matches one of the five data center locations. A proprietary region classifier is used to filter the pages.
Parameters. Each query is associated with a fixed pre-processing cost (e.g., query rewriting, spell checking), set to 20 ms. Queries are assumed to be processed over the full web index. Our algorithm is independent of the underlying ranking technique and has no impact on the search quality. The processing cost of a query is assumed to be correlated with the sum of its terms’ inverted list sizes (i.e., the total number of postings) [11]. The total time needed to pro-cess a query is estimated by multiplying this cost with a per posting processing cost of 200 ns, which is an empirical value obtained from the Terrier search engine [14]. We try to keep the overflow query rate under a satisfactory value, set to 0.005 in our work (this requires the tuning described in the next section). As the query response time limit, we try several different values (r ∈ {100, 200, 400, 800, ∞}, in ms).
Baseline. Our baseline is the scenario in which all queries are processed in their local data centers, i.e., no query work-load is shifted between data centers. We assume that a query is forwarded to non-local data center only if some reduction in the electric cost is forecasted. Ideally, some workload could have been shifted to reduce the overflow query rate even though there is no cost saving. We refrain from this kind of shifting as the primary objective of our work is to reduce the electric cost, not the overflow query rate.
6.
EXPERIMENTAL RESULTS
Tuning data center capacities. In practice, data cen-ters are given fixed compute resources, based on the query traffic volumes they receive. If the compute capacity of a data center is not carefully tuned, it may be underutilized or the overflow query rate may be too high. Hence, herein, we first perform such a tuning and assign each data center compute resources proportional with the peak query traffic volume it typically receives. When tuning, we assume that queries are not forwarded. In particular, we assign to a data center the least amount of compute resources sufficient to keep the overflow query traffic volume below a threshold.
In our setup, as shown in Fig. 6 (obtained with S2), as data centers are given more resources, i.e., their peak sus-tainable throughput (PST) is increased, the overflow query rate almost linearly decreases. In our simulations, we set the PST values of a data center to the lowest value at which the
overflow query rate remains below a threshold of 0.005. At this rate, the PST values we obtain are 31, 39, 34, 47, and 35 queries/sec, for the five data centers (listed in alphabeti-cal order). In the presence of a result cache, the PST values we obtain are 13, 14, 14, 16, and 12 queries/sec. Note that lower PST values are sufficient in the latter case because a large fraction of queries are served by the cache. We use these two sets of PST values in the rest of our experiments. Estimating data center workloads. A critical issue is to accurately estimate workloads of non-local data centers. We assume that each data center sends messages (every sec-ond) to other data centers to inform them about its current workload. The workload of a data center at a certain time is estimated by using its most recent workload history over a period of time, referred to as the window. In particular, we approximate the workload of a data center by the maximum observed workload value in its window. Note that taking the average is less conservative than using the maximum of sam-ple workload values as it results in relatively lower workload estimates and thus higher overflow query rates. Hence, our choice of using the maximum sample value is reasonable.
In practice, the window size should be selected such that the workload estimates are as accurate as possible. Small windows may not have enough sample data while large win-dows may not capture the recent query traffic behavior, re-sulting in over-estimated workloads and hence low forward-ing rates. In our work, we set the window size to the min-imum possible value at which the total overflow query rate observed on the training query set (S3) remains under the threshold we set before (i.e., 0.005). As shown in Fig. 7, when the window size is less than 10 seconds, overflow query rates are high as too many queries are forwarded to highly loaded data centers due to inaccurate workload estimates. In remaining experiments, for all data centers, we set the window size to 10 seconds for PC-T and to 16 seconds for PC-S and PC-ST. When caching is considered, we use 6, 7, and 7 seconds for PC-T, PC-S, and PC-ST, respectively.
Dissection of queries. We classify queries under de-graded, overflow, non-local, and local classes. Degraded queries are those whose processing is early terminated due to the query response time limit. Overflow queries are those that are dropped as the data center does not have enough capacity. Non-local and local queries are processed in non-degraded mode at non-local or local data centers, respec-tively. This and remaining experiments use the test set S4.
As seen in Fig. 8, the response time limit has a strong impact on the degraded query rate. Reasonable degraded query rates are obtained when the response time limit is larger than 400 ms. We note that the degraded query rate is independent of forwarding and is the same for all price configurations. The overflow query rate, on the other hand, is affected by these factors. However, due to the careful resource tuning mentioned before, this rate is kept under a satisfactory value in all possible scenarios (typically, 0.005, which is the permitted overflow query rate). Since the query response time limit is relaxed, there is more opportunity to forward queries between data centers. As mentioned before, no queries can be forwarded in the PC-U setup.
Impact of result caching. On aggregate, about 63% of the query traffic volume is served by the result cache. Fig. 9 shows the dissection of queries for the “miss” query traf-fic volume hitting the backend search systems. In general, caching reduces the degraded query rate. However, since
0 5 10 15 20 25 30 35 40 45 50 55 60
Peak sustainable query throughput (query/sec)
0.0 0.1 0.2 0.3 0.4 0.5 0.6 0.7 0.8 0.9 1.0
Overflow query rate (w/o result cache)
0 2 4 6 8 10 12 14 16 18 20
Peak sustainable query throughput (query/sec)
0.00 0.05 0.10 0.15 0.20 0.25 0.30 0.35 0.40
Overflow query rate (w/ result cache)
DC-A DC-B DC-C DC-D DC-E Thres. (0.005)
Figure 6: Overflow query rate
versus peak sustainable query
throughput of data centers.
2 4 6 8 10 12 14 16 18 20
Window size (seconds)
0.00 0.01 0.02 0.03 0.04 0.05 0.06 0.07 0.08
Overflow query rate (w/o result cache)
2 4 6 8 10 12 14 16 18 20
Window size (seconds)
0.000 0.005 0.010 0.015 0.020 0.025 0.030 0.035 0.040
Overflow query rate (w/ result cache)
PC-T PC-S PC-ST Thres. (0.005)
Figure 7: Overflow query rate as the window size varies.
100 200 400 800
Query response time limit (ms)
0.00 0.05 0.10 0.15 0.20 0.25 0.30 0.35 0.40 0.45 0.50 0.55
Fraction of query traffic volume
PC-U PC-T PC-S PC-ST Overflow Forwarded Degraded
Figure 8: Degraded, forwarded,
and overflow query rates (without result caching).
100 200 400 800
Query response time limit (ms)
0.00 0.05 0.10 0.15 0.20 0.25 0.30 0.35 0.40 0.45 0.50 0.55
Fraction of query traffic volume
PC-U PC-T PC-S PC-ST Overflow Forwarded Degraded
Figure 9: Degraded, forwarded,
and overflow query rates (with re-sult caching).
0 3 6 9 12 15 18 21
Hour of the day (GMT+0)
0.00 0.01 0.02 0.03 0.04 0.05 0.06
Fraction of query traffic volume
User queries Forwarded (PC-T) Forwarded (PC-S) Forwarded (PC-ST)
Figure 10: The rate of forwarded queries as the user query traffic volume varies (r = 800).
>100 >200 >400 >800
Query response time (ms)
0.00 0.02 0.04 0.06 0.08 0.10 0.12 0.14 0.16 0.18 0.20 0.22 0.24
Fraction of query traffic volume
PC-U PC-T PC-S PC-ST
Figure 11: The rate of queries
that are responded beyond a cer-tain time delay (r = ∞).
data center capacities are separately tuned for the caching scenario, it has no impact on the overflow query rate, which remains around 0.005. In the rest of our experiments, we consider only the case in which a result cache is present.
Query forwarding rates. Fig. 10 shows the aggregate hourly query forwarding rate of data centers for different price setups and the variation of the hourly user query traf-fic volume (w.r.t. GMT+0). The reported forwarding rates are relative to the total user query traffic volume and include overflow queries, which may also be forwarded to non-local data centers. Intuitively, having more user queries implies a higher query forwarding rate. Interestingly, however, we observe that forwarding rates may drop as the user query traffic volume increases. This is because data centers have increased workloads and hence the solution space of our workload shifting algorithm is restricted. In general, the forwarding rate is more stable for the PC-T setup as price variation is lower relative to PC-S and PC-ST. We also ob-serve that PC-ST highly correlates with PC-S, as forwarding decisions depend on the ordinal ranking of data centers ac-cording to their unit energy consumption costs, instead of the actual costs, and as electric price differences across coun-tries are more dominant than intra-day price volatility.
Query response times. Fig. 11 shows the fraction of queries that cannot be answered under a specific amount of time, assuming there is no bound on the response time limit. According to the figure, almost all queries can be processed under 800 ms. In general, the PC-T, PC-S, and PC-ST scenarios result in higher query response times (on average, 109 ms, 103 ms, and 105 ms, respectively), relative to the average response time of the PC-U scenario (66 ms), where all queries are processed in their local data centers. Nevertheless, around only 5% of the query volume cannot be processed under 400 ms, which is a satisfactory result for the web search engine standards. This implies that, despite the large network latencies between data centers, forwarding of queries and hence reduction in electric costs is possible.
Saving in the electric cost. Fig. 12 shows our most striking result. Depending on the price setup, significant savings are achieved in electric costs relative to the respec-tive baselines in which no workload is shifted. The largest saving (about 35% when r = ∞) is possible with the PC-ST scenario, which has the largest variation in electric prices.
Temporal effects. In general, the saving in the electric cost due to workload shifting is affected by the forwarding rate, which depends on the query traffic volume and electric
200 400 800 inf.
Query response time limit (ms)
0.00 0.04 0.08 0.12 0.16 0.20 0.24 0.28 0.32 0.36 0.40
Saving in electric cost
PC-T PC-S PC-ST
Figure 12: Saving in electric costs for different price configurations.
0 3 6 9 12 15 18 21
Hour of the day
0.00 0.01 0.02 0.03 0.04 0.05 0.06 Fraction Saving Forwarded queries Electric price
Figure 13: Temporal distribution
of the cost saving (PC-T, r = 800).
44 64 76 81 94 99 139 148 168 176
Network latency between data center pairs (ms)
0.00 0.01 0.02 0.03 0.04 0.05 0.06 0.07 0.08 Fraction Saving (r=400) Saving (r=800) 0.00 0.01 0.02 0.03 0.04 0.05 0.06 0.07 0.08 Forwarded queries (r=400) Forwarded queries (r=800)
Figure 14: Spatial distribution of the cost saving (PC-S).
prices. Fig. 13 shows the distribution of the saving for the PC-T price setup, as the query forwarding rates and electric prices vary (for r = 800 and w.r.t the local time of the data center where the query is processed). As seen in the figure, there is a high correlation between the query forwarding rate and the saving. This implies a negative correlation between the electric price and cost saving, i.e., fewer queries are for-warded when electric prices are high. It is interesting to note that, at 17:00 PM, the query forwarding rate falls to zero. At this hour of the day, the price of electricity consumed by data centers reaches the global maximum and no queries can be forwarded to a data center operating at this hour.
Spatial effects. Fig. 14 shows the distribution of the sav-ing for the PC-S setup, as the query forwardsav-ing rate varies (the x axis shows the network latencies between data center pairs, for all possible pairs). Although not very strong, we observe some positive correlation between query forwarding rates and network latencies between data centers. This is somewhat surprising as one may expect more queries to be forwarded when the latency between two data centers is low. In practice, however, data centers with low latencies tend to be located in nearby time zones. This implies that their hourly query traffic volumes follow a similar pattern, render-ing forwardrender-ing of queries more difficult. The price of elec-tricity consumed by data centers forms another factor. As an example, consider data centers DC-D and DC-A, which con-sume the most expensive electricity (see Fig. 5). Although they are geographically very close (the network latency is 81 ms, in Fig. 14), these two data centers almost never forward queries to each other, as they prefer forwarding their queries to other data centers. We note that, in the PC-S setup, the entire forwarded query traffic volume between two data cen-ters is generated by the data center that consumes cheaper energy, whereas forwarding of queries can be bidirectional in the PC-T and PC-ST setups. In general, most of the sav-ing is obtained from data centers located in far-away time zones with a large difference in electric prices. Finally, we note that, although the network latency is not dominantly decisive in query forwarding rates, it becomes more decisive as the response time limit is reduced. In Fig. 14, we observe that, when r = 800, a significant fraction of the cost saving is achieved due to forwarding of queries between far apart data centers. When r = 400, however, some distant pairs of data centers are unable to exchange their workloads.
7.
DISCUSSION
Impact of server utilization. The energy consump-tion of modern servers depends on their utilizaconsump-tion level [4]. Shifting query workloads between data centers may have an impact on the utilization of compute servers in data centers and, in turn, affect their energy consumption. In our setup, the utilization distribution we observe when no queries are forwarded (see Fig. 15) is comparable to that reported for Google servers [5, p. 55]. However, when the workload is shifted, we obtain a quite different distribution (shown in the figure for the PC-ST scenario). We observe that data centers now have significantly more idle cycles and, in the mean time, their utilization is shifted towards higher levels. We analyze the impact of this shift in utilization levels on the cost saving, analytically, via representative functions that map a utilization level u to a value c, indicating the energy consumption at level u relative to the consumption at peak utilization. Following [5], we evaluate functions of the form c(u, p) = (1 + up)/2, where p is a free parameter (p ∈ {0.25, 0.5, 1, 2, 4}). Here, increasing values of p increase the energy-efficiency of compute resources running at low utilization levels. For convenience, the evaluated functions are plotted in Fig. 16.7 The linear function c(u, 1) is typical for today’s servers while the rest are hypothetical.
In Fig. 17, we report the respective cost savings for the above-mentioned functions. For r = 800, we observe that workload shifting highly benefits from increasing energy ef-ficiency of servers. We note that the increase in idle cycles lets workload shifting benefit from power saving techniques (e.g., shutting down servers or putting them in sleep mode). Unified cost model. Shifting workloads is not only use-ful for reducing the energy cost, but also for increasing data centers’ availability, performance, and service quality. Ide-ally, all these factors should be combined under a unified cost model. In the particular case of search engines, finan-cial implications of search result quality and search efficiency should be quantified and incorporated into this cost model. Electric prices. We assumed that the amount of work-load shifted is not significant enough to alter electric prices. However, given that important financial savings are possible, 7
Ideally, servers would consume no energy in the absence of load. Modern servers, however, draw an idle power that is about 50% of the peak consumption [4].
0 1-9 10-19 20-29 30-39 40-49 50-59 60-69 70-79 80-89 90-99 100 Server utilization (%) 0.00 0.03 0.06 0.09 0.12 0.15 0.18 0.21 0.24 0.27 Fraction of time
w/o query forwarding w/ query forwarding
Figure 15: Fraction of time data centers run at a certain utilization level (PC-ST, r = 800). 0 0.1 0.2 0.3 0.4 0.5 0.6 0.7 0.8 0.9 1 Utilization 0.0 0.1 0.2 0.3 0.4 0.5 0.6 0.7 0.8 0.9 1.0
Fraction of peak energy consumption
p=0.25 p=0.5 p=1 p=2 p=4
Figure 16: Mappings from utiliza-tion level (u) to energy consump-tion (c) (we use c(u, p) = (1+up)/2).
200 400 800 inf.
Query response time limit (ms)
0.00 0.02 0.04 0.06 0.08 0.10 0.12 0.14 0.16
Saving in electric cost
p=0.25 p=0.5 p=1 p=2 p=4
Figure 17: Saving in the electric
cost for functions with varying p values (PC-ST).
many large-scale Internet services can be expected to start using similar workload shifting techniques. This may lead to an increase in prices at energy-cheap locations and vice versa, eventually converging prices to an equilibrium, which may render the technique less profitable. We also assumed a fixed electric cost model and a passive market participation strategy. A different approach is direct renegotiation of the electric price, rather than reacting to price-spotting. The reaction time to price changes has an influence on the final savings [15]. A few works [15, 17, 18] try to spot the electric price at a certain time in different electricity markets.
Environmental impact. The electric price model used by our work is rather general, allowing for different cost functions. As pointed out in [15] and [12], we may aim at reducing the environmental impact of data centers. In practice, this implies modeling the impact as a cost function (e.g., the carbon footprint of the energy the data center con-sumes) so that the system could decide to shift its workload to places that use renewable energy. The cost function may be time-dependent, i.e., seasonal, weekly, or even hourly.
Energy consumption. Data centers need adequate en-ergy elasticity to achieve high cost savings when shifting their workload to data centers with cheaper energy. Some ongoing proposals to build more energy-elastic compute clus-ters include energy-proportional servers [4] and dynamic server provisioning techniques [13]. Another factor that might influence energy consumption is weather differentials. Cooling systems account for a significant fraction of the to-tal energy consumption of data centers [5]. The energy con-sumption of chillers can be drastically reduced when the ambient temperature is low. This implies that the workload can be shifted to cooler regions that might reduce not only the energy price but also the consumption, as it is easier to cool down the heat dissipated from data centers.
8.
RELATED WORK
Multi-center web search. A few works investigate the performance of multi-center web search engines [1, 7, 8]. Cambazoglu et al. [7] try to quantify performance benefits of such search engines. Baeza-Yates et al. [1] describe a multi-site search engine architecture, where the index is par-titioned among data centers, also allowing partial replication of documents. Their work provides an algorithm for
for-warding queries between data centers to maintain the qual-ity of search results, relative to that of a centralized system. Cambazoglu et al. [8] propose an improved query forward-ing algorithm, usforward-ing linear programmforward-ing. Both works have indirect consequences on reducing the energy cost, as they reduce the number of data centers involved in query pro-cessing. However, they do not directly tackle the financial aspect of the problem as they do not consider energy prices. Workload shifting. Wang et al. [20] explore strategies to balance the load and locality in distributed systems, find-ing that, although algorithms that shift the workload across data centers are imperfect, using a content distribution net-work may provide capacity increases ranging from 60% to 90%. Along the same line, Ranjan et al. [16] show that redi-recting requests to geographically distant but lightly loaded centers can reduce the response time to about a half.
Minimizing the energy cost. Wang et al. [21] try to optimize the workload, power, and cooling management of a single data center. Shah and Krishnan [19] perform an in-depth analysis of environmental and economic costs of a large-scale technology warehouse and the potential energy saving achievable when the workload is distributed across data centers. They optimize thermal workloads based on local weather, showing that the environmental burden can be reduced by up to 30%. Due to space limitations, for more related work on the topic, we refer the reader to [5]. Herein, we discuss two works that are more related to ours [12, 15]. Qureshi et al. [15] characterize the variation in electric prices and argue that data centers could exploit this for economic gains. They quantify possible gains via simula-tions using workloads obtained from a content provider. Our work differs from [15] in three ways. First, we provide a for-mal optimization framework specific to web search engines (more suitable to throughput-intensive tasks), whereas [15] provides an informal study for general-purpose Internet ser-vices (more suitable to compute-intensive tasks). Second, the algorithm in [15] is deterministic and greedy, i.e., it does not consider the issues that motivate our probabilistic ap-proach. Third, their problem employs a bandwidth con-straint, whereas ours have a query response time constraint. Le et al. [12] propose an optimization framework for green-aware Internet services. They try to cap the brown-energy consumption via a linear-programming-based
algo-rithm, trying to incur the least increase in costs while satisfy-ing some service-level agreements. Our work differs from [12] in three ways. First, our optimization problem is to directly reduce the electric bill, rather than reducing financial losses since some energy caps are respected. Second, we consider the problem in a search engine setting, taking into account degraded and overflow query rates, and propose a proba-bilistic solution. Third, we use a detailed setup with realistic price data, real-life query workloads, real search front-ends, result caching, a large web index, and network latencies.
9.
CONCLUSION
We have provided an optimization framework and a prac-tical algorithm, based on shifting query workloads between search data centers, in order to reduce the electric bills of multi-center web search engines. We evaluated potential savings via realistic simulations. The results demonstrate that, depending on electric price distribution, electric costs of search engines can be significantly reduced by shifting their query workloads to energy-cheap data centers.
We note that, when computing the savings in electric cost, we were quite conservative in some of our assumptions. We assumed very tight capacities for data centers [10], estimated based on past query traffic volumes. In practice, data cen-ters allow for a certain amount of slackness in their capacities (typically, about 20%), which may allow more queries to be forwarded. Moreover, we assumed that user queries are for-warded between data centers. In practice, however, search engines make use of geographically scattered request sched-ulers [9], which may directly identify the best data centers to contact. This may result in lower query response laten-cies, which implies more forwarded queries. These practical aspects should be considered as a part of future work.
Finally, we emphasize that our work has implications for many other tasks in multi-center web search engines. Pri-marily, electric cost optimization frameworks similar to ours should be developed for multi-site web crawling and dis-tributed indexing tasks. In particular, it may be interesting to devise an energy-price-aware result caching framework, where invalidation predictions are made for stale cache en-tries based on a combination of parameters (e.g., energy cost, backend workload, age and degradedness of search results) so that the financial cost of cache misses is reduced.
10.
ACKNOWLEDGMENTS
This publication is based on work performed in the frame-work of the Project COAST-ICT-248036, funded by the Eu-ropean Community. The last author of the paper is par-tially supported by The Scientific and Technological Re-search Council of Turkey under grant EEEAG-109E019.
11.
REFERENCES
[1] R. Baeza-Yates, A. Gionis, F. Junqueira, V. Plachouras, and L. Telloli. On the feasibility of multi-site web search engines. In Proc. 18th ACM Conf. Information and Knowledge Management, pages 425–434, 2009.
[2] L. A. Barroso. The price of performance. Queue, 3:48–53, 2005.
[3] L. A. Barroso, J. Dean, and U. H¨olzle. Web search for a
planet: the Google cluster architecture. IEEE Micro, 23(2):22–28, 2003.
[4] L. A. Barroso and U. H¨olzle. The case for
energy-proportional computing. Computer, 40(12):33–37, 2007.
[5] L. A. Barroso and U. H¨olzle. The Datacenter as a
Computer: An Introduction to the Design of Warehouse-Scale Machines. Morgan and Claypool Publishers, 1st edition, 2009.
[6] B. B. Cambazoglu, F. P. Junqueira, V. Plachouras, S. Banachowski, B. Cui, S. Lim, and B. Bridge. A refreshing perspective of search engine caching. In Proc. 19th Int’l Conf. World Wide Web, pages 181–190, 2010. [7] B. B. Cambazoglu, V. Plachouras, and R. Baeza-Yates.
Quantifying performance and quality gains in distributed web search engines. In Proc. 32nd Annual Int’l ACM SIGIR Conf. Research and Development in Information Retrieval, pages 411–418, 2009.
[8] B. B. Cambazoglu, E. Varol, E. Kayaaslan, C. Aykanat, and R. Baeza-Yates. Query forwarding in geographically distributed search engines. In Proc. 33rd Annual Int’l ACM SIGIR Conf. Research and Development in Information Retrieval, pages 90–97, 2010.
[9] V. Cardellini, M. Colajanni, and P. S. Yu. Dynamic load balancing on web-server systems. IEEE Internet Comput., 3(3):28–39, 1999.
[10] A. Chowdhury and G. Pass. Operational requirements for scalable search systems. In Proc. 12th Int’l Conf. Information and Knowledge Management, pages 435–442, 2003.
[11] Q. Gan and T. Suel. Improved techniques for result caching in web search engines. In Proc. 18th Int’l Conf. World Wide Web, pages 431–440, 2009.
[12] K. Le, R. Bianchini, T. D. Nguyen, O. Bildir, and M. Martonosi. Capping the brown energy consumption of Internet services at low cost. In Proc. 1st Int’l Green Computing Conf., pages 3–14, 2010.
[13] D. Meisner, B. T. Gold, and T. F. Wenisch. PowerNap: eliminating server idle power. In Proc. 14th Int’l Conf. Architectural Support for Programming Languages and Operating Systems, pages 205–216, 2009.
[14] I. Ounis, G. Amati, V. Plachouras, B. He, C. Macdonald, and D. Johnson. Terrier information retrieval platform. In Advances in Information Retrieval, volume 3408 of Lect. Notes Comput. Sc., pages 517–519. Springer Berlin / Heidelberg, 2005.
[15] A. Qureshi, R. Weber, H. Balakrishnan, J. Guttag, and B. Maggs. Cutting the electric bill for Internet-scale systems. In Proc. ACM SIGCOMM 2009 Conf. Data Communication, pages 123–134, 2009.
[16] S. Ranjan, R. Karrer, and E. Knightly. Wide area redirection of dynamic content by Internet data centers. In Proc. 23rd Annual Joint Conf. IEEE Computer and Communications Societies, volume 2, pages 816–826, 2004. [17] L. Rao, X. Liu, M. Ilic, and J. Liu. MEC-IDC: joint load
balancing and power control for distributed Internet data centers. In Proc. 1st ACM/IEEE Int’l Conf.
Cyber-Physical Systems, pages 188–197, 2010.
[18] L. Rao, X. Liu, L. Xie, and W. Liu. Minimizing electricity cost: optimization of distributed Internet data centers in a multi-electricity-market environment. In Proc. 29th Conf. Information Communications, pages 1145–1153, 2010. [19] A. J. Shah and N. Krishnan. Optimization of global data
center thermal management workload for minimal environmental and economic burden. IEEE Trans. Compon. Packag. Technol., 31(1):39–45, 2008. [20] L. Wang, V. Pai, and L. Peterson. The effectiveness of
request redirection on CDN robustness. SIGOPS Oper. Syst. Rev., 36:345–360, 2002.
[21] Z. Wang, N. Tolia, and C. Bash. Opportunities and challenges to unify workload, power, and cooling management in data centers. SIGOPS Oper. Syst. Rev., 44:41–46, 2010.