ANALYSIS OF GSTM1, GSTT1, GSTP1, AND TP53 POLYMORPHISMS AS GENETIC RISK FACTORS FOR BLADDER CANCER IN THE TURKISH
POPULATION
A THESIS SUBMITTED TO THE
DEPARTMENT OF MOLECULAR BIOLOGY AND GENETICS AND THE INSTITUTE OF ENGINEERING AND SCIENCE OF BILKENT
UNIVERSITY
IN PARTIAL FULFILLMENT OF THE REQUIREMENTS FOR THE DEGREE OF DOCTOR OF PHILOSOPHY
BY
GÖKÇE ALTAY TÖRÜNER SEPTEMBER 2001
I certify that I have read the thesis, and that in my opinion it is fully adequate, in scope and in quality, as a thesis for the degree of Doctor of Philosophy.
_______________________________
Prof. Dr. Ergül Tunçbilek
I certify that I have read the thesis, and that in my opinion it is fully adequate, in scope and in quality, as a thesis for the degree of Doctor of Philosophy.
_______________________________
Assoc Prof. Dr. Tayfun Ozcelik
I certify that I have read the thesis, and that in my opinion it is fully adequate, in scope and in quality, as a thesis for the degree of Doctor of Philosophy.
_______________________________
I certify that I have read the thesis, and that in my opinion it is fully adequate, in scope and in quality, as a thesis for the degree of Doctor of Philosophy.
_______________________________
Assist. Prof. Dr. Can Akçalı
I certify that I have read the thesis, and that in my opinion it is fully adequate, in scope and in quality, as a thesis for the degree of Doctor of Philosophy.
_______________________________
Assoc. Prof. Dr. Uğur Özbek
Approved for the Institute of Engineering and Science
_______________________________
ABSTRACT
ANALYSIS OF GSTM1, GSTT1, GSTP1, AND TP53 POLYMORPHISMS AS GENETIC RISK FACTORS FOR BLADDER CANCER IN THE TURKISH
POPULATION
Gökçe Altay Törüner
Ph.D in Molecular Biology and Genetics Supervisor: Assoc. Prof. Tayfun Özçelik
September 2001, 93 pages
The effect of the GSTM1 and GSTT1 null genotypes, the GSTP1 Ile105Val, and TP53 Arg72Pro polymorphism on bladder cancer susceptibility was investigated in a case control study of 121 bladder cancer patients, and 121 age-sex matched controls in the Turkish population. The adjusted odds ratio (for age, sex, and smoking status) for the GSTM1 null genotype is 1.94 (95% CI 1.15- 3.26) and for the GSTP1 105 Ile/Val or Val/Val genotypes is 1.75 (95% CI 1.03- 2.99). GSTT1, and TP53 loci was not shown to be associated with bladder cancer. Combination of the two high risk genotypes, GSTM1 null and GSTP1 105 Ile/Val or Val/Val, revealed that the risk increases by 3.91 times (95% CI 1.88-8.13) when compared with the combination of the low risk genotypes of these loci. In individuals with a combined risk of cigarette smoking and the GSTM1 null genotype, bladder cancer risk is 2.81 (95% CI 1.23-6.35) relative to persons who do not smoke and carry the GSTM1 present genotype. The same risk for the GSTP1 105 Ile/Val or Val/Val genotypes is 2.38 (95% CI 1.12-4.95). These findings support the role for the GSTM1 null and the GSTP1 105 Ile/Val or Val/Val genotypes in the development of bladder cancer. Furthermore, gene-gene (GSTM1- GSTP1) and gene-environment (GSTM1-smoking, GSTP1-smoking) interactions increase this risk substantially.
ÖZET
GSTM1, GSTT1, GSTP1, AND TP53 GEN POLİMORFİZMLERİNİN TÜRK TOPLUMUNDA MESANE KANSERİ İÇİN GENETİK RİSK FAKTÖRÜ OLARAK
İNCELENMESİ
Gökçe Altay Törüner
Moleküler Biyoloji ve Genetik Doktorası Tez Yöneticisi: Doç. Dr. Tayfun Özçelik
Eylül 2001, 93 sayfa
GSTM1 0/0 ve GSTT1 0/0 genotipleri ile, GSTP1 Ile105Val, ve TP53 Arg72Pro gen polimorfizmlerinin, Türk toplumunda mesane kanserine yatkınlıkla ilişkisi bir hasta-kontrol çalışması kapsamında incelendi. Çalışma grupları 121 mesane kanseri hastasından ve 121 yaş-cinsiyet açısından uyumlu kontrolden oluşmaktaydı. Yaş, cinsiyet ve sigara öyküsü göz önüne alınarak gerekli istatistiki düzeltmeler yapıldıktan sonra, GSTM1 0/0 genotipinin 1.94 (95% GA 1.15- 3.26) ve GSTP1 105 Ile/Val+ Val/Val genotiplerinin ise 1.75 (95% GA 1.03- 2.99). kat risk artışına neden olduğu gözlendi. Bu risk her iki lokus için, riskli genotipler birlikte incelediğinde 3.91 kat (95% CI 1.88-8.13) olarak saptandı. GSTT1 ve TP53 lokusları ile mesane kanseri arasında bir ilişki tesbit edilmedi. Sigara oyküsü ve riskli genotip bir arada bulunduğunda risk GSTM1 lokusu için 2.81 (95% CI 1.23-6.35), GSTP1 lokusu içinse 2.38 (95% CI 1.12-4.95) olarak bulundu. Bu bulgular GSTM1 0/0 ve GSTP1 105 Ile/Val+ Val/Val genotiplerinin mesane kanseri için bir risk faktörü olduğuna işaret etmektedir. Ayrıca gen-gen (GSTM1- GSTP1) ve gen-gen-çevre (GSTM1-sigara öyküsü, GSTP1-sigara öyküsü)
ACKNOWLEDGMENTS
Although writing a thesis is a very personal endeavor, research is a team work effort. I would like to thank the following persons and institutions for their particular help and contributions in this work.
Provision of samples
Prof. Dr. Haluk Özen Hacettepe University
Department of Urology
Dr. Mesut Tez Atatürk Chest Disease Research Hospital (Sanatorium)
Assoc. Prof. Dr. Mesut Çetinkaya Ankara Numune Hospital Department of Urology
Participation in the experiments Ms. Cemaliye Akyerli Bilkent University
Dept. of Molecular Biology and Genetics Mr. Ahmet Uçar Bilkent University
Dept. of Molecular Biology and Genetics
Statistical analysis Mr. Attila Halil Elhan Ankara University
Dept. of Biostatistics
Supervision and writing the manuscript Assoc. Prof. Dr. Tayfun Özçelik Bilkent University
Dept. of Molecular Biology and Genetics
Provision of Research Funds Bilkent University
TABLE OF CONTENTS SIGNATURE PAGE i ABSTRACT iii ÖZET iv ACKNOWLEDGEMENTS v TABLE OF CONTENTS vi
LIST OF TABLES viii
LIST OF FIGURES x
ABBREVATIONS xi
1. INTRODUCTION 1
1.1 Genetic Basis of Human Disease 1
1.1.1 Mendellian Inheritance 1 1.1.2 Non-Mendellian Inheritance 2
1.2 Genetic Basis of Cancer 4
1.2.1 General Information 4 1.2.2 Genetic Predisposition to Cancer 7
1.2.2.1 Mendellian Inheritance 7 1.2.2.2 Multifactorial Inheritance 9 1.2.2.2.1 General concepts 9 1.2.2.2.2 Glutathione S-Transferases 13 1.2.2.2.3 TP53 gene 26 1.3 Bladder Cancer 30 1.3.1 Clinical Information 30 1.3.1.1 Epidemiology and Etiology 30 1.3.1.2 Pathology 31 1.3.2 Genetic predisposition to bladder cancer 32
1.4 Aim 37
2. MATERIALS AND METHODS 38
2.1 Materials 38
2.1.1 Subjects 38 2.1.1.1 Patient group 38 2.1.1.2 Age-sex matched control group 38 2.1.1.3 Random controls 39 2.1.2 Oligonucleotides 39 2.1.3 Chemical and Reagents 40 2.1.4 PCR Materials 41 2.1.5 Restriction enzymes 41 2.1.6 Standard solutions 42
2.2 Methods 44
2.2.1 DNA isolation 44 2.2.2 Polymerase Chain Reaction (PCR) 45 2.2.3 Agarose Gel Electrophoresis 46 2.2.4 Analysis with restriction endonucleases 46 2.2.5 Genotyping of DNA samples 47 2.2.5.1 GSTM1 genotyping 47 2.2.5.2 GSTP1 genotyping 48 2.2.5.3 GSTT1 genotyping 49 2.2.5.4 TP53 genotyping 50 2.2.6 Statistics 51 2.2.6.1 Chi-square test 51 2.2.6.2 Odds ratio 52 2.2.6.3 Analysis of gene-gene interaction 53
3. RESULTS 55 3.1 Glutathione S-transferases 55 3.2 TP53 codon 72 62
4. DISCUSSION 64
LIST OF TABLES
Table 1. List of Familial Cancer Genes and Syndromes __________________ 8 Table 2. Important Gene Polymorphisms related to Cancer _______________ 10 Table 3. The Glutathione S-tranferases _______________________________ 13 Table 4. Case-control studies on the association of GSTM1 null genotype
and cancer _______________________________________________________ 16 Table 5. Case control studies on the association of GSTP1 Ile105Val polymorphism and cancer _______________________________________________________ 21 Table 6. Case control studies on the association of GSTT1 null genotype
and cancer _______________________________________________________ 23 Table 7. Major exonic polymorphisms of TP53 gene ______________________ 26 Table 8. Case control studies on the association of TP53 Arg72Pro polymorphism and cancer ________________________________________________________ 28 Table 9. TNM staging of Bladder Cancer _______________________________ 32 Table 10. Genetic association (case-control) studies on bladder cancer________ 34 Table 11. List of oligonucleotides for PCR experiments ___________________ 39 Table 12. Sample 2x2 table for OR analysis ____________________________ 53 Table 13 A simple gene-gene interaction model for case-control studies _______ 54 Table 14. Distribution of the GSTM1, GSTP1 and GSTT1 genotypes in the age-sex matched controls and bladder cancer patients _____________________________ 55 Table 15. Combination of the GSTM1 null with GSTP1 105 Ile/Val or Val/Val genotypes and bladder cancer risk _______________________________ 56 Table 16. GST genotype distribution and risk associated with genotype combinations _____________________________________________ 57
Table 17. Distribution of the GSTM1, GSTP1 and GSTT1 genotypes in invasive and superficial bladder tumors. __________________________________________ 60 Table 18. Distribution of GST genotypes stratified according to smoking status in cases and controls ________________________________________________ 60 Table 19. Combined risk of bladder cancer associated with smoking and GST genotypes _______________________________________________________ 61 Table 20. Distribution of the TP53genotypes in the age-sex matched controls and bladder cancer patients _____________________________________________ 62 Table 21. Distribution of the TP53 genotypes in invasive and superficial bladder tumors __________________________________________________________ 63
LIST OF FIGURES
Figure 1. The cellular pathways related to malignant transformation __________ 6 Figure 2. A framework for genetic effects on cancer development ___________ 12 Figure 3. Schematic description of GSTM1 genotyping ___________________ 47 Figure 5. Schematic description of GSTP1 genotyping ____________________ 48 Figure 6. Schematic description of GSTT1 genotyping ____________________ 49 Figure 7. Schematic description of TP53 codon 72 genotyping ______________ 50 Figure 3. Genotyping of Glutathione S-Tranferase genes___________________ 59 Figure 8. Genotyping of TP53 gene____________________________________ 63
ABBREVATIONS
AD Autosomal Dominant AHR Arylcarbon receptor ALOX5 Arachidonate 5-lipooxygenase APC Adenomatous Polyposis of colon AR Autosomal Recessive bp Base Pair
BRCA1 Breast Cancer Susceptibility gene 1 BRCA2 Breast Cancer Susceptibility gene 2 CASP 10 Caspase 10
CDH1 Cadherin 1
CDKN1C Cyclin dependent kinase 1C CDKN2A Cyclin dependent kinase 2A CYP1A1 Cytochrome P450 1A1 CYP1A2 Cytochrome P450 1A2 CYP1B1 Cytochrome P450 1B1 CYP2A6 Cytochrome P450 2A6 CYP2C9 Cytochrome P450 2C9 CYP2C19 Cytochrome P450 2C19 CYP2D6 Cytochrome P450 2D6 CYP3A4 Cytochrome P450 3A4
CYP11a Cytochrome P450 subfamily Xia CYP17 Cytochrome P450 subfamily XVII CYP19 Cytochrome P450 subfamily XIX
DNA Deoxyribonucleic acid DIA4 Diaphorase 4
dNTP deoxynucleotide triphosphate
ERCC1 Excision repair cross-complemeting rodent deficiency Complementation group 1
ERCC2 Excision repair cross-complemeting rodent deficiency Complementation group 2
ESRRA Estrogen-related receptor alpha EXT1 Exotosin 1
EXT2 Exotosin 2
GRRL1 Glucocorticoid receptor like 1 GSTM1 Glutathione S-Transferase Mu 1 GSTM2 Glutathione S-Transferase Mu 2 GSTM3 Glutathione S-Transferase Mu 3 GSTM4 Glutathione S-Transferase Mu 4 GSTM5 Glutathione S-Transferase Mu 5 gr gram L Liter
MADH4 Mothers against decapapenaplegic drosophilia homolog of 4 MCR1 Melanocortin receptor 1
MEN1 Multiple Endocrin Neoplasia 1
MGMT O-methylguanine-DNA methyltransferase MLH1 Mut L Homologue 1 ml milliliter mM milimolar MPO Myeloperoxidase MSH2 Mut S Homologue 2
NAT2 N-acetyltransferase 2 NF1 Neurofibromatosis 1 NF2 Neurofibromatosis 2 ng nanogram
NR112 Nuclear receptor subfamily 1, group 1, member 2 PCR Polymerase chain reaction
pmol picomol
PKU Phenylketonuria
PPAR A Peroxisome proliferative activated receptor, alpha PPAR G Peroxisome proliferative activated receptor, gamma PRPKAR1A Protein kinase c-AMP depenedent regulatory type 1 POLB Polymerase beta
PTCH Patched Drosophilia, homologue of PTGS1 Prostaglandin-endoperoxidase synthase 1 PTGS2 Prostaglandin-endoperoxidase synthase 2 RB Retinoblastoma gene
RET Rearranged during transfection
SDHD Succinate Dehydyrogenase Complex, Subunit D
SMACB1 SWI/SNF related, Matrix Associated, Actin Dependent regulator of chromatin subfamily 1, Member 1
STK11 Serine/Threonine Protein Kinase 11 SULT1A1 Sulfotransferase 1A1
SULT1A2 Sulfotransferase 1A2 TNF Tumor necrosing factor TP53 Tumor protein p53 TSC1 Tubero Sclerosis 1 TSC2 Tubero Sclerosis 1
VHL Von Hipple Landau XD X-linked domiant XR X-linked Recessive
XRCC1 X-ray complemeting repair in Chinese Hamster Cells 1 XRCC2 X-ray complemeting repair in Chinese Hamster Cells 2 XRCC3 X-ray complemeting repair in Chinese Hamster Cells 3 XRCC4 X-ray complemeting repair in Chinese Hamster Cells 4 XRCC5 X-ray complemeting repair in Chinese Hamster Cells 5 WT1 Wilms Tumor1 gene
1. Introduction
1.1 Genetic Basis of Human Disease 1.1.1 Mendellian Inheritance
None of the fellow monks in the Augustinian monastery, near Brno (in Czech republic) would have thought the impact of the work of their colleague, Gregor Mendel who likes crossbreeding peas in the garden. His work was published in published in the 1866 issue of the Verhandlungen des naturforschenden Vereins, the Proceedings of the Natural History Society in Brünn (Ostrer, 1998), and remained dormant until the beginning of 20th century.
Briefly Mendel crossed, parent peas, which has a difference only in one characteristic (i.e. seed shape or seed color). He observed that all the progeny (F1 generation) has one trait, he named this appearing trait as dominant, and the lost trait is recessive. When he crossed the F1 generation, he observed that 25% of the progeny (F2 generation) have the recessive trait that is present in F0, but not F1 generation. The reappearance of the recessive characteristic in F2 generation indicated that recessive genes are neither modified nor lost in F1 generation, but the dominant and recessive genes are independently transmitted, and so are able to segregate independently during the formation of sex cells. This is called Mendel’s 1st Law: Principle of Independent Segregation. In his further experiments Mendel crossed the seeds with two traits, pure round yellow, and wrinkled green. He saw that in F1 generation all seeds were dominant round yellow form, in F2 generation wrinkled yellow, and round green forms were also emerged with the ratio of 9 round yellow, 3 round green, 3 wrinkled yellow, and 1 wrinkled green. He concluded that each gene pair was independently to the gamete during sex cell formation.
There is no tendency for genes from the same parent to segregate together. This principle is called as Mendel’s second law: Principle of independent assortment (Watson, 1988).
Mendellian diseases are the diseases, which are the result of a single mutant gene that has a large effect on phenotype and that are inherited as simple patterns similar to or identical with those described by Mendel for certain discrete characteristics in garden peas (Gelether, 1998).
In medical genetics, a trait is called dominant, if the individual is heterozygous (i.e. one copy of the mutant allele) for the mutant allele, and exhibits the disease phenotype. A trait is regarded as recessive, if the individual is homozygous. (i.e. two copies of the mutant allele) or compound heterozygote (i.e. two different copies of the mutant allele). If an allele is located on sex chromosome, it is called X-linked or Y-linked, but in other 22 chromosomes (autosomes), the trait is called autosomal. Since genes located on Y chromosome is very rare, for practical purposes there are four patterns of inheritance of monogeneic diseases. Autosomal Dominant (AD), Autosomal Recessive (AR), X-linked Recessive (XR), and X-linked dominant (XD). More than 6500 phenotypes have been reported as Mendellian diseases, and more than 50% are AD, 36% are AR, and less than 10% are X-linked (Gelether, 1998).
1.1.2 Non-Mendellian Inheritance
The Non-Mendellian pattern of inheritance of traits was observed due to two reasons. One is the existence of other mammalian modes of inheritance, which were not envisaged by Mendel laws. The other that is a trait (phenotype) is not necessarily composed of one inheritable unit (i.e. gene), many genes (polygenic) and
additional environmental factors (multifactorial) might be responsible for the phenotype.
Mitochondrial inheritance, and genomic imprinting are the examples for the existence of different modes of inheritance (Ostrer, 1998). In mitochondrial inheritance, only the maternal mitochondria are inherited, therefore only the maternal genes are transmitted. This phenomenon is against the principal of independent segregation, since the concept of independence implicitly refers to existence of more than one alleles, while in this case only the maternal allele is segregating. Imprinting denotes to a case that the gene contributes to the phenotype, not due to whether is dominant or recessive vis-a-vis the other allele, but from which parent it is inherited. It is an exceptional situation where the Mendellian concepts of dominance are totally are meaningless.
When a trait is dependent on more than one genes, or environmental factors, it is regarded as multifactorial, and/or polygenic traits. Although the terms polygenic and multifactorial are often used interchangeably, technically speaking their definitions are different. Polygenic traits are the traits caused by the impact of the many genes, each having only a limited individual impact on phenotype, where as the term multifactorial points out the interaction of genetic susceptibility factors and the environment. (Gelehrter, 1998)
It is impotent to note that most traits of medical importance, such as susceptibility to diabetes, hypertension, cancer, coronary heart disease and infection are inherited as multifactorial and/or polygenic traits (Lander and Schork 1994). Therefore the impact for the population is much more than the impact of Mendellian diseases. However it should be remembered that in complex multifactorial diseases, not the disease by itself but the susceptibility to the disease is determined by genetic
factors. The expression of the disease phenotype on a particular individual is based on the interaction of various genetic and environmental factors.
The current paradigm is that the polygenic traits are usually quantitative rather than qualitative, and frequently distributed continuously in a Gaussian distribution. The phenotype is, however, usually by definition is a discontinuous trait. The threshold model is used for explaining the this phenomenon. According to this model, the phenotype is observed, when the accumulated genetic load passes a threshold.
1.2 Genetic Basis of Cancer 1.2.1 General Information
Cancer is a genetic disease in the sense that mutations must take place for the expression of the phenotype. It is a somatic masochism which are characterized by unscheduled, and uncontrolled cellular proliferation of the affected (Ponder 2001). The other common features of cancer cell phenotype are evading apoptosis, self-sufficiency in growth signals, insensitivity to growth signals, limitless replicate potential, sustained angiogenesis, and tissue invasion and metastasis. (Hanahan ane Weinberg 2000). It is quite striking to see the evolution of a normal behaving cells, to an aggressive cancer cells. The current concept is that all the bunch of cancer cells (neoplastic clone) in a patient is the progeny of a single cell (clonal expansion), and a series of events (genetic or epigenetic alterations) should take place for this transformation (multistep carcinogenesis). These events can be classified as gain of function, and loss of function of events (Ponder 2001).
The genes involving in gain of function events are the proto-oncogenes. They are “activated” in various ways, and this activation gives an evolutionary advantage to the cell on which the “activation” takes place. The oncogenes have the role in transmission of the signals for proliferation (e.g. RAS), in proliferation in itself (e.g. cyclin D), and suppression of apoptosis (e.g. Bcl-2). An important point is that these alterations are dominant in nature, (i.e. an alteration in one allele in cell is enough for the expression of the phenotype).
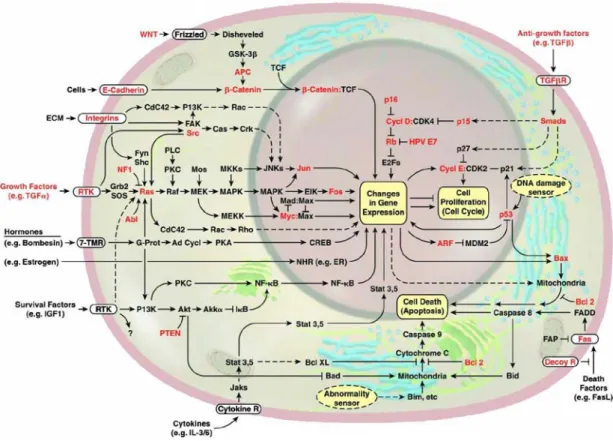
The tumor suppressor genes are involved in loss of function events, as their name implies their loss is associated with neoplasia. They are recessive in nature, since two of the alleles should be inactivated. These genes are classified into two: Gatekeepers, and caretakers (Kinzler and Vogelstein 1997). Gatekeepers are the genes that control the proliferation (e.g. Rb), where as caretakers are the genes responsible for maintaining the integrity of the genome (e.g. MLH1). The tumor suppressor genes primarily involve in cycle control, apoptosis, and DNA repair. The major genes whose alterations are important in cancer related events are shown in red in Figure 1.
Figure 1. The cellular pathways related to malignant transformation (adopted from Evan and Vousden 2001)
1.2.2 Genetic Predisposition to Cancer 1.2.2.1 Mendellian Inheritance
Importance of familial factors in the pathogenesis of cancer has been appreciated by the medical community, and obtaining a family history from the encountered cancer patient has been routinely conducted. In some rare families cancer has been found to be segregating as an autosomal dominant trait in the family. It was observed that familial history, early age of onset, and neoplasias at multiple sites (either in the same organ or different organs ) are the common denominators of these autosomal dominantly segregating familial cancers. In 1971, Alfred Knudson proposed that the germline event in the familial retinablastoma leads to an inactivation of an autosomal tumor suppressor gene in all cells, and a somatic mutation has hit and inactivates the remaining allele, abrogating the total function of the protein, and causes neoplasia. In somatic cancers, however two spontaneous mutations occur in the same cell (Knudson 1971). This model fitted the clinical observations entirely since, it explains the multifocality, and early-age of onset in familial cancers. Knudsons’ hypothesis was proven after the cloning of the retinablastoma gene, in 1987 (Lee et al. 1987), and became the central paradigm for familial cancers in many years. The paradigm was challenged by Kinzler and Vogelstein (Kinzler and Vogelstein 1997), by gatekeeper and gatekeeper hypothesis. The reason was that no somatic mutations was found in Hereditary Non-Polyposis colon cancer genes (MLH1, MSH2) which was responsible from DNA repair, and Hereditary Breast Cancer genes (BRCA1, BRCA2) in tumor tissues. Recently however, this observations have been started to be challenged too by the detection of epigenetic silencing of these genes (Bevilacqua and Simpson 2000; Esteller et al.
2000). The germ-line mutations in hereditary cancers are usually on the tumor suppressor genes which are responsible for regulation of cell cycle and DNA-repair with the notable exception of RET oncogene. The genes and associated hereditary cancer syndromes are shown in Table 1.
Table 1: List of Familial Cancer Genes and Syndromes
Gene Locus Cancer syndrome
APC 5q21 Familial polyposis of colon BRCA1 17q21 Hereditary Breast/Ovarian Cancer BRCA2 13q12 Hereditary Breast/Ovarian Cancer CDH1 16q22.1 Familial gastric carcinoma CDKN2A 9p21 Cutaneous malignant melanoma CDKN1C 11p15.5 Beckwith-Wiedeman Syndrome CYLD 16q12.1 Familial cylindramotosis
EXT1 8q24.11-q24.13 Multiple extoses type 1 EXT2 11p12-p11 Multiple extoses type 2 MADH4 18q21.1 Juvenile Polyposis
MEN1 11q13 Multiple endocrine neoplasia type1 MLH1 3p21 Hereditary non-polyposis colon cancer MSH2 2p16 Hereditary non-polyposis colon cancer NF1 17q11.2 Neurofibromatosis type 1
NF2 22q12.2 Neurofibromatosis type PRKAR1A 17q23-q24 Carney Complex
PTCH 9q22 Nevoid basal cell carcinoma PTEN 10q23.3 Cowdens Syndrome RB1 13q14 Familial Retinablastoma
RET 10q11.2 multiple endocrine neoplasia MEN2A, MEN2B and medullar thyroid carcinoma
SDHD 11q23 Familial paraganglioma SMARCB1 22q11 Rhabdoid predisposition syndrome TP53 17p13 Li-Fraumeni Syndrome TSC1 9q34 Tuberous Sclerosis 1
TSC2 16p13.3 Tuberous Sclerosis 1
STK11 19p13.3 Peutz-Jegers syndrome VHL 3p25 Von Hipple- Lindau Syndrome WT1 11p13 Familial Wilms Tumor
Adopted from (Futreal et al. 2001), the locus and function information is gathered from GeneCards (http://bioinfo.weizmann.ac.il/cards/)
1.2.2.2 Multifactorial Inheritance 1.2.2.2.1 General Concepts
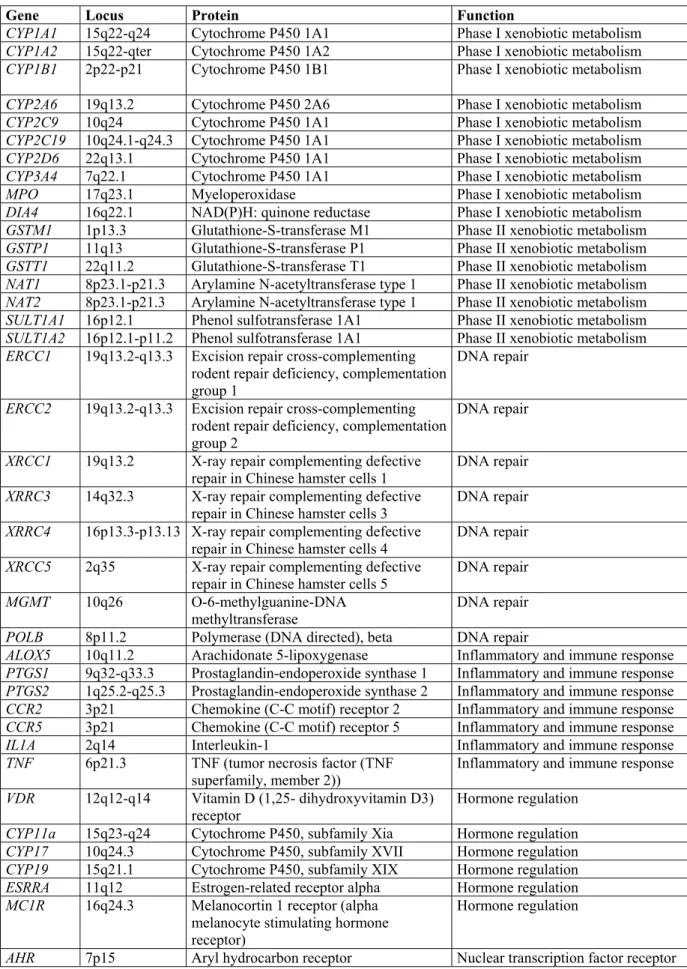
Cancer pathogenesis is a complex phenomenon. For the pathogenesis, not only what kind of pathway events (i.e. mutations or change in the expression of genes) will occur, but also the factors affecting that probability of the events will occur, and factors that influence the effect of pathway of events are important. (Ponder 2001) (Figure 2). The factors affecting the probability of the events in the cell are actually synonymous, in clinical grounds, with the factors associated with the cancer risk. In cancer syndromes segregating in mendellian fashion, usually part of the pathway of events leading to malignant transformation (e.g. RB mutation), or factors affecting the genomic stability in the cell is inherited (e.g. MLH1 mutation), where as in cancers segregating in non-Mendellian fashion (i.e. so called sporadic cancers), the factors affecting the probability of the events (i.e. mutations) are very important. The main factors are primarily the way the carcinogens are metabolized (Phase I and Phase II drug metabolizing enzymes polymorphisms), and how efficient is the DNA damage is handled (DNA repair enzyme polymorphisms). However the polymorphisms in the genes regulating immune response, hormone regulation, nuclear transcription factors, and cell cycle regulation and apoptosis have been also regarded as important genetic risk factors (see Table 2 for major gene polymorphisms). The impact of these gene polymorphisms for the individual (i.e. their penetrance) is not as dramatic as the genes showing autosomal dominant inheritance.However their impact for the population in terms of public health may be quite important, considering their high frequency in the population.
Table 2 Major gene polymorphisms associated with cancer
Gene Locus Protein Function
CYP1A1 15q22-q24 Cytochrome P450 1A1 Phase I xenobiotic metabolism CYP1A2 15q22-qter Cytochrome P450 1A2 Phase I xenobiotic metabolism CYP1B1 2p22-p21 Cytochrome P450 1B1 Phase I xenobiotic metabolism CYP2A6 19q13.2 Cytochrome P450 2A6 Phase I xenobiotic metabolism CYP2C9 10q24 Cytochrome P450 1A1 Phase I xenobiotic metabolism CYP2C19 10q24.1-q24.3 Cytochrome P450 1A1 Phase I xenobiotic metabolism CYP2D6 22q13.1 Cytochrome P450 1A1 Phase I xenobiotic metabolism CYP3A4 7q22.1 Cytochrome P450 1A1 Phase I xenobiotic metabolism MPO 17q23.1 Myeloperoxidase Phase I xenobiotic metabolism DIA4 16q22.1 NAD(P)H: quinone reductase Phase I xenobiotic metabolism GSTM1 1p13.3 Glutathione-S-transferase M1 Phase II xenobiotic metabolism GSTP1 11q13 Glutathione-S-transferase P1 Phase II xenobiotic metabolism GSTT1 22q11.2 Glutathione-S-transferase T1 Phase II xenobiotic metabolism NAT1 8p23.1-p21.3 Arylamine N-acetyltransferase type 1 Phase II xenobiotic metabolism NAT2 8p23.1-p21.3 Arylamine N-acetyltransferase type 1 Phase II xenobiotic metabolism SULT1A1 16p12.1 Phenol sulfotransferase 1A1 Phase II xenobiotic metabolism SULT1A2 16p12.1-p11.2 Phenol sulfotransferase 1A1 Phase II xenobiotic metabolism ERCC1 19q13.2-q13.3 Excision repair cross-complementing
rodent repair deficiency, complementation group 1
DNA repair ERCC2 19q13.2-q13.3 Excision repair cross-complementing
rodent repair deficiency, complementation group 2
DNA repair XRCC1 19q13.2 X-ray repair complementing defective
repair in Chinese hamster cells 1 DNA repair XRRC3 14q32.3 X-ray repair complementing defective
repair in Chinese hamster cells 3 DNA repair XRRC4 16p13.3-p13.13 X-ray repair complementing defective
repair in Chinese hamster cells 4 DNA repair XRCC5 2q35 X-ray repair complementing defective
repair in Chinese hamster cells 5 DNA repair MGMT 10q26 O-6-methylguanine-DNA
methyltransferase
DNA repair POLB 8p11.2 Polymerase (DNA directed), beta DNA repair
ALOX5 10q11.2 Arachidonate 5-lipoxygenase Inflammatory and immune response PTGS1 9q32-q33.3 Prostaglandin-endoperoxide synthase 1 Inflammatory and immune response PTGS2 1q25.2-q25.3 Prostaglandin-endoperoxide synthase 2 Inflammatory and immune response CCR2 3p21 Chemokine (C-C motif) receptor 2 Inflammatory and immune response CCR5 3p21 Chemokine (C-C motif) receptor 5 Inflammatory and immune response IL1A 2q14 Interleukin-1 Inflammatory and immune response TNF 6p21.3 TNF (tumor necrosis factor (TNF
superfamily, member 2)) Inflammatory and immune response VDR 12q12-q14 Vitamin D (1,25- dihydroxyvitamin D3)
receptor Hormone regulation CYP11a 15q23-q24 Cytochrome P450, subfamily Xia Hormone regulation CYP17 10q24.3 Cytochrome P450, subfamily XVII Hormone regulation CYP19 15q21.1 Cytochrome P450, subfamily XIX Hormone regulation ESRRA 11q12 Estrogen-related receptor alpha Hormone regulation MC1R 16q24.3 Melanocortin 1 receptor (alpha
melanocyte stimulating hormone receptor)
Hormone regulation
Gene Locus Protein Function PPARA 22q13.31 peroxisome proliferative activated
receptor, alpha Nuclear transcription factor receptor PPARG 3p25 peroxisome proliferative activated
receptor, gamma Nuclear transcription factor receptor NR1I2 3q12-q13.3 nuclear receptor subfamily 1, group I,
member 2
Nuclear transcription factor receptor TNFRSF6 10q24.1 tumor necrosis factor receptor
superfamily, member 6 Cell cycle regulation and apoptosis TP53 17p13.1 tumor protein p53 Apoptosis, cell cycle regulation, CASP10 2q33-q34 caspase 10, apoptosis-related cysteine
protease Apoptosis, cell cycle regulation DFFB 1p36.3 DNA fragmentation factor, 40 kD, beta
polypeptide (caspase-activated DNase)
Apoptosis, cell cycle regulation Partially adopted from Brockmoller et al, 2000, the locus and function information is gathered from GeneCards (http://bioinfo.weizmann.ac.il/cards/)
Figure 2. A framework for genetic effects on cancer development. (adopted from Ponder 2001)
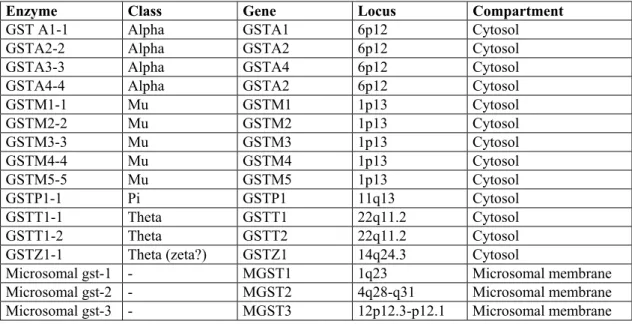
1.2.2.2.2 Glutathione S-Tranferases
Glutahione S-tranferases comprises a super gene family of enzymes of phase 2 enzymes which are responsible of the conjugation of the glutathione to the compounds with a electrophilic, which are activated by cytochrome p450 enzymes (Strange and Fryer 1999). This super family is made of four gene familes (or enzyme classes in a protein oriented perspective), which called are alpha, mu, pi and theta. (there is also a zeta form, which is classified in theta category) (Seidegard and Ekstöm, 1997; Miller et al. 2000). Each gene family is tandemly located in a particular locus. Alpha is on 6q22, Mu is 1p13, Pi is on 11q13, and Theta is on 22q13.2. Glutathione S-tranferases are dimeric proteins which are located in the cytosol. In addition to these cytosolic enzymes, there are microsamal enzymes which conjugate glutathione. The microsomal enzymes, which are present in outer membrane of microsome mitochondria, do not have a structural similarity to cytosolic GSTs,
Table 3: The Glutathione S-tranferases
Enzyme Class Gene Locus Compartment GST A1-1 Alpha GSTA1 6p12 Cytosol
GSTA2-2 Alpha GSTA2 6p12 Cytosol GSTA3-3 Alpha GSTA4 6p12 Cytosol GSTA4-4 Alpha GSTA2 6p12 Cytosol GSTM1-1 Mu GSTM1 1p13 Cytosol GSTM2-2 Mu GSTM2 1p13 Cytosol GSTM3-3 Mu GSTM3 1p13 Cytosol GSTM4-4 Mu GSTM4 1p13 Cytosol GSTM5-5 Mu GSTM5 1p13 Cytosol GSTP1-1 Pi GSTP1 11q13 Cytosol GSTT1-1 Theta GSTT1 22q11.2 Cytosol GSTT1-2 Theta GSTT2 22q11.2 Cytosol GSTZ1-1 Theta (zeta?) GSTZ1 14q24.3 Cytosol Microsomal gst-1 - MGST1 1q23 Microsomal membrane Microsomal gst-2 - MGST2 4q28-q31 Microsomal membrane Microsomal gst-3 - MGST3 12p12.3-p12.1 Microsomal membrane Partially adopted from (Siegard and Ekstöm, 1997), the locus information is gathered from GeneCards (http://bioinfo.weizmann.ac.il/cards/)
The range of potential substrates of GSTs is very large, since they can metabolize compounds with an electrophilic center due to high nuclophilicity of the reduced thiol of these enzymes. However, in a biological perspective the substrates of these enzymes can be classified as products of oxidative stress and xenobiotic activation (Strange et al. 1999).
Oxidative products of lipids and DNA can be metabolized by these enzymes. Alpha class of enzymes metabolizes cumene hydoxyoperoxidase, and 4-hydroxyonel, which are products of lipid peroxidation. GSTT2 also catalyze cumene hydoxyoperoxidease. GSTT1 detoxifies oxidative lipid products, and DNA. GSTP1 involves in the detoxification of base propenals (Norppa, 1997)
In addition to metabolizing the products of oxidative stress, these enzymes also catalyze the xenobiotics, which are also environmental carcinogens. One of most important of them is Polycyclic aromatic hydrocarbons. These compounds are activated by cytochrome p450 enzymes. The activated intermediate metabolites actually the carcinogenic form. These epoxide are effective subsrates for mu, and pi class of enzymes. GSTP1-1 enzyme metabolizes the carcinogenic products such as benzo(a)pyrene diol epoxide and acrolein, which are derived from cigarette smoke. GSTT1 enzymes also involve in the metabolism of carcinogenic substances, such as methylating agents, pesticides and industrial solvents. (Seidegard and Ekstöm, 1997; Strange et al, 1999)
It is quite obvious that, the activity of the GSTs is highly critical in the detoxification of the carcinogens. Therefore changes in the activity of these enzymes should have important consequences during the carcinogenic process. The functional consequences of GSTM1 and the GSTT1 null genotypes are clear in terms of enzymatic activity: No gene, no enzyme, no activity. The GSTP1 313 A/G
polymorphism at the nucleotide level leads to an amino acid difference of isoleucine and valinbe at codon 105 in the protein. The valine aminoacid results in decreased enzyme activity (Ali-Osman et al. 1997). Although it is easy to deduce this hypothesis, it is not so easy to prove, which is the main reason that so much controversy exist in the literature about the importance of the genetic polymorphisms and cancer risk.
The data pointing out the significance of these polymorphisms are based on mainly two groups of studies. First group of studies is focused on the association of the polymorphisms and cellular markers showing mutagenic potential. Sister chromatid exchange, Comet assay, and DNA adduct studies are in this group (Norppa, 1997). The second group of studies is case-control and/or case-case type of studies. In these type of studies, genotype frequencies of these polymorphism, and risk factors were assessed.
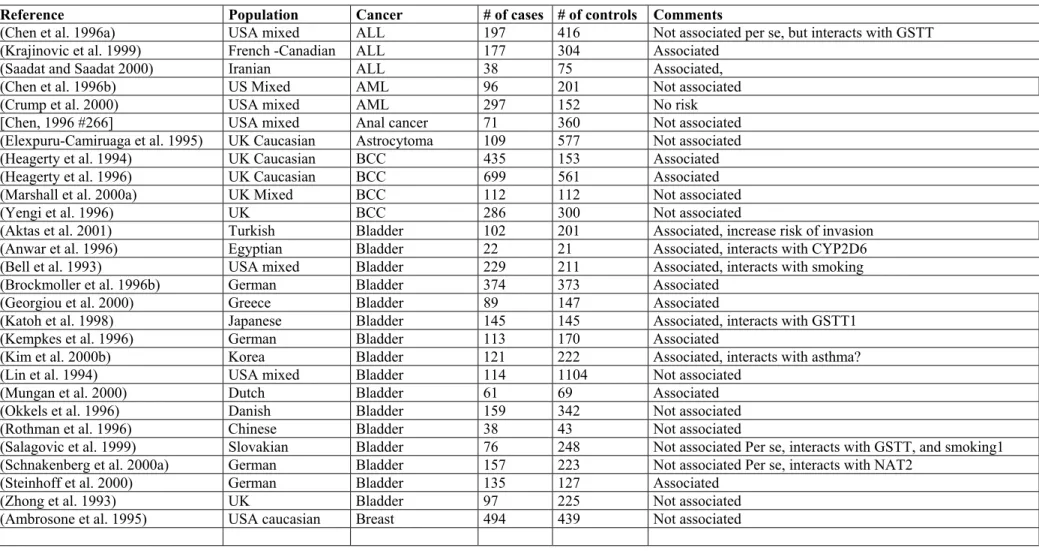
The association of GSTM1 null genotype with bladder and lung cancer has been replicated in many studies in many ethnic groups. The results of association studies on other cancer sites such as breast, colon, liver, gastric cancer, pituitary adenoma, endometrial cancer, and acute lymphoctic leukemia and larynx are not so replicable. (Table 4).
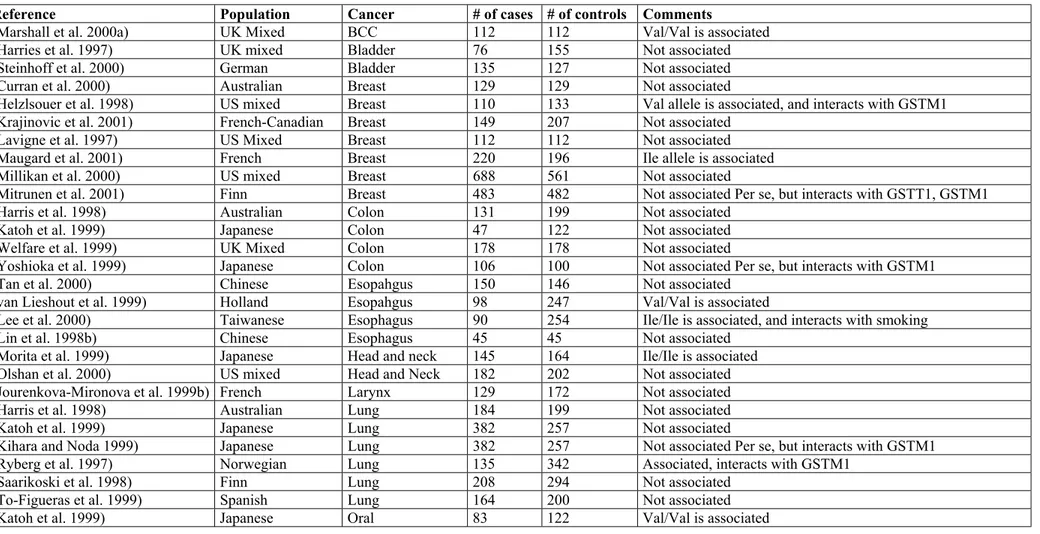
GSTP1 related data for association studies are largely discordant, though the polymorphisms of this gene might be of importance for neoplasms of breast, prostate, bladder, esophagus and ALL (Table 5).
GSTT1 seems to be associated with cancers of larynx, and skin (basal cell carcinoma), astrocytomas, meningioma, and astrocytomas, ALL and myelodysplastic syndome, but not with cancers of bladder, gastric, liver, endometrium, and ovaries (Table 6).
Table 4. Case-control studies on the association of GSTM1 null genotype and cancer
Reference Population Cancer # of cases # of controls Comments
(Chen et al. 1996a) USA mixed ALL 197 416 Not associated per se, but interacts with GSTT
(Krajinovic et al. 1999) French -Canadian ALL 177 304 Associated
(Saadat and Saadat 2000) Iranian ALL 38 75 Associated,
(Chen et al. 1996b) US Mixed AML 96 201 Not associated
(Crump et al. 2000) USA mixed AML 297 152 No risk
[Chen, 1996 #266] USA mixed Anal cancer 71 360 Not associated
(Elexpuru-Camiruaga et al. 1995) UK Caucasian Astrocytoma 109 577 Not associated
(Heagerty et al. 1994) UK Caucasian BCC 435 153 Associated
(Heagerty et al. 1996) UK Caucasian BCC 699 561 Associated
(Marshall et al. 2000a) UK Mixed BCC 112 112 Not associated
(Yengi et al. 1996) UK BCC 286 300 Not associated
(Aktas et al. 2001) Turkish Bladder 102 201 Associated, increase risk of invasion
(Anwar et al. 1996) Egyptian Bladder 22 21 Associated, interacts with CYP2D6
(Bell et al. 1993) USA mixed Bladder 229 211 Associated, interacts with smoking
(Brockmoller et al. 1996b) German Bladder 374 373 Associated
(Georgiou et al. 2000) Greece Bladder 89 147 Associated
(Katoh et al. 1998) Japanese Bladder 145 145 Associated, interacts with GSTT1
(Kempkes et al. 1996) German Bladder 113 170 Associated
(Kim et al. 2000b) Korea Bladder 121 222 Associated, interacts with asthma?
(Lin et al. 1994) USA mixed Bladder 114 1104 Not associated
(Mungan et al. 2000) Dutch Bladder 61 69 Associated
(Okkels et al. 1996) Danish Bladder 159 342 Not associated
(Rothman et al. 1996) Chinese Bladder 38 43 Not associated
(Salagovic et al. 1999) Slovakian Bladder 76 248 Not associated Per se, interacts with GSTT, and smoking1
(Schnakenberg et al. 2000a) German Bladder 157 223 Not associated Per se, interacts with NAT2
(Steinhoff et al. 2000) German Bladder 135 127 Associated
(Zhong et al. 1993) UK Bladder 97 225 Not associated
Reference Population Cancer # of cases # of controls Comments
(Bailey et al. 1998) US Mixed Breast 263 263 Not associated
(Charrier et al. 1999) French Breast 361 437 Assocaition with postmenapausal risk
(Curran et al. 2000) Australia Breast 129 129 No risk
(Garcia-Closas et al. 1999) USA mixed Breast 466 466 Not associated
(Helzlsouer et al. 1998) US mixed Breast 110 133 Associated, and interacts with GSTP1
(Maugard et al. 2001) French Breast 220 196 Not associated
(Millikan et al. 2000) US mixed Breast 688 561 Not associated
(Mitrunen et al. 2001) Finn Breast 483 482 Associated in premenaposal woman, interacts with GSTP1,
GSTT1
(Park et al. 2000b) Korea Breast 189 189 Associated, interacts with GSTT1
(Zhong et al. 1993) UK Breast 197 225 Not associated
(Chen and Nirunsuksiri 1999) USA Caucasian Cervix 190 206 No risk
(Goodman et al. 2001) USA Hawai Cervix 131 180 Not associated
(Abdel-Rahman et al. 1999) Egyptian Colon 66 55 No risk
(Butler et al. 2001) Australian Colon 219 200 Not associated
(Chenevix-Trench et al. 1995) Australia Colon 132 100 Not associated
(Deakin et al. 1996) UK Caucasian Colon 252 577 Not associated
(Gawronska-Szklarz et al. 1999) Poland Colon 70 145 Associated
(Gertig et al. 1998) USA mixed Colon 212 221 Not associated
(Guo et al. 1996) Chinese Colon 19 23 Associated
(Inoue et al. 2001) Japanese Colon 205 220 Not associated
(Katoh et al. 1996) Japanese Colon 103 126 Associated
(Lin et al. 1995) USA mixed Colon 446 488 Not associated
(Saadat and Saadat 2001) Iranian Colon 42 131 Not associated Per se, interacts with GSTT1
(Welfare et al. 1999) UK Colon 178 178 No association
(Zhang et al. 1999) Swedish Colon 99 109 No association
(Zhong et al. 1993) UK Colon 196 225 Associated
(Esteller et al. 1997) Spanish Endometrium 80 60 Not associated
(Tan et al. 2000) Chinese Esopahgus 150 146 Associated
(van Lieshout et al. 1999) Holland Esopahgus(Barret) 98 247 No association
Reference Population Cancer # of cases # of controls Comments
(Morita et al. 1997) Japanese Esophagus 53 132 Not associated
(Katoh et al. 1996) Japanese Gastric 139 126 Associated
(Baranov et al. 1996) Russian GI 37 67 Associated
(McGlynn et al. 1995) USA Asian HCC 52 116 Associated
(Omer et al. 2001) Sudan HCC 110 189 Associated, interacts with peanut butter
(Yu et al. 1995b) Taiwan HCC 30 150 Not associated
(Cheng et al. 1999) USA mixed Head and Neck 162 315 Associated
(Kihara et al. 1997) Japanese Head and Neck 150 474 Associated, interacts with smoking
(Ko et al. 2001) German Head and Neck Not associated
(Matthias et al. 1999b) German Head and Neck 398 216 Not associated
(McWilliams et al. 2000) US mixed Head and Neck 160 114 Not associated
(Morita et al. 1999) Japanese Head and neck 145 164 Not associated
(Olshan et al. 2000) US mixed Head and Neck 182 202 Not associated Per se, but interacts with CYP1A1
(Trizna et al. 1995) USA Head and Neck 186 42 Associated
(Hong et al. 2000a) Korea Larynx 82 63 Associated, interact with GSTT1
(Jahnke et al. 1996) UK Caucasian Larynx 269 216 Associated
[Jourenkova, 1998 #88] French Larynx 129 172 Not associated Per se, but interacts with GSTM1
(Jourenkova-Mironova et al. 1999b) Frecnh Larynx 129 172 Not associated per se, but interacts with GSTT
(Lemos et al. 1999) Portugese Leukemia (mixed) 64 128 Not associated
(Nair et al. 1999) Indian Leukoplakia 98 82 Associated,
(Alexandrie et al. 1994) Swedish Lung 296 329 Not associated
(Belogubova et al. 2000) Russian Lung 58 297 No
(Bennett et al. 1999) USA Mixed Lung 106 Smoking, interacts with GSTM1 null hebotype
(Brockmoller et al. 1993) German Lung 117 200 Not associated
(Chen et al. 2001) Chinese Lung 106 106 Combined risk with CYP1A1 Val allele
(Dresler et al. 2000) USA mixed Lung 180 163 Combined risk with CYPA1 for females
(El-Zein et al. 1997) USA Caucasian Lung 52 48 Associated
(Ford et al. 2000) USA Black Lung 117 120 Associated, interacts with smoking
(Gao and Zhang 1999) Chinese Lung 59 132 Associated
(Hirvonen et al. 1993) Finn Lung 138 142 Associated
(Hou et al. 2000) Norwegian Lung 282 357 Associated, interacts with NAT2
(Kelsey et al. 1997b) US Mixed Lung 168 278 No association
Reference Population Cancer # of cases # of controls Comments
(Kihara and Noda 1995b) Japanese Lung 447 469 Associated, interacts with smoking
(Kihara and Noda 1995a) Japanese Lung 118 301 Associated, interacts with smoking, and CYP1A1
(Kihara and Noda 1999) Japanese Lung 382 257 Associated, interacts with GSTP1 and smoking
(Lan et al. 2000) China Lung 122 122 Associated, interacts with smoky coal
(London et al. 1995) USA mixed Lung 342 716 Not associated
(Moreira et al. 1996) Portugese Lung 98 84 Not associated
(Persson et al. 1999) Chinese Lung 76 122 Not associated
(Ryberg et al. 1997) Norwegian Lung 63 177 Associated
(Saarikoski et al. 1998) Finn Lung 208 294 Not associated Per se, interacts with GSTM1
(Stucker et al. 2000) French Lung 247 254 Associated, interacts with CYP1A1
(To-Figueras et al. 1996) Spanish Lung 139 147 Associated, interacts with TP53
(Woodson et al. 1999) USA mixed Lung 319 333 No association
(Xue et al. 2001) Chinese Lung 112 112 Associated, interacts with CYP1A1
(Baranov et al. 1996) Russian Lung, 58 67 Associated
(Deakin et al. 1996) UK Caucasian Lung, 108 577 Not associated
(Davies et al. 2000) USA Caucasian MDS 232 153 Associated
(Heagerty et al. 1994) UK Caucasian Melanoma 64 153 Not associated
(Lafuente et al. 1995) Spanish Melanoma 183 147 Associated
(Shanley et al. 1995) Australia Melanoma 124 100 Not associated
(Kanetsky et al. 2001) USA Caucasian Melanoma 362 271 Not associated Per se, but interacts with hair color
(Elexpuru-Camiruaga et al. 1995) UK Caucasian Meningioma 49 577 Not associated
(Hirvonen et al. 1995) Finn Mesothelioma 44 270 Associated, interacts with smoking
(Deakin et al. 1996) UK Caucasian Oral 40 577 Not associated
(Hung et al. 1997) Taiwanese Oral 41 123 Associated, interacts with GSTT1
(Katoh et al. 1999) Japaneese Oral 92 147 Associated
(Kietthubthew et al. 2001) Thailand Oral 53 53 Assocaited, interacts with smoking
(Park et al. 2000a) US Black Oral 63 103 Associated, interacts with smokiing
(Baxter et al. 2001) Australia Ovarian 293 219 Associated
(Lallas et al. 2000) US mixed Ovarian 80 80 Not associated
(Sarhanis et al. 1996) UK Caucasian Ovary 84 312 Not associated
(Spurdle et al. 2001) Australian Ovary 285 299 Associated with endometrois, and clear cell Ca
(Liu et al. 2000) Canada (mixed) Pancreas 149 149 Not assocaited
Reference Population Cancer # of cases # of controls Comments
(Fryer et al. 1993) UK Caucasian Pituitary adenoma 113 89 Associated
(Autrup et al. 1999) Danish Prostate 153 288 Associated
(Gsur et al. 2001) Austira Prostate 166 166 Not associated
(Kelada et al. 2000) USA mixed Prostate 276 499 Not associated
(Kote-Jarai et al. 2001) UK Mixed Prostate 275 280 Not associated
(Murata et al. 2001) Japanese Prostate 126 126 Not associated
(Rebbeck et al. 1999) US Mixed Prostate 237 239 Not associated
(Bruning et al. 1997) German RCC 45 48 Associated
(Longuemaux et al. 1999) French RCC 173 211 Not associated Per se, but interacts with GSTP1 and NAT2
(Sweeney et al. 2000) US Mixed RCC 130 505 No association
(Heagerty et al. 1994) UK Caucasian SCC 85 153 Not associated
(Setiawan et al. 2000) Chinese Stoamch 91 429 Not associated
(Kato et al. 1996) Japanese Stomach 82 151 Not associated
(Saadat and Saadat 2001) Iranian Stomach 46 131 Associated, interacts with GSTT1
(Deakin et al. 1996) UK Caucasian Stomach, 136 577 Not associated
Table 5. Case control studies on the association of GSTP1 Ile105Val polymorphism and cancer
Reference Population Cancer # of cases # of controls Comments
(Marshall et al. 2000a) UK Mixed BCC 112 112 Val/Val is associated
(Harries et al. 1997) UK mixed Bladder 76 155 Not associated
(Steinhoff et al. 2000) German Bladder 135 127 Not associated
(Curran et al. 2000) Australian Breast 129 129 Not associated
(Helzlsouer et al. 1998) US mixed Breast 110 133 Val allele is associated, and interacts with GSTM1
(Krajinovic et al. 2001) French-Canadian Breast 149 207 Not associated
(Lavigne et al. 1997) US Mixed Breast 112 112 Not associated
(Maugard et al. 2001) French Breast 220 196 Ile allele is associated
(Millikan et al. 2000) US mixed Breast 688 561 Not associated
(Mitrunen et al. 2001) Finn Breast 483 482 Not associated Per se, but interacts with GSTT1, GSTM1
(Harris et al. 1998) Australian Colon 131 199 Not associated
(Katoh et al. 1999) Japanese Colon 47 122 Not associated
(Welfare et al. 1999) UK Mixed Colon 178 178 Not associated
(Yoshioka et al. 1999) Japanese Colon 106 100 Not associated Per se, but interacts with GSTM1
(Tan et al. 2000) Chinese Esopahgus 150 146 Not associated
(van Lieshout et al. 1999) Holland Esopahgus 98 247 Val/Val is associated
(Lee et al. 2000) Taiwanese Esophagus 90 254 Ile/Ile is associated, and interacts with smoking
(Lin et al. 1998b) Chinese Esophagus 45 45 Not associated
(Morita et al. 1999) Japanese Head and neck 145 164 Ile/Ile is associated
(Olshan et al. 2000) US mixed Head and Neck 182 202 Not associated
(Jourenkova-Mironova et al. 1999b) French Larynx 129 172 Not associated
(Harris et al. 1998) Australian Lung 184 199 Not associated
(Katoh et al. 1999) Japanese Lung 382 257 Not associated
(Kihara and Noda 1999) Japanese Lung 382 257 Not associated Per se, but interacts with GSTM1
(Ryberg et al. 1997) Norwegian Lung 135 342 Associated, interacts with GSTM1
(Saarikoski et al. 1998) Finn Lung 208 294 Not associated
(To-Figueras et al. 1999) Spanish Lung 164 200 Not associated
Reference Population Cancer # of cases # of controls Comments
(Matthias et al. 1998) German Oral/Pharynx 380 180 Val/Val is associated
(Spurdle et al. 2001) Australian Ovary 285 299 Not associated
(Jourenkova-Mironova et al. 1999a) French Pharynx 121 172 Not associated
(Autrup et al. 1999) Danish Prostate 153 288 Not associated
(Gsur et al. 2001) Austrian Prostate 166 166 Ile/Ile is associated
(Harries et al. 1997) UK mixed Prostate 36 155 Val/Val is associated
(Kote-Jarai et al. 2001) UK Mixed Prostate 275 280 Not associated
[Wadelius, 1999 #66] Swede, Dane Prostate 425 425 Not associated
(Longuemaux et al. 1999) French RCC 173 211 Val allele is associated and interacts with GSTM1
(Sweeney et al. 2000) US Mixed RCC 130 505 Not associated
(Katoh et al. 1999) Japanese Stomach Not associated
(Harries et al. 1997) UK mixed Testis Not associated
Table 6. Case control studies on the association of GSTT1 null genotype and cancer
Reference Population Cancer # of cases # of controls Comments
(Infante-Rivard et al. 1999) French-Canadian ALL 491 491 Not associated
(Krajinovic et al. 1999) French –Canadian ALL 177 304 Not associated
(Crump et al. 2000) US Mixed AML 297 152 Not associated
(Chen et al. 1996a) USA mixed Anal cancer 71 360 Not associated
(Elexpuru-Camiruaga et al. 1995) UK Caucasian Astrocytoma 109 577 Associated
(van Lieshout et al. 1999) Holland Barret’s esopahgus 98 247 Not associated
(Heagerty et al. 1996) UK Caucasian BCC 699 561 Not associated
(Marshall et al. 2000a) UK Mixed BCC 112 112 Not associated
(Yengi et al. 1996) UK BCC 286 300 Not associated
(Brockmoller et al. 1996a) German Bladder 374 373 Not associated
(Georgiou et al. 2000) Greek Bladder 89 147 Not associated
(Katoh et al. 1998) Japanese Bladder 145 145 Not associated, but interacts with GSTM1
(Kempkes et al. 1996) German Bladder 113 170 Not associated, but interacts with smoking
(Kim et al. 2000b) Korea Bladder 121 222 Not associated
(Salagovic et al. 1999) Slovakian Bladder 76 248 Associated, interacts with GSTM1, and smoking1
(Schnakenberg et al. 2000b) German Bladder 157 223 Not associated
(Steinhoff et al. 2000) German Bladder 135 127 Not associated
(Bailey et al. 1998) US Mixed Breast 263 263 Not associated
(Charrier et al. 1999) French Breast 361 437 Association with postmenopausal risk
(Curran et al. 2000) Australian Breast 129 129 Not associated
(Helzlsouer et al. 1998) US mixed Breast 110 133 Not associated
(Millikan et al. 2000) US mixed Breast 688 561 Not associated
(Mitrunen et al. 2001) Finn Breast 483 482 Not associated
(Park et al. 1997) Korea Breast 189 189 Associated, interacts with GSTM1
(Goodman et al. 2001) USA Hawai Cervix 131 180 Not associated
(Kim et al. 2000a) Korean Cervix 181 181 Associated, interacts with GSTM1
(Warwick et al. 1994) UK Cervix 175 180 Associated
Reference Population Cancer # of cases # of controls Comments
(Butler et al. 2001) Australian Colon 219 200 Not associated
(Chenevix-Trench et al. 1995) Australia Colon 132 100 Not associated
(Deakin et al. 1996) UK Caucasian Colon 252 577 Associated
(Gertig et al. 1998) USA mixed Colon 212 221 Not associated
(Guo et al. 1996) Chinese Colon 19 23 Associated
(Inoue et al. 2001) Japanese Colon 205 220 Not associated
(Katoh et al. 1996) Japanese Colon 103 126 Associated
(Saadat and Saadat 2001) Iranian Colon 42 131 Not associated Per se, interacts with GSTM1
(Welfare et al. 1999) UK Colon 178 178 No association
(Zhang et al. 1999) Swedish Colon 99 109 Associated
(Esteller et al. 1997) Spanish Endometrium 80 60 Not associated
(Tan et al. 2000) Chinese Esopahgus 150 146 No association
(Lin et al. 1998a) China Esophagus 45 45 Associated, interacts with GSTM1
(Katoh et al. 1996) Japanese Gastric 139 126 Associated
(Wiencke et al. 1997) US Caucasian Glioma 188 166 Associated with oligodendroglioma
(Omer et al. 2001) Sudan HCC 110 189 Associated, interacts with peanut butter
(Yu et al. 1995a) Taiwan HCC 30 150 Not associated
(Cheng et al. 1999) US Mixed Head and Neck 162 315 Associated ,interacts with GSTM1
(Ko et al. 2001) German Head and Neck Not associated
(Matthias et al. 1999a) German Head and Neck 398 216 Not associated
(McWilliams et al. 1995) US mixed Head and Neck 160 114 Not associated
(Olshan et al. 2000) US mixed Head and Neck 182 202 Not associated Per se, but interacts with smoking
(Trizna et al. 1995) USA Head and Neck 186 42 Not associated
(Hong et al. 2000b) Korea Larynx 82 63 Not associated Per se, but interacts with GSTM1
(Jahnke et al. 1996) UK Caucasian Larynx 269 216 Associated
(Jourenkova et al. 1998) French Larynx 129 172 Not associated Per se, but interacts with GSTM1
(Jourenkova-Mironova et al. 1999b) Frecnh Larynx 129 172 Not associated per se, but interacts with GSTT
(Nair et al. 1999) Indian Leukoplakia 98 82 Associated
(Bennett et al. 1999) USA Mixed Lung 106 Not associated
(El-Zein et al. 1997) USA Caucasian Lung 52 48 Associated
(Kelsey et al. 1997a) US Mixed Lung 168 278 Not associated
(Kihara and Noda 1994) Japanese Lung 178 201 Associated, interacts with smoking
Reference Population Cancer # of cases # of controls Comments
(Saarikoski et al. 1998) Finn Lung 208 294 Not associated Per se, interacts with GSTM1
(To-Figueras et al. 1996) Spanish Lung 139 147 Not associated
(Xue et al. 2001) Chinese Lung 112 112 Associated, interacts with CYP1A1
(Deakin et al. 1996) UK Caucasian Lung, 108 577 Not associated
(Chen et al. 1996b) US Mixed MDS 96 201 Associated
(Davies et al. 2001) USA Caucasian MDS 232 153 Not associated
(Kanetsky et al. 2001) USA Caucasian Melanoma 362 271 Not associated Per se, but interacts with hair color
(Shanley et al. 1995) Australia Melanoma 124 100 Not associated
(Elexpuru-Camiruaga et al. 1995) UK Caucasian Meningioma 49 577 Associated
(Deakin et al. 1996) UK Caucasian Oral 40 577 Not associated
(Hung et al. 1997) Taiwanese Oral 41 123 Associated, interacts with GSTM1
(Katoh et al. 1999) Japaneese Oral 92 147 Not associated
(Kietthubthew et al. 2001) Thailand Oral 53 53 Not associated
(Sarhanis et al. 1996) UK Caucasian Ovary 84 312 Not associated
(Spurdle et al. 2001) Australian Ovary 285 299 Not associated
(Liu et al. 2000) Canada (mixed) Pancreas 149 149 Not associated
(Jourenkova-Mironova et al. 1999a) French Pharynx 121 172 Associated
(Autrup et al. 1999) Danish Prostate 153 288 Not associated, but interacts with GSTM1
(Gsur et al. 2001) Austira Prostate 166 166 Not associated
(Kelada et al. 2000) USA mixed Prostate 276 499 Associated, interacts with smoking
(Kote-Jarai et al. 2001) UK Mixed Prostate 275 280 Not associated
(Murata et al. 2001) Japanese Prostate 126 126 Not associated
(Rebbeck et al. 1999) US Mixed Prostate 237 239 Associated
(Bruning et al. 1997) German RCC 45 48 Associated
(Longuemaux et al. 1999) French RCC 173 211 Not associated Per se, but interacts with GSTP1 and NAT2
(Sweeney et al. 2000) US Mixed RCC 130 505 Associated
(Setiawan et al. 2000) Chinese Stoamch 91 429 Associated
(Kato et al. 1996) Japanese Stomach 82 151 Not associated
(Saadat and Saadat 2001) Iranian Stomach 46 131 Associated, interacts with GSTM1
1.2.2.2.3 TP53 gene
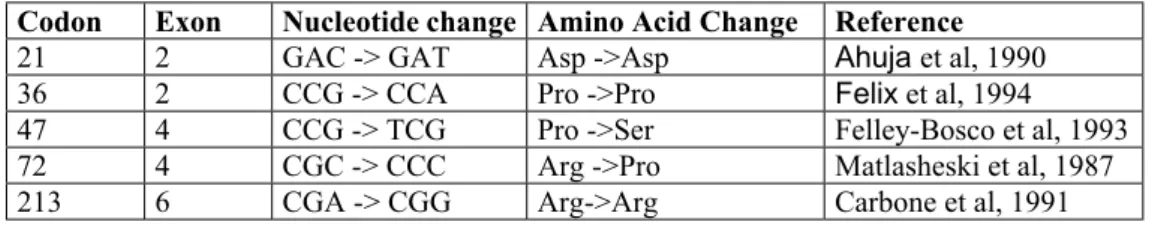
TP53 is an tumor supressor gene that has been mutated in 50% of all human cancers. It involves the in the cellular functions which are highly related with cancer such as cell cycle regulation, DNA repair, apoptosis and senescence. In addition to mutations, some polymorphisms exist in the coding region of the gene. These polymorphisms are located in codon 21, codon 36, codon 47, codon 72 and codon 213 of the gene. The polymophisms at codon 21, codon 36, and codon 213 gene does not result in an aminoacid change, where as nuclotide change at codon 47 results in Pro-Ser, and at codon 72 results in Arg-Pro change (Table 7)
Table 7. Major exonic polymorphisms of TP53 gene
Codon Exon Nucleotide change Amino Acid Change Reference 21 2 GAC -> GAT Asp ->Asp Ahuja et al, 1990 36 2 CCG -> CCA Pro ->Pro Felix et al, 1994 47 4 CCG -> TCG Pro ->Ser Felley-Bosco et al, 1993 72 4 CGC -> CCC Arg ->Pro Matlasheski et al, 1987 213 6 CGA -> CGG Arg->Arg Carbone et al, 1991
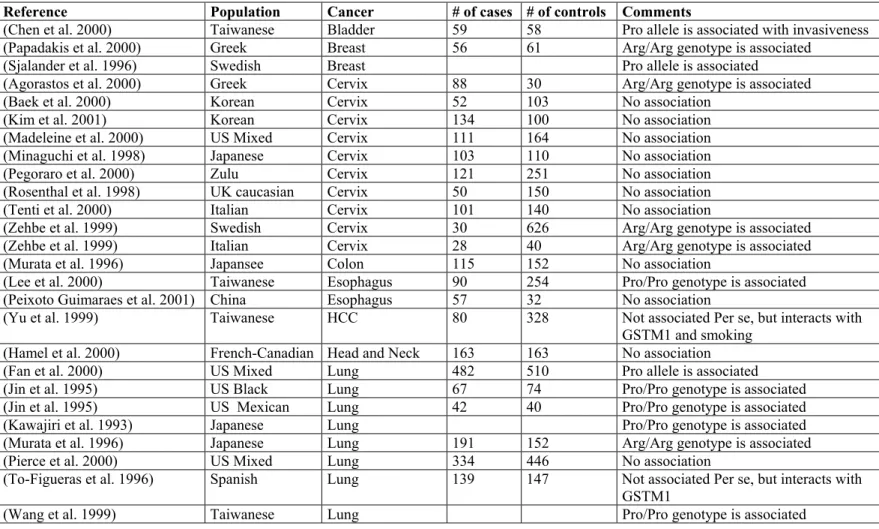
The most interesting polymorphism of the TP 53 gene is Arg72Pro polymorphism. It has been known since 1987 (Matlashewski et al. 1987), however its significance as a genetic susceptibility factor for cancer is still a matter of controversy. The association studies on various cancers reveal quite discordant results (see Table 8). The biological consequences of the polymorphism is not clear either. The current models for the biological relevance are as follows: 1. P53 protein encoded by Arg allele is more likely to degraded by a ubiquitin dependent mechanism upon the combination of E6 protein of Human Papilloma Virus (HPV). This model is used for the explanation of the observed susceptibility due to Arg alele in HPV associated cancers, particularly cervix cancer. The other model differences
the between Arg and Pro forms of the p53 protein in binding to p73 protein, and neutrolize p73 induced apoptosis. Arg form binds stronger (Marin et al. 2000)
Table 8. Case control studies on the association of TP53 Arg72Pro polymorphism and cancer
Reference Population Cancer # of cases # of controls Comments
(Chen et al. 2000) Taiwanese Bladder 59 58 Pro allele is associated with invasiveness
(Papadakis et al. 2000) Greek Breast 56 61 Arg/Arg genotype is associated
(Sjalander et al. 1996) Swedish Breast Pro allele is associated
(Agorastos et al. 2000) Greek Cervix 88 30 Arg/Arg genotype is associated
(Baek et al. 2000) Korean Cervix 52 103 No association
(Kim et al. 2001) Korean Cervix 134 100 No association
(Madeleine et al. 2000) US Mixed Cervix 111 164 No association
(Minaguchi et al. 1998) Japanese Cervix 103 110 No association
(Pegoraro et al. 2000) Zulu Cervix 121 251 No association
(Rosenthal et al. 1998) UK caucasian Cervix 50 150 No association
(Tenti et al. 2000) Italian Cervix 101 140 No association
(Zehbe et al. 1999) Swedish Cervix 30 626 Arg/Arg genotype is associated
(Zehbe et al. 1999) Italian Cervix 28 40 Arg/Arg genotype is associated
(Murata et al. 1996) Japansee Colon 115 152 No association
(Lee et al. 2000) Taiwanese Esophagus 90 254 Pro/Pro genotype is associated
(Peixoto Guimaraes et al. 2001) China Esophagus 57 32 No association
(Yu et al. 1999) Taiwanese HCC 80 328 Not associated Per se, but interacts with
GSTM1 and smoking
(Hamel et al. 2000) French-Canadian Head and Neck 163 163 No association
(Fan et al. 2000) US Mixed Lung 482 510 Pro allele is associated
(Jin et al. 1995) US Black Lung 67 74 Pro/Pro genotype is associated
(Jin et al. 1995) US Mexican Lung 42 40 Pro/Pro genotype is associated
(Kawajiri et al. 1993) Japanese Lung Pro/Pro genotype is associated
(Murata et al. 1996) Japanese Lung 191 152 Arg/Arg genotype is associated
(Pierce et al. 2000) US Mixed Lung 334 446 No association
(To-Figueras et al. 1996) Spanish Lung 139 147 Not associated Per se, but interacts with
GSTM1
Reference Population Cancer # of cases # of controls Comments
(Weston et al. 1994) US Mixed Lung 31 39 No association
(Birgander et al. 1996) Chinese Nasopahrynx 73 105 Pro allele is associated
(Golovleva et al. 1997) Chinese Nasopharynx 64 99 Pro/Pro genotype is associated, and
interacts with IFNA17 gene
(Summersgill et al. 2000) US Mixed Oral 202 303 No association
(Tandle et al. 2001) Indian Oral 72 153 No association
(Rosenthal et al. 1998) UK caucasian Ovarian 96 150 No association
(Wu et al. 1995) Japanese Prostate 33 56 No association
(Wu et al. 1995) Japanese Renal 85 56 No association
(Bastiaens et al. 2001) Holland Skin SCC 86 168 No association
(Marshall et al. 2000b) UK mixed Skin SCC 55 177 No association
(O'Connor et al. 2001) Irish Skin SCC 55 115 No association
(Wu et al. 1995) Japanese Testicular 28 56 No association
(Wu et al. 1995) Japanese Urothelial 151 56 No association
1.3 Bladder Cancer 1.3.1 Clinical Information 1.3.1.1 Epidemiology and Etiology
Bladder cancer is the first cancer that an association between environmetal risk factors and the incidence of cancer has been demonstrated. As early as in 1985 Dr. Ludwig Rehn reported on bladder cancer patients who manufactured anniline dyes (Johansson and Cohen, 1997). Although the main cause of bladder cancer is cigarette smoking throughout the world, local conditions also play a role. In the developed countries such as United states, occupational exposure is responsible for 25% of cases. Schistomasis plays an important role in Egypt, Balkan nephropathy is associated with bladder cancer in former Yugoslavia and Bulgaria, and arsenic in drinking water is an important factor in Argentina, Chile and Taiwan. Age, sex and the race is also an important risk determinant. Bladder cancer is more common in males, old persons (more than 55), and Caucasians than females, young persons (less than 55), and Blacks (Johansson and Cohen, 1997).
Bladder cancer is the 3rd most common cancer in males, and the 8th most common cancer in females in the Turkish population (Özsarı and Atasver 1997). These observations are smilar to European Union countries particularly Greece, Italy and Spain (Black et al, 1997). The main etiological agent in Turkey is cigarette smoking (Akdas et al, 1990; Fidaner et al, 2001).
1.3.1.2 Pathology
95 % of bladder cancers are transitional cell carcinoma of the bladder. Squamous cell carcinoma constitutes about remaining 4%. The other rare histological forms are adenocarcinoma, and undifferentiatd carcinoma
The stage is defined as the estimation of extent (size and location) of the cancer at the current time. More specifically, how extensive is the cancer within the bladder and if it has spread to tissues around the bladder, or to other parts of the body. Currently two staging systems are used one is Marshall-Jewett- Strong, which has been developed by Jewett and Strong in 1946, and modified in 1952
the other is TNM system (Tumor, Lymph node, and Metastasis) which has been developed by Union Internationale Contre Le Cancer (UICC). TNM staging is shown in Table 9. In daily paractice, tumors are also classified as superfical and invasive. Superficial tumors are the tumors which did not invade the muscularis propria (i.e lower tha n T2). The patients with superfial tumors has a better prognosis compared to the patiens with invasive tumors.(Lapham et al, 1997).
The tumor grading is based on anaplasia. Grade 1 tumors show mild cytological atypia and rare mitosis; Grade 2 tumors show moderate cytological atypia and the presence of mitotic figures; Grade 3 tumors show severe cytological atypia and frequent mitotic figures.
Table 9. TNM staging of Bladder Cancer Primary Tumor
TX Primary tumor can not be assesed T0 No evidence of primary tumor Tis Carcinoma in situ
Ta Papillary non-invasive carcinoma T1 Tumor invades subepithelial tissue T2 Tumor invades superficial muscle T3 Tumor invades deep muscle T4 Tumor invades adjacent organs Regional Lymph Nodes (N)
NX Regional lymph nodes can not be assesed N0 No regional lymph node metastasis
N1 Metastasis in a single lymph node, less than 2cm. N2 Metastasis in a single lymph node, more than
2cm, but less than 5cm or multiple lymphnodes N3 Metastasis in a single lymph node, more than 5cm Distant metastasis
MX Metastasis can not be assesed. M0 No distant metastasis
M1 Distant metastasis
1.3.2 Genetic predispositon to bladder cancer
The genetic factors have an influence on the risk factor. Broadly speaking there are two patterns of inheritance of bladder cancer. One is the very rare Mendellian pattern, the other is the multifactorial (polygenic) pattern of inheritance. The Mendellian form of bladder cancer has been reported alone (Fraumeni and B. 1967; Capps et al. 1968) or along with other cancers as a syndromic fashion (McCullough et al. 1975; Chan and Pratt 1977; Nagane et al. 1996). No specific gene has been identified yet. Althouhg in a family, a germ line translocation has been reported (Schoenberg et al. 1996), this observation coul not be in larger studies (Aben et al. 2001). Large epidemiological studies have shown that, the first degree relatives appear to have an increased risk for bladder cancer by a factor of 2 compared to general population (Kiemeney and Schoenberg 1996; Dong and
Hemminki 2001) and the interaction of the familial and environmental risk factors have been demonstrated by epidemiological studies(Kunze et al. 1992). The current paradigm is that primarily bladder cancer is a multifactorial disease, in which environmental and genetic factors interact in the predispositon. The association studies between genetic polymorphism and bladder cancer usually points out an association between GSTM1 and NAT2 locus, and bladder cancer. The cytochrome p450 enzyme and H-Ras polymoprphisms does not seem to be risk factor. The polymorphisms of GSTP1, XRRC1, TP53 are emerging hot topics because of initial observed assocaitions (Table 10).