The spillover effects of tourism receipts, political risk, real exchange rate, and
trade indicators in Turkey
Uju Violet Alola
1, Serdar Cop
1, Andrew Adewale Alola
2Abstract
In examining the spillover effects of tourism receipts and the uncertainty-induced factors in Turkey, this study examines the spillover effects of tourism receipts and related sources of uncertainties from trade and political-related factors. Using the novelty of Diebold and Yilmaz (2012) “Better to give than to receive: Predictive directional measurement of volatility spillovers” approach, the study reveals that tourism receipts have a net spillover of 4.1%, thus indicating that the country’s tourism industry received a significant shock. Spillover effects from other variables are observed, thus suggesting a hedging policy mechanism for the country’s tourism sector.
Keyword: Spillover effect; uncertainty; tourism receipts; trade; geopolitical risk; real exchange rate; Republic of Turkey.
1. Introduction
The globalization of the service industries, especially the development of the tourism industry cannot be separated form the economy transitions experienced in most service-based economies across the globe. Hence, the (dynamic) effect of tourism development and of the service industries on the entire economy of a state, is capable of generating spillover effects (Kouchi,
1
Department of Tourism Guidance, Istanbul Gelisim University, Istanbul, Turkey
1
Faculty of Economics, Administration and Social Science, Istanbul Gelisim University, Istanbul, Turkey
2 Correspondence - Andrew Adewale Alola, Faculty of Economics, Administration and Social Science, Istanbul
Nezhad & Kiani, 2018). In essence, as much as there exist individualized state interests across global economies, trade partnership and networking has continued to strengthen the global economy prospect (Esposti & Listorti, 2018; Zahonogo, 2018). Indications from the global value chains’ shows that trade in goods and services (crude oil as an example of commodity trading) and (tourism as an example of service) is the core of most global economies (Gereffi, Humphrey & Sturgeon, 2005 Kronenberg, Fuchs & Lexhagen, 2018). In spite of economic turbulence and events of uncertainty across the globe (Abdulkareem, 2018), tourism has relatively experienced uninterrupted growth, thus affirming the industry’s strength and resilience potentials (UNWTO, 2016). The global economic returns and indications in 2018 resulting from (indirect) tourism development which include revenues, employment, skill and human capita development is an indication of economic recovery (World Travel and Tourism Council, WTTC, 2018).
For instance, the WTTC 2019 annual research highlight for Turkey implies that about 48.6 million international tourists are expected to arrive in 2019, thus the industry is expected to indirectly add about three (3) million jobs. In Turkey, the obvious robustness of its tourism sector is not unconnected with the hallmarks of the country’s uncommon geographical landscape and its several natural, historical, archaeological and cultural resources. The about 800, 000 km square in area and strategically located nation is one of Europe and Middle East’s largest countries, thus making Turkey one of the most important travel destinations in the world (Göymen, 2000; Yolal, 2016). However, the modern world tourism market is known to be largely affected by many factors (Dilek & Fennell, 2018; Tohmo, 2018). Some of these factors are characterized by shocks (uncertainty) that target the tourism sector and other economic activities that directly affects consumer decisions, such as changes in disposable income, advertising campaigns, and unexpected factors, such as terrorist attacks (Gozgor & Ongan, 2017;
Balli, Shahzad & Uddin, 2018; Ongan & Gozgor, 2018 Wu & Wu, 2019). Additionally, economic activities in Turkey have recently been threatened by regional tensions, thus increasing the level of uncertainty potentially causing shock to the industry. In recent time, the foiled coup attempt of 15 July 2016 and mounting regional tensions contribute to the unexpected events that are associated with the country. Also, the United States (US)-Turkey trade ‘dispute’ resulting to the sanction on the export of Turkish aluminium to the US is one of the potential shock-induced events. Moreover, an assessment of country risk and sources of economic uncertainties are based on the evaluation of its economic, financial, political factors, thus determining the associated impact of the country’s economic sectors (Hoti, McAleer & Shareef, 2007).
Furthermore, the Turkey’s service industry is vastly increasing and becoming the major driving force of its economy. Indicatively, the country’s exports volume is ranked 30th in the world despite the aforementioned challenges of uncertainties (Central Intelligence Agency, 2019). The country’s major exports which include machinery and transport equipment are delivered to its major trade partners that include Germany, the United Kingdom, US, Russia, Italy, United Arab Emirate, and others (Trading Economics, 2019). In addition to the importance of the trade partners to Turkey, the specific assessment of the exported goods is expected to be vital to the country’s economic performance. For instance, exports in iron and steel metals was reported as the fastest growing by 2018, and followed by the goods made of the same raw materials (World’s Top Export, 2019). The above evidence underlying the imbalances in the Turkish economy resulting from external investment inflow to finance growth has continued to expose the vulnerability of the country’s economy, and especially its tourism sector. Hence, the study of the interdependence of the uncertainty-related source of shock along with tourism performance for Turkey could not be timelier. In specific, the objective of examining the potential spillover
effect associated with export to advance countries or over-dependent on trade partners and tourism development in Turkey posits a good motivation.
On this note, the study is designed to assess the spillover effects of international tourism receipts and return to tourism receipts with related sources of uncertainties vis-à-vis political risk, real exchange rate, trade to high-income economies, and exports in metal for Turkey. Our study is carried out over the period 1983M05-2016M12 and Turkey is considered as a case study because of its robust tourism sector amidst the regional geopolitical tensions. This study is important and timely, considering that the Republic of Turkey was recently embroiled in trade ‘dispute’ with the United States (US) resulting in the loss of about 42 per cent of the value of Turkish Lira (TL) in 2018 (ABC news, 2018; Euro news, 2018; Constantine, Benjamin & Onur 2018). In recent time, the strands of literature have examined the use of a developed VAR–GARCH approach and other dynamic and high frequency estimation methods which allows for transmissions of volatilities in the context of tourism (Webber, 2001; Chan, Lim & McAleer, 2005; Kim & Wong, 2006; Shareef & McAleer, 2005; Chang et al., 2011; Yang & Wong, 2012). Related studies that investigates the connectedness of the tourism sector activities with other factors using a rather non-quantitative approach are currently being illustrated in literature (Croes, Ridderstaat & van Niekerk, 2018; Gössling, Cohen & Hibbert, 2018). However, the current study will potentially galvanize the literature by adding novelty through the following few directions:
By employing the recent approach of the Diebold and Yilmaz (2012) to examine the connectedness of the aforementioned factors especially the related sources of trade and political uncertainties in Turkey, this study is the first of its kind in the context of tourism at least to the authors’ knowledge.
Also, by incorporating the component of export in metals (an ore of metals) and the trade to high-income economies indicators, the study uniquely underpins the connectedness of the aforesaid factors with tourism component. In the midst of this, a variable that proxy the regional and political risk (geopolitical risk) is also considered. Such an investigation would potentially suggest effective policy pathway toward understanding the linkage and unexpected volatilities especially in the event of uncertainty. For instance, the recent trade sanction on Turkish Aluminum by the US erupted in economic instability as evident in the drastic fall in the Turkish currency. Whereas, previous studies have mainly linked tourism with variables such as the Gross Domestic Product (GDP) or income, the exchange rates, the Consumer Price Index (CPI), cost of transportation, insecurity or crime rates, weather conditions, and population size in predicting tourism performance (Katircioglu, Feridun & Kilinc, 2014; Dogan, Seker & Bulbul, 2017).
In addition, returns to tourism receipts are incorporated to examine the interdependence of the political risk, real exchange rate, trade to high-income economies, and exports in metal for Turkey with return on income from tourism activities in the country. In the past, Kulendran and Dwyer (2009) rather examined the return per dollar invested in Asia using the cost-effectiveness analysis and a dynamic modelling approach.
The rest of the sections are in part. The next section 2 contains a synopsis of the previous study. In section 3, the data description and methodology are presented while the results are discussed in section 4. Section 5 offers concluding remarks that include policy implication of the study and proposal for future study.
2. Tourism and uncertainty-induced factors
Within the context of tourism, the degree of uncertainty in the economy is observed to have significant impact on the development of tourism industry especially in tourist destinations. Specifically, Gozgor and Ongan (2017) and Ongan and Gozgor (2018) are among the recent studies that have examined the impact of economic policy uncertainty on tourism arrival of a destination, the United States. In their study, Gozgor and Ongan (2017) noted that the economic policy uncertainty have a significant and negative impact in tourism spending in a long-run. Similarly, Ongan and Gozgor (2018) examined the possibility of economic policy uncertainty having an impact on the Japanese tourist that arrived in the United States over the period 1996Q1–2015Q1. Moreover, the study presents that a unit increase in the economy policy uncertainty index will cause a significant decrease of 4.7% in the number of Japanese tourists arriving to the United States. Hence, the studies produced the expected (negative) impact on tourism development especially considering that the increase in uncertainties expectedly reduces economic activities including the activities in the tourism industry.
Also, in a recent study that is similar to that of Gozgor and Ongan (2017) and Ongan and Gozgor (2018), Balli, Shahzad and Uddin (2018) employed a different methodological approach to examine the impact of economic policy uncertainties on tourism demand. In this case, Balli, Shahzad and Uddin (2018) employed the global economic policy uncertainties which proxy for the levels of uncertainties as applied to many countries. Also, the study employed the tourism arrivals as the dependent variable by using the multiple and partial wavelength analysis and observed a significant variance in the impact of uncertainty on tourism arrivals in different periods. The study revealed that the expected impact of uncertainty on tourism arrivals is peaked
during the during the sub-periods associated with high level of uncertainty like the Global Financial Crisis (GFC) and the September 2011 terrorist attack on the US events. By also employing the domestic economic policy uncertainty for the purpose of comparison, the study importantly observed that both global and domestic economic policy uncertainties have strong and negative impacts on tourism flows in most of the observed countries. Hence, it further suggests that tourism demand is very sensitive to the degree of uncertainty in destination countries.
Moreover, the empirical discussion has been centred on the causes of uncertainties arising from political violence, insecurity or tension and tourism development (Neumayer, 2004; Ivanov, et al., 2017; Lanouar & Goaied, 2019). In their studies, Ivanov, et al. (2017) and Lanouar and Goaied (2019) respectively examined the role of political violence or instability in the development of the tourism industry in Ukraine and Tunisia respectively. Specifically, Ivanov et al. (2017) induced from the survey of 102 hotel managers and 73 travel agency managers that the existing hypothesis of a negative relationship between political instability and tourism development holds for Ukraine. The report further maintained that the outcome of the investigation is valid across the country such that political instability is observed to hamper tourism revenues and decrease the numbers of tourists visiting the country. Another perception of risk associated in the tourism industry was recently examined by Aliperti, Rizzi and Frey (2018). Having recognize the importance of the risk associated with disaster, the study examined the effectiveness of two types of Cause-related Marketing (CrM) employed by tourism institutions to improve disaster prevention and recovery of the destination.
Among the existing literature of trade-tourism nexus is the recent work of Shahbaz et al. (2017) which explored the tourism industry of Malaysia. In the study which covers the period
1975-2013, trade openness in Malaysia is empirically observed to exhibit positive (elasticity of 0.19) and negative (elasticity of 0.18) and Sigala (2017) on tourism demands in the long-run and short-run respectively. Similarly, a different perspective from Sigala (2017) investigates the application and implications of collaborative commerce in the advancement of the tourism industry. The study implied that the application of a technologically-induced trade approach to tourism is observed to potentially improve the nature of tourism products and services. Additionally, Cao, Li and Song (2017) used the global vector autoregressive (GVAR) model to evaluate how tourism demand responds to negative shocks to real income and tourism price variableness across 24 major countries. The result of the investigation suggests that there is empirical evidence that such shock is responsible for fluctuations in international tourism demand and tourism prices in the short-run in almost all of the countries.
3. Data and Empirical method 3.1 Data
This study employs the monthly time-series data for Turkey over the period 1985M01-2016M12. The data availability is responsible for the restriction to the experimental period. The investigated variables are described and presented in Table 1.
Table 1: Description of the investigated variables______________________________________
Variables Description, Measurement, and Sources__________
International tourism receipts (receipts) International tourism receipts (% of total exports)3 are expenditures by international inbound visitors, including payments to national carriers for international transport. These receipts include any other prepayment made for goods or services received in the destination country. They also may include receipts from same-day visitors, except when these are important enough to justify separate classification. The World Development Indicators of the World Bank is the source of the data.
Returns on receipts (rreceipts) The return (rt) to the international tourism receipts (receiptst) for time t, such that is computed as
rt = 100 * [𝑓𝑖𝑟𝑠𝑡 𝑑𝑖𝑓𝑓𝑒𝑟𝑒𝑛𝑐𝑒 (𝛥)𝑜𝑓 log (𝑟𝑒𝑐𝑒𝑖𝑝𝑡𝑡)] Real Exchange Rate (rex) The monthly real effective exchange rate is calculated based on manufacturing consumer price index for Turkey. This is measured as Index 2015=100, Not Seasonally Adjusted and retrieved from the Federal Reserve Bank of St. Louis (FRED).
3 Detail information on international tourism receipts can be obtained from the World Development Indicators of the
Metals exports (oremetal) We proxy metal exports with Ores and metals exports (% of merchandise exports)which comprise the commodities in SITC sections 27 (crude fertilizer, and minerals); 28 (metalliferous ores, scrap); and 68 (non-ferrous metals). The World Development Indicators of the World Bank is the source of the data.
Trade to high-income countries (ttotrade) Merchandise exports to high-income economies (% of total merchandise exports) are the sum of merchandise exports from the reporting economy to high-income economies according to the World Bank classification of economies. Data are expressed as a percentage of total merchandise exports by the economy. The World Development Indicators of the World Bank is the source of the data.
Political risk Index (gpr) The GPR index4 (a proxy for political risk) reflects automated text-search results of the electronic archives of 11 national and international newspapers: The Boston Globe, Chicago Tribune, The Daily Telegraph, Financial Times, The Globe and Mail, The Guardian, Los Angeles Times, The New York Times, The Times, The Wall Street Journal, and The Washington Post. Caldara and
4
Further information on the Geopolitical risk index (gpr) by Caldara and Iacoviello can be obtained online at
Iacoviello calculate the index by counting the number of articles related to geopolitical risk in each newspaper for each month (as a share of the total number of news articles). The index is then normalized to average a value of 100 in the 2000-2009 decade. The World Development Indicators of the World Bank is the source of the data.
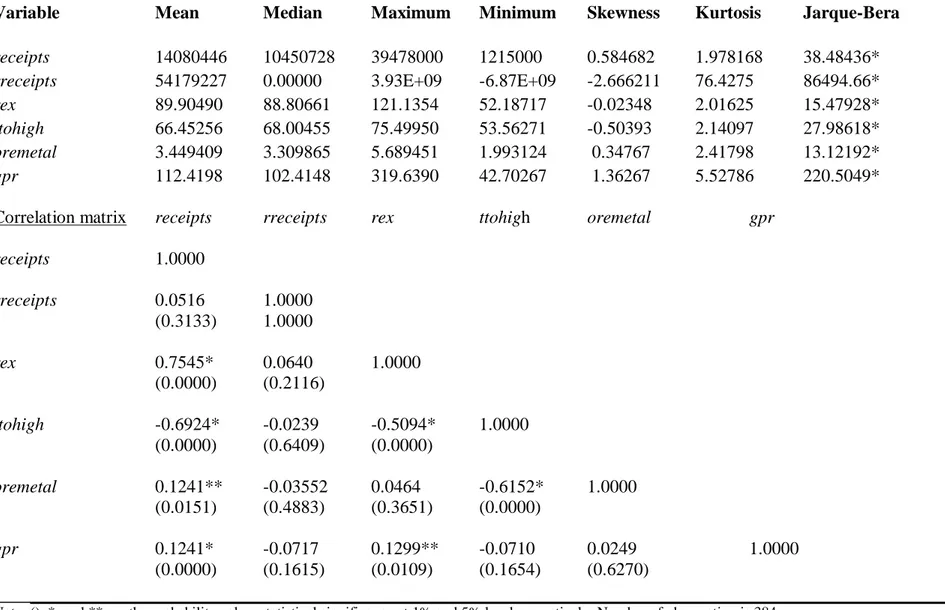
Furthermore, the descriptive statistics and the correlation matrix of the variables are also presented in Table 2, while time series plot of all the variables are presented in Figure 1.
< Insert Tables 2> < Insert Figure 1> 3.2 Empirical method
3.2.1 Dynamic ARDL approach
Considering that the tourism variables are mainly expressed as a function of economic policy uncertainty in the literature (Gozgor & Ongan, 2017; Balli, Shahzad & Uddin, 2018; Ongan & Gozgor, 2018), the current study proceeds by initially examining the dynamic relationship between tourism receipts and the observed sources of uncertainty factors (gpr, ttotrade, oremetal and rex) in Turkey. Hence, in this case the dynamic Autoregressive Distributed lag (ARDL) is employed to the model (equation 1) to investigate the (cointegration) characteristics of the dynamic relationships among the observed variables.
, , ,
receipts f gpr ttotrade oremetal rex (1) However, before proceeding to estimating the dynamic ARDL, it is important to establish the stationarity of the variables. The KPSS is employed to test the stationarity in lieu of other unit root techniques because of it superior estimation advantages and the result shown in Table 2.
<Insert Table 2>
The result of the stationarity test in Table 2 indicates the appropriateness of the dynamic ARDL model, which is also applicable for a situation of mixed order of integration. Also, because the technique adopts the cointegration form as proposed by Pesaran, Shin and Smith (PSS, 2000) and for its flexibility of lag selection for both the regressors and dependent variables, it is then applied to the logarithmic form of model expressed in equation 2.
log
receipts
t
log
gpr
t
log
ttotrade
t
log
oremetal
t
log
rex
t
t (2) For brevity, the estimation is not provided here but the result of the estimation is contained in Table 2.3.2.2 Diebold and Yilmaz (2012) approach
Following the revelation of significant correlation between the estimated variables as shown in Table 1, the stationarity and dynamic relationship evidence of Table 2, the study proceed to examine the spillover effects. The unique technique of Diebold and Yilmaz (2012) which is based on the generalized VAR model and insensitivity to variable ordering is employed in the current study. Through the novel approach, the Total, Directional, Net, and Net Pairwise Spillovers are obtainable. Hence, a covariance stationary VAR (p) is considered
1 1 (0, ) p t i t t i y y
(2)such that the moving average of the covariance stationary process of equation (2) above is
0 1
t i i t
y
A
(3)where yt = (y1t, y2t, …, yNt)' is N x 1 vector of each of tourism receipts, return to tourism receipts,
the political risk, real exchange rate, and trade series, whereas Φ is N x N , ε is the vector of disturbance that are assumed to be independently distributed over time, A (of equation 3) is
assumed to follow the recursion Ai = Φ1 Ai-1 + Φ2 Ai-2 + … + Φp Ai-p , such that A0 is the identity
matrix (of N x N dimension), and Ai = 0 for all i < 0.
In assessing the magnitude of the spillovers across the market indicators, we adopt the conventional VAR framework such that the H-step-ahead forecast error variance contribution is adopted, thus 1 1 ' 2 0 1 ' ' 2 0 ( ) ( ) ( ) H jj i h j g h ij H i h h i h e A e H e A A e
(4)In equation (4) the variance matrix of the error vector is Σ, σjj and is the standard deviation of the error term for variable j, ei is the selection vector with 1 = ith element and 0 = otherwise. Then, the diagonally centralized elements (the own variance shares of shocks to variable yi) is the fraction of the H-step-ahead error variance in forecasting yi, given that i = 1, 2, … N. Also, the off-diagonal are the fractions of the H-step-ahead error variances in forecasting yi that are due to
shocks to yj, given that j = 1, 2, … N and i is not equal j. Again, each entry of the variance decomposition matrix is normalized by taking the row sum to derive the full information such that 1 ( ) ( ) ( ) g ij g ij N g ij j H H H
(5) where ∑𝑁 𝜃𝑖𝑗𝑔(H)𝑗=1 (sum of the contributions to the variance of the forecast error) is not equal to
1, but 1 ( ) 1 N g ij j H
and , 1 ( ) N g ij i j H N
by the construction.In respect to the aforementioned estimations steps, the Total spillover index which specifically quantifies the contribution of shocks among the examined tourism market indicators is provided as
, 1 , 1 , 1 ( ) ( ) ( ) 100 100 ( ) N g N g i j ij i j ij i j i j g N g ij i j H H S H N H
(6)Hence, the Total directional spillover exhibits two indicators: “From other” and “To others”. While the directional spillover index from others is computed as
1 1 1 1 , 1 ( ) ( ) ( ) 100 100 ( ) N N g g ij ij J J j j g i N g ij i J H H S H N H
, (7)the directional spillover index to others is calculated as
1 1 1 1 , 1 ( ) ( ) ( ) 100 100 ( ) N N g g ji ji J J j j g i N g ji i J H H S H N H
(8)Moreover, the difference between the ‘to other’ and ‘from others’ indicators are calculated using
. .
( )
( )
( )
g g g
i i i
S
H
S
H
S
H
(9)So that, the net pairwise directional spillovers is also computed from
,k 1 j,k 1 ( ) ( ) ( ) ( ) ( ) 100 100 ( ) ( ) g g g g ji ij ji ij g ij N N g g ik jk i H H H H S H N H H
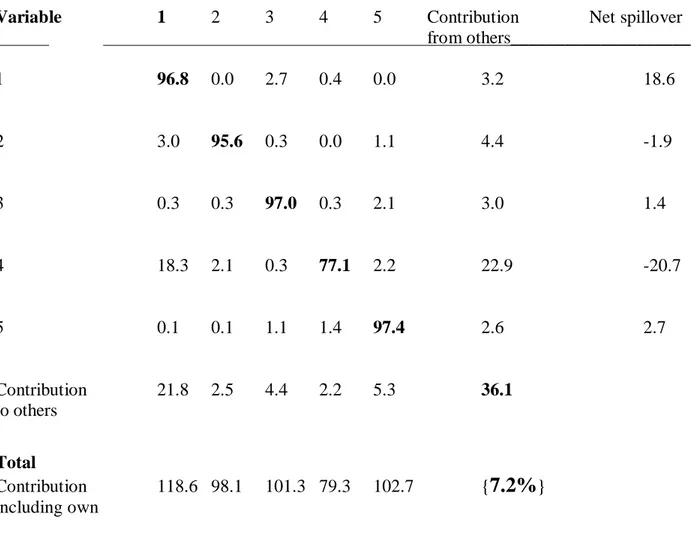
(10)The Diebold and Yilmaz (2012) have extensively been used to examine the inter-market returns and volatility spillovers (Antonakakis & Floros, 2016; Lee & Lee, 2018; Oyewole & Fasanya, 2018). While using the Diebold and Yilmaz (2012) by following the above procedures, the shock spillovers to return to tourism receipts, the political risk, real exchange rate, and trade indicators is examined. As revealed, the Tables 4 and 5 respectively present the level and returns to tourism receipts of spillover indices.
< Insert Tables 4> < Insert Tables 5> 4. Result and discussion
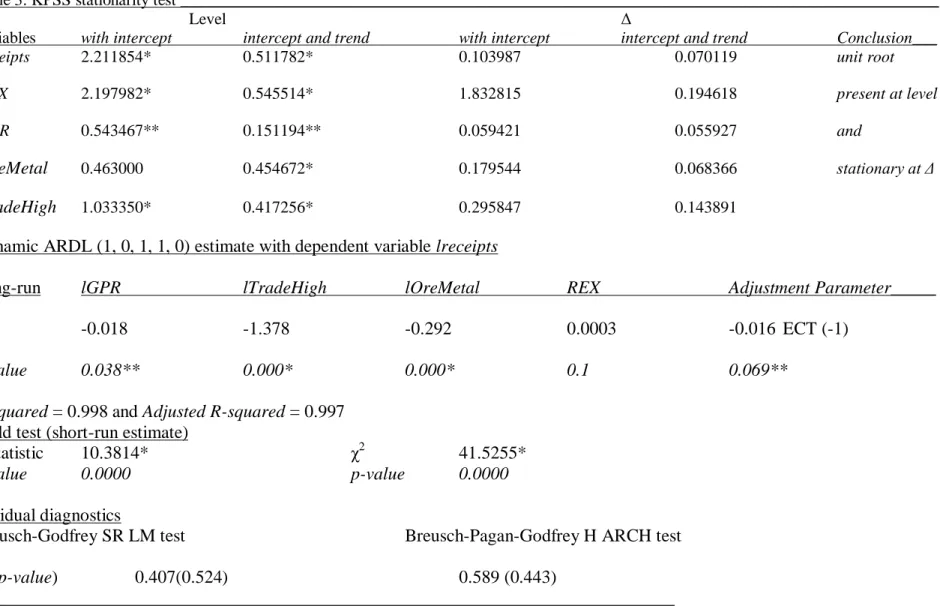
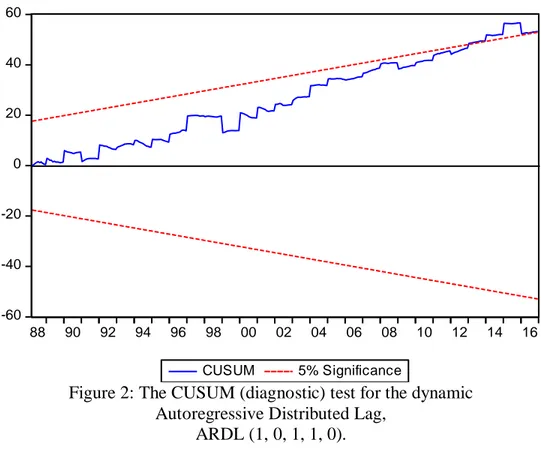
In addition to the presentation of the common statistics and the leptokurtic distribution over the period 1985M01-2016M12, the correlation matrix of the dataset is also presented. From Table 2, statistical evidence shows that the correlation between tourism receipts and other estimated series is significant. An initial estimation using the dynamic ARDL which follows the concept that a measure of economic policy uncertainty impacts (negatively) the tourism receipt is employed (Gozgor & Ongan, 2017; Balli, Shahzad & Uddin, 2018). Also, in this case, it is observed that increases (by 1%) in gpr, ttotrade and oremetal respectively have significant positive impacts on tourism receipts especially in the long-run (see Table 3). Thus, the result confirms a cointegration relationship between the examined variables. Further tests as indicated in Table 3 include the significant Wald test (for short-run), the residual tests show there is no problem of serial correlation (by Breusch-Godfrey LM test) and heteroskedasticity (by Breusch-Godfrey). Evidently, the CUSUM test illustrated in Figure 2 informs of the stability of the estimated (the dynamic ARDL) model.
<Insert Figure 2>
Hence, in examining the connectedness of the investigated variables, we mainly present the total spillover and the spillovers “to” and “from” tourism receipts in respect to the other variables. In Table 4, tourism receipts have own spillover of 91.4%, and this is the fourth largest own spillover after the real exchange rate (rex), trade to high-income countries (ttohigh), and geopolitical risk (gpr). Also, statistical evidence indicates that trade to high-income countries (ttohigh), real exchange rate (rex), export in metal ore (oremetal), and geopolitical risk (gpr)
respectively transmit 3.9%, 2.8%, 0.1%, and 1.8% potential spillovers to tourism receipts. Hence, a total of 8.6% of potential spillover effect could be experienced by the inbound tourists to Turkey. This evidence agrees with the earlier several studies of Gozgor and Ongan (2017), Balli, Shahzad and Uddin (2018), Ongan and Gozgor (2018) and Wu and Wu (2019) that affirms the negative impact of economic policy uncertainty on tourism development. In return, trade to high-income countries, real exchange rate, export in metal ore, and geopolitical risk (gpr) “receive” potential spillovers from the performance of the tourism sector in Turkey. About the net spillovers, the result present that 22.6% (the largest of the net spillovers) of potential spillover is contributed by trade to high-income countries to others. And, rather than contributing a net spillover to others, the trio of tourism receipts, export in metal ore, and geopolitical risk receives net spillovers of 4.1% (-), 21.1(-), and 3.0 (-) from others respectively. Evidently, the bulk of the contribution to others is from trade to high-income economies and with a net spillover of 22.6%. On a general note, the total connectedness of the factors is 8.6% (in the 10th percentile). However, the result presents other statistical indication of inter-connectedness of the series. Performing a further test, the return to tourism receipts is used in lieu of tourism receipts and such the result is presented in Table 5. Also, in this case, the own connectedness received from each other, the net connectedness and total spillover are expressed. But, unlike the result of the earlier estimate, only tourism receipts and export in ore metal receives more connectedness from others than it gives. Similarly, the net spillover (7.2%) in this case is slightly lower than the previous one. Lastly, the result of our study is consistent with extant literature of tourism-political violence (Neumayer, 2004; Ivanov, et al., 2017; Lanouar & Goaied, 2019), tourism demand and price changes (Cao, Li & Song, 2017), and trade-tourism nexus (Shahbaz et al., 2017; Sigala, 2017). The result in Table 5 which employs the returns to tourism receipts
(receipts) further confirms the above implied spillover effects between tourism receipts, trade to high income country, trade in ore and metals, and the exchange rate.
5. Conclusion and Policy Implication
This study reveals that a total of spillover effect (indicating connectedness) of about 8.6% exists among the investigated series for the case of Turkey. Specifically, the tourism development in Turkey which is proxied by tourism receipts is observed to receive spillover effect of 4.1% from the other series. This result is very important, considering that Turkey is a significant tourist destination. Thus it suffices that tourism receipts could potentially receive shock caused by the sudden events and uncertainties pertaining to the exchange rate (rex), trade to high-income countries (ttohigh), export in metal ore (oremetal), and geopolitical risk (gpr). Similar to peculiar nature of the tourism receipts, the country’s export in metal ore (oremetal) and geopolitical risk (gpr) is observed to respectively receive spillover contribution of 21.1 and 3.0 from other factors, thus suggesting that export in metal ore (oremetal) and geopolitical risk are prone to shock from events. Importantly, in the study, trade to high-income economies is a factor that is observed to contribute that largest share of spillover effects (of 22.6%) to other factors. Also, the exchange rate is observed to contribute 5.7% spillover effect to other investigated factors. Hence, considering the recent trade war between Turkey and the U.S., it can be affirmed that the sanction on the trade in Aluminum and steel was well-calculated. Therefore, our study opined that the immediate impact of trade sanction on the export of Turkish Aluminum and steel to the U.S. (high-income economy) is expected to be severe as experienced, thus cutting across another sector of the economy especially the tourism industry and the financial institution.
Considering the evidence of both cointegration and spillover effect between tourism, political, and trade indicators in Turkey, this study potentially offers insightful policy thoughts for the
country. It is obvious that the effective implementation of the policy instrument will be vital to the mitigation of harsh and undesirable economic circumstances resulting from economic and financial instability. Hence, a swift response from the country’s stakeholders in the tourism industry, on trade and government institutions is expectedly important. Specifically, trade diversification policy could be effectively employed such that sees Turkey lobbying new trade opportunities. Over dependent on a trade partner as related to the exportation of specific goods could be discouraged. This is because a shock on such trade agreement is a shock on potential shock on Turkey’s economy and especially its tourism industry. As such, the recent trade ‘dispute’ between the U.S. and Turkey is a signal to Turkey that the time to seek for multiple trade partners for its key product like steel and metals, aluminium and others is expedient. Since real exchange rate and geopolitical risk are a potential contributor of a shock to the country’s tourism industry (see Table 4), effective policy direction is crucial in this context. For instance, the country’s financial regulatory authority should adopt an exchange rate policy that is less prone to external shocks caused by regional tension. And, as observed from our result, the direct engagement of the Turkish government in regional political crises poses a detrimental effect on its tourism industry. Thus, Turkish regional and political policies should prioritize the country’s prospects in the tourism sector and other key sectors.
Reference
Abdulkareem, Y. A. (2018). Conflict, international trade and President Trump’s isolationist policies. Journal of International Trade Law and Policy, 17(1/2), 34-45.
ABC news (2018). https://www.abc.net.au/news/2018-08-16/wall-street-europe-drop-us-turkey-trade-row-intensifies/10125952. (Accessed 7 March 2019).
Aliperti, G., Rizzi, F., & Frey, M. (2018). Cause-related marketing for disaster risk reduction in the tourism industry: A comparative analysis of prevention-and recovery-related campaigns. Journal of Hospitality and Tourism Management, 37, 1-10.
Balli, F., Shahzad, S. J. H., & Uddin, G. S. (2018). A tale of two shocks: What do we learn from the impacts of economic policy uncertainties on tourism? Tourism Management, 68, 470-475.
Caldara, D. & Matteo I. (2017). "Measuring Geopolitical Risk," working paper, Board of
Governors of the Federal Reserve Board, 2017.
http://www.policyuncertainty.com/gpr.html. (Accessed 10 December 2018).
Cao, Z., Li, G., & Song, H. (2017). Modelling the interdependence of tourism demand: The global vector autoregressive approach. Annals of Tourism Research, 67, 1-13.
Central Intelligence Agency (2019). https://www.cia.gov/library/publications/the-world-factbook/geos/tu.html. (Accessed 7 March 2019).
Chan, F., Lim, C., & McAleer, M. (2005). Modelling multivariate international tourism demand and volatility. Tourism Management, 26(3), 459-471.
Chang, C. L., Khamkaew, T., Tansuchat, R., & McAleer, M. (2011). Interdependence of international tourism demand and volatility in leading ASEAN destinations. Tourism Economics, 17(3), 481-507.
Constantine C., Benjamin H., & Onur A. (2018). Turkey Financial Crisis Erupts, Stoking Concerns of Contagion. Bloomberg. https://www.bloomberg.com/news/articles/2018-08-10/turkish-lira-collapses-as-investors-panic-before-erdogan-address.
Croes, R., Ridderstaat, J., & van Niekerk, M. (2018). Connecting quality of life, tourism specialization, and economic growth in small island destinations: The case of Malta. Tourism Management, 65, 212-223.
Diebold, F. X., & Yilmaz, K. (2012). Better to give than to receive: Predictive directional measurement of volatility spillovers. International Journal of Forecasting, 28(1), 57-66. Dilek, S. E., & Fennell, D. A. (2018). Discovering the hotel selection factors of vegetarians: the
case of Turkey. Tourism Review, 73(4), 492-506.
Dogan, E., Seker, F., & Bulbul, S. (2017). Investigating the impacts of energy consumption, real GDP, tourism and trade on CO2 emissions by accounting for cross-sectional dependence: A panel study of OECD countries. Current Issues in Tourism, 20(16), 1701-1719.
Esposti, R., & Listorti, G. (2018). Price Transmission in the Swiss Wheat Market: Does Sophisticated Border Protection Make the Difference? The International Trade Journal, 32(2), 209-238.
Euro News (2018). https://www.euronews.com/2018/08/15/turkey-doubles-tariffs-on-more-us-imports-as-diplomatic-row-escalates. (Accessed 7 March 2019).
Federal Reserve Bank of St. Louis (FRED, 2018). https://fred.stlouisfed.org. (Accessed on 24 November 2018).
Gereffi, G., Humphrey, J., & Sturgeon, T. (2005). The governance of global value chains. Review of international political economy, 12(1), 78-104.
Gössling, S., Cohen, S. A., & Hibbert, J. F. (2018). Tourism as connectedness. Current Issues in Tourism, 21(14), 1586-1600.
Göymen, K. (2000). Tourism and governance in Turkey. Annals of Tourism Research, 27(4), 1025-1048.
Gozgor, G., & Ongan, S. (2017). Economic policy uncertainty and tourism demand: Empirical evidence from the USA. International Journal of Tourism Research, 19(1), 99-106. Hoti, S., McAleer, M., & Shareef, R. (2007). Modelling international tourism and country risk
spillovers for Cyprus and Malta. Tourism Management, 28(6), 1472-1484.
Ivanov, S., Gavrilina, M., Webster, C., & Ralko, V. (2017). Impacts of political instability on the tourism industry in Ukraine. Journal of Policy Research in Tourism, Leisure and Events, 9(1), 100-127.
Katircioglu, S. T., Feridun, M., & Kilinc, C. (2014). Estimating tourism-induced energy consumption and CO2 emissions: The case of Cyprus. Renewable and Sustainable Energy Reviews, 29, 634-640.
Kim, S. S., & Wong, K. K. (2006). Effects of news shock on inbound tourist demand volatility in Korea. Journal of Travel Research, 44(4), 457-466.
Kouchi, A. N., Nezhad, M. Z., & Kiani, P. (2018). A study of the relationship between the growth in the number of Hajj pilgrims and economic growth in Saudi Arabia. Journal of Hospitality and Tourism Management, 36, 103-107.
Kronenberg, K., Fuchs, M., & Lexhagen, M. (2018). A multi-period perspective on tourism’s economic contribution–a regional input-output analysis for Sweden. Tourism Review, 73(1), 94-110.
Kulendran, N., & Dwyer, L. (2009). Measuring the return from Australian tourism marketing expenditure. Journal of Travel Research, 47(3), 275-284.
Lanouar, C., & Goaied, M. (2019). Tourism, terrorism and political violence in Tunisia: Evidence from Markov-switching models. Tourism Management, 70, 404-418.
Neumayer, E. (2004). The impact of political violence on tourism: Dynamic cross-national estimation. Journal of conflict resolution, 48(2), 259-281.
Ongan, S., & Gozgor, G. (2018). Tourism demand analysis: The impact of the economic policy uncertainty on the arrival of Japanese tourists to the USA. International Journal of Tourism Research, 20(3), 308-316.
Organization for Economic Co-operation and Development, (OECD, 2018). Real Effective Exchange Rates Based on Manufacturing Consumer Price Index for Turkey [CCRETT01TRM661N], retrieved from FRED, Federal Reserve Bank of St. Louis. https://fred.stlouisfed.org/series/CCRETT01TRM661N. (Accessed on 25 November 2018).
Pesaran, M. H., Shin, Y., & Smith, R. J. (2000). Structural analysis of vector error correction models with exogenous I (1) variables. Journal of Econometrics, 97(2), 293-343.
Shahbaz, M., Kumar, R. R., Ivanov, S., & Loganathan, N. (2017). The nexus between tourism demand and output per capita with the relative importance of trade openness and financial development: A study of Malaysia. Tourism Economics, 23(1), 168-186.
Shareef, R., & McAleer, M. (2005). Modelling international tourism demand and volatility in small island tourism economies. International Journal of Tourism Research, 7(6), 313-333.
Sigala, M. (2017). Collaborative commerce in tourism: implications for research and industry. Current Issues in Tourism, 20(4), 346-355.
Tohmo, T. (2018). The economic impact of tourism in Central Finland: a regional input–output study. Tourism Review, 73(4), 521-547.
Trading Economics (2019). https://tradingeconomics.com/turkey/exports. (Accessed 7 March 2019).
United Nations World Trade Organization (UNWTO, 2017). World Trade Statistical Review. https://www.wto.org/english/res_e/statis_e/wts2017_e/wts17_toc_e.htm. (Accessed 27 November 2018).
Webber, A. G. (2001). Exchange rate volatility and cointegration in tourism demand. Journal of Travel Research, 39(4), 398-405.
World Development Indicators (WDI, 2018). World Bank Database https://data.worldbank.org/indicator. (Accessed on 24 November 2018).
World Travel and Tourism Council (WTTC, 2018). Travel and Tourism Economic Impact 2018. https://www.wttc.org/economic-impact. (Accessed 10 December 2018).
World’s Top Export (2019). http://www.worldstopexports.com/turkeys-top-10-exports/. (Accessed on 7 March 2019).
Wu, T. P., & Wu, H. C. (2019). A multiple and partial wavelet analysis of the economic policy uncertainty and tourism nexus in BRIC. Current Issues in Tourism, 1-11.
Yang, Y., & Wong, K. K. (2012). A spatial econometric approach to model spillover effects in tourism flows. Journal of Travel Research, 51(6), 768-778.
Yolal, M. (2016). History of Tourism Development in Turkey. In Alternative Tourism in Turkey (pp. 23-33). Springer, Cham.
Zahonogo, P. (2018). Globalization and economic growth in developing countries: evidence from Sub-Saharan Africa. The International Trade Journal, 32(2), 189-208.
Table 2: Descriptive statistics and the Correlation matrix of the series______________________________________________________________
Descriptive statistics
Variable Mean Median Maximum Minimum Skewness Kurtosis Jarque-Bera
receipts 14080446 10450728 39478000 1215000 0.584682 1.978168 38.48436*
rreceipts 54179227 0.00000 3.93E+09 -6.87E+09 -2.666211 76.4275 86494.66*
rex 89.90490 88.80661 121.1354 52.18717 -0.02348 2.01625 15.47928*
ttohigh 66.45256 68.00455 75.49950 53.56271 -0.50393 2.14097 27.98618*
oremetal 3.449409 3.309865 5.689451 1.993124 0.34767 2.41798 13.12192*
gpr 112.4198 102.4148 319.6390 42.70267 1.36267 5.52786 220.5049*
Correlation matrix receipts rreceipts rex ttohigh oremetal gpr
receipts 1.0000 rreceipts 0.0516 1.0000 (0.3133) 1.0000 rex 0.7545* 0.0640 1.0000 (0.0000) (0.2116) ttohigh -0.6924* -0.0239 -0.5094* 1.0000 (0.0000) (0.6409) (0.0000) oremetal 0.1241** -0.03552 0.0464 -0.6152* 1.0000 (0.0151) (0.4883) (0.3651) (0.0000) gpr 0.1241* -0.0717 0.1299** -0.0710 0.0249 1.0000 (0.0000) (0.1615) (0.0109) (0.1654) (0.6270)
Table 3: KPSS stationarity test ____________________________________________________________________________________________
Level Δ
Variables with intercept intercept and trend with intercept intercept and trend Conclusion___
lreceipts 2.211854* 0.511782* 0.103987 0.070119 unit root lREX 2.197982* 0.545514* 1.832815 0.194618 present at level lGPR 0.543467** 0.151194** 0.059421 0.055927 and
lOreMetal 0.463000 0.454672* 0.179544 0.068366 stationary at Δ
lTradeHigh 1.033350* 0.417256* 0.295847 0.143891
Dynamic ARDL (1, 0, 1, 1, 0) estimate with dependent variable lreceipts
Long-run lGPR lTradeHigh lOreMetal REX Adjustment Parameter_____
β -0.018 -1.378 -0.292 0.0003 -0.016 ECT (-1)
p-value 0.038** 0.000* 0.000* 0.1 0.069**
R-squared = 0.998 and Adjusted R-squared = 0.997 Wald test (short-run estimate)
F-statistic 10.3814* χ2 41.5255*
p-value 0.0000 p-value 0.0000
Residual diagnostics
Breusch-Godfrey SR LM test Breusch-Pagan-Godfrey H ARCH test χ2
(p-value) 0.407(0.524) 0.589 (0.443)
______________________________________________________________________________
Note: The lag length 1 of AIC and SIC for the Autoregressive Distributed Lad (ARDL) model (1, 0, 1, 1, 0) is employed. β is the coefficient of the repressors, p-value is the probability p-value and ECT is the Error Correction Term also known as the adjustment parameter. The χ2 is the Chi-square, SR LM is Serial correlation Lagrange Multiplier and H is Heteroskedasticity. l is the logarithmic value of the variable.
Table 4: The directional spillover results (receipts) ____________________________________
Variable 1 2 3 4 5 Contribution Net spillover
from others____________________ 1 97.7 0.1 1.8 0.2 0.1 2.3 22.6 2 3.9 91.4 2.8 0.1 1.8 8.6 -4.1 3 0.1 1.5 98.4 0.0 0.1 1.6 5.7 4 19.7 2.4 0.2 76.1 1.5 23.9 -21.1 5 1.2 0.5 2.4 2.4 93.5 6.5 -3.0 Contribution 24.9 4.5 7.3 2.8 3.5 43.0 to others Total Contribution 122.6 95.8 105.7 79.0 97.0 {8.6%} including own
Note: trade to high income countries (ttohigh) =1, tourism receipts (rreceipts) =2, real exchange rate (rex) =3, Metal ore (oremetal) =4, geopolitical risk (gpr) =5 Lag length by AIC selection = 2
Table 5: The directional spillover results (Return to receipts) ____________________________
Variable 1 2 3 4 5 Contribution Net spillover
from others____________________ 1 96.8 0.0 2.7 0.4 0.0 3.2 18.6 2 3.0 95.6 0.3 0.0 1.1 4.4 -1.9 3 0.3 0.3 97.0 0.3 2.1 3.0 1.4 4 18.3 2.1 0.3 77.1 2.2 22.9 -20.7 5 0.1 0.1 1.1 1.4 97.4 2.6 2.7 Contribution 21.8 2.5 4.4 2.2 5.3 36.1 to others Total Contribution 118.6 98.1 101.3 79.3 102.7 {7.2%} including own
Note: trade to high income countries (ttohigh) =1, return to tourism receipts (rreceipts) =2, real exchange rate (rex) =3, Metal ore (oremetal) =4, geopolitical risk (gpr) =5 Lag length by AIC selection =
13.6 14.0 14.4 14.8 15.2 15.6 16.0 16.4 16.8 17.2 17.6 86 88 90 92 94 96 98 00 02 04 06 08 10 12 14 16 LRECEIPTS (a) 3.95 4.00 4.05 4.10 4.15 4.20 4.25 4.30 4.35 86 88 90 92 94 96 98 00 02 04 06 08 10 12 14 16 LTTOHIGH (b) 0.6 0.8 1.0 1.2 1.4 1.6 1.8 86 88 90 92 94 96 98 00 02 04 06 08 10 12 14 16 LOREMETAL (c) 3.8 4.0 4.2 4.4 4.6 4.8 5.0 86 88 90 92 94 96 98 00 02 04 06 08 10 12 14 16 LREX (d) 3.6 4.0 4.4 4.8 5.2 5.6 6.0 86 88 90 92 94 96 98 00 02 04 06 08 10 12 14 16 LGPR (e)
Figure 1: The time plot of the logarithm of the international tourist arrivals (a), trade to high-income economies (b), export in metal ores (c), real exchange rate (d), and the geopolitical risk (e).
-60 -40 -20 0 20 40 60 88 90 92 94 96 98 00 02 04 06 08 10 12 14 16 CUSUM 5% Significance
Figure 2: The CUSUM (diagnostic) test for the dynamic Autoregressive Distributed Lag,