doi:10.3846/16484142.2015.1079800
A SEGMENTATION BASED ANALYSIS FOR MEASURING CUSTOMER
SATISFACTION IN MARITIME TRANSPORTATION
Yeliz Ekinci1, Nimet Uray2, Füsun Ülengin3, Cem Duran41Istanbul Bilgi University, Turkey, 2, 4Istanbul Technical University, Turkey
3Sabanci University, Turkey
Submitted 17 April 2014; resubmitted 22 September 2014; accepted 1 March 2015; published online 24 September 2015
Abstract. This study was conducted to profile customers according to the level of satisfaction with the service
attrib-utes of maritime public transport provided by Seabus Service Company (SSC), the sole provider of maritime transport in Istanbul. Such analysis needs to be conducted by considering market segments in terms of maritime transportation usage and post purchase behavior. This was accomplished by conducting quantitative research through face-to-face surveys of SSC passengers. According to the results by multivariate data analysis, including factor analysis and cluster analysis, six segments are revealed in terms of customer satisfaction level with the maritime service attributes. Moreo-ver, there are significant differences among the segments in terms of usage frequency (travel frequency in this study), age and education level. Different strategies for different customer segments within the maritime passenger market to increase customer usage and satisfaction of maritime transportation in Istanbul are suggested from the findings. Thus, this paper provides guidelines for the Turkish Maritime Authorities as to how to expand maritime transportation usage in Istanbul, which is not only the largest city and the most crucial trade center of Turkey but also has the highest share of passenger maritime transportation in the country.
Keywords: mass passenger public transport; statistical analysis; socio-economic characteristics; passenger
transporta-tion; customer satisfaction.
Corresponding author: Yeliz Ekinci E-mail: [email protected]
Copyright © 2015 Vilnius Gediminas Technical University (VGTU) Press http://www.tandfonline.com/TRAN
Introduction
European Union (EU) countries recently admitted that, in terms of the environment, business efficiency, health and extending road capacity to levels that can keep pace with predicted growth, current trends in traffic are un-sustainable. The first attempts to develop objective meas-ures to improve the EU transport network began in 1993 with the Maastricht Agreement. The introduction of the Trans-European Network (TEN) and the integration of political, institutional and financial bases were realized for this purpose. The aim of TEN is, first of all, to ulti-mately forge a truly unique Europe through economic and social integration and to provide a balanced usage of transportation modes throughout Europe (EC 2001). The White Paper, published in 2011 (EC 2011b), identifies the challenges that the transport system is likely to face in the future, based on evaluation of policies and devel-opments in the recent past and on assessment of current trends. It defines a long-term strategy that would allow the transport sector to meet its goals by 2050. This report
is part of a joint impact assessment for initiatives by the European Commission (EC) related to the transition to a low-carbon economy by 2050 – to ensure consistency in both the modeling framework and the consequent de-velopment of policies. The overall policy goal is to move towards a low-carbon competitive economy that would meet the long-term requirements for limiting climate change to 2 °C. Increasing maritime transport as a share of total transport is one viable way of achieving this. Currently, as is underlined by the statistics of EU Reports (EC 2011a), although three-quarters of the globe is covered by the sea, passenger maritime trans-portation as a means to transition to a low-carbon econ-omy remains underutilized.
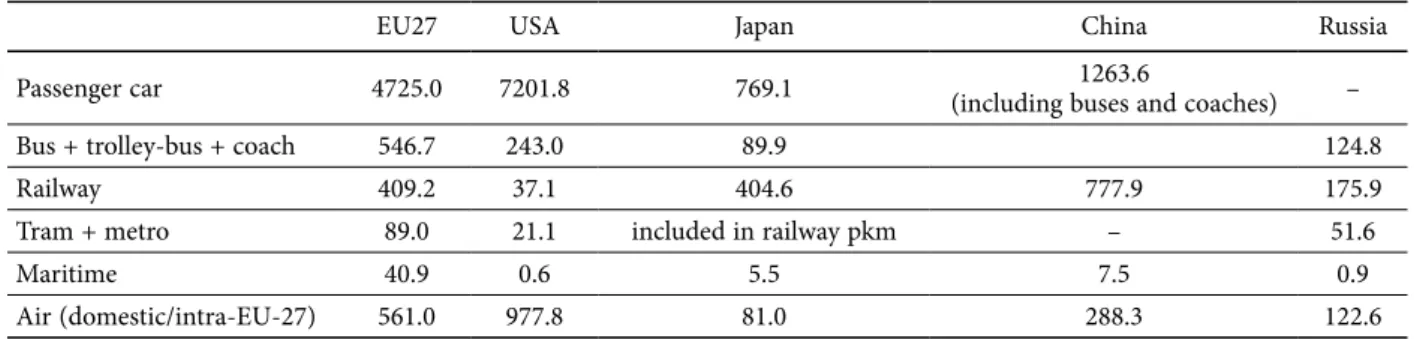
Table 1 shows that among worldwide passenger transport values [in billion passenger-kilometers (pkm)], the passenger car has the largest share among the vari-ous transportation modes. Underutilization of maritime transportation, as well as excessive passenger car use, is clearly not a country-specific but a worldwide phenom-enon.
Reducing private transport use and increasing public transport use two critical but challenging tasks for dealing with the problem of urban transportation (Lai, Chen 2011). Increasing the number of customers as well as the travel frequency is a convenient way of facilitating demand for specific goods or services. Thus, increasing customer satisfaction through enhancing per-ceived performance of a specific public transportation service is a key factor to expand the usage of such public transport by existing passengers. Now, more than ever, public transport operators are forced to place particular emphasis on monitoring and improving their services (Tyrinopoulos, Antoniou 2008; Birnerova 2007; Valask-ova, Križanova 2008) to increase customer satisfaction. As customer satisfaction increases, travel frequency in-creases as well. Thus, extending the maritime passenger market by using effective intensive growth strategies developed based on information about customer satis-faction, such as by increasing the quality of service and level of customer satisfaction, is highly feasible.
The basic aim of this study is to analyze the mari-time passengers market in Istanbul, the city with the highest share of maritime passenger transportation in Turkey. The analysis is conducted by segmenting them based on their satisfaction level. The second section pro-vides an overview of innercity transportation in Istan-bul and underlines the underdevelopment of maritime transportation. The third section provides a literature review on customer satisfaction in general, as well as satisfaction with public transportation in particular. The fourth section presents the research framework based on a survey conducted on Seabus Service Company (SSC) passengers. Finally, conclusions and further suggestions are given.
1. Why Analyze Istanbul as a Case Study?
Istanbul is a unique city that has preserved its position as an economic center throughout its history, as well as being the capital city of three empires. Today Istanbul accounts for nearly 20% of Turkey’s gross national prod-uct, contributing 40% of the government’s budget while taking only 7–8% of the government’s expenditure (IBB 2011a). In the Census carried out in Turkey in 2007, it became evident that migration to Istanbul continues. As of 2011, the population of Istanbul had reached over 12.5 million (IBB 2011b).
Automobiles account for 75% of vehicles in Istanbul and approximately 500 new automobiles are registered each day, making local traffic intolerable. Considering that the daily travel time per person is 2.5 hours, cor-responding to a minimum loss of labor of 300 million TL (Turkish Lira) per year, the transportation situation is serious (Ocak 2006).
The transportation issue is important in Istanbul not only because of its high population, but also because Istanbul is on the main highway route between two con-tinents – Europe and Asia – and is the industrial, trade, cultural and tourism center of Turkey. According to the statistics of the General Directorate for Highways for 2006, 250000–300000 vehicles are used every day. Such traffic congestion has an economic cost (POAS 2011).
As can be seen from Fig. 1, highways carry 92.29% of the total traffic in Istanbul. More than half of highway transportation is via private cars, taxis, minibusses and minibus taxis. Nearly 44% of highway transportation is by private cars while public buses account for 28.15%. The number of bus stops, cardholders and lines has sig-nificantly increased in recent years (IETT 2011) in paral-lel with the increasing number of students and teachers living in the city. If the trend continues, the demand for public transportation including a share of maritime trans-portation is expected to increase. However, this trend needs to be accelerated by implementing effective poli-tics and strategies to prevent more severe transportation problems in a continuously growing city like Istanbul. Although, urban settlement and current traffic congestion make maritime transportation advanta-geous concerning to speed, maritime transportation is only 2.20% of all transport, ranking a distant third after highways and the railway. SSC provides 8.14% of the public transportation. Despite its low share of pub-lic transportation in Istanbul, maritime transportation Table 1. Worldwide 2008 passenger transport values [billion pkm] (EC 2011a)
EU27 USA Japan China Russia
Passenger car 4725.0 7201.8 769.1 (including buses and coaches)1263.6 –
Bus + trolley-bus + coach 546.7 243.0 89.9 124.8
Railway 409.2 37.1 404.6 777.9 175.9
Tram + metro 89.0 21.1 included in railway pkm – 51.6
Maritime 40.9 0.6 5.5 7.5 0.9
Air (domestic/intra-EU-27) 561.0 977.8 81.0 288.3 122.6
Fig. 1. Percentage utilization of transportation type and public transport in Istanbul (IETT 2011)
92 29. 2 20. 5 50. Highway Sea route Railway 63 67. 7 09. 7 73. 6 36. 8 14. 0 38. Bus Train Light rail Subway SSC Tram
has some important advantages compared to the other transportation methods, including high capacity, low facility costs, cheap tickets, safety, comfort and environ-mental friendliness. Safety is emphasized strongly; for instance, it was found to be the most important criterion in the study of Jain et al. (2014).
In summary, although Istanbul’s maritime transpor-tation has developed rapidly (Fig. 2), it remains behind the target level and is underutilized despite its suitability for Istanbul. The high level of private car and highway use has resulted in severe traffic congestion and negative environmental impact. The data in Fig. 2 clearly shows that SSC changed the slope of passenger data when it en-tered the market and opened new intercity lines in 2004.
Only limited research has been conducted to ana-lyze the demand side in general, and customer satisfac-tion, in particular to find strategic ways to increase the demand for maritime transportation in Istanbul. How-ever, by understanding the nature of customer satisfac-tion by maritime transportasatisfac-tion users and highlighting the attributes to which they give primary importance as well as their satisfaction with these attributes, specific strategies can be developed to increase the frequency of usage of this service and provide insights as to how to attract more potential passengers (De Oña et al. 2014). This study therefore aims to provide guidelines to the Turkish Maritime Authorities and maritime transporta-tion service providers such as SSC to fill the gap between the expectations and perceived performance of passen-gers, as well as providing useful data to help policy mak-ers develop effective transportation policies for Istanbul. To the best of our knowledge, this research is the first at-tempt to investigate the maritime transportation market in Istanbul on a micro-scale.
2. Literature Review
Satisfaction is an overall effective response to a perceived discrepancy between prior expectations and perceived performance after consumption (Oliver 1980, 1999). The concept of consumer satisfaction has a central position in marketing thought and practice since it is a major outcome of marketing activity and serves to link pro-cesses that culminate in purchase and consumption. In
the early 1970s, consumer satisfaction began to emerge as a legitimate field of inquiry. Pfaff (1972) was the first to report direct information on consumer satisfaction to policy makers. Studies by Olshavsky and Miller (1972), Anderson (1973) and Cardozo (1964) formed the foun-dation for much of the later theory and experimental research. These studies made important contributions that attracted attention to customer satisfaction, and were followed by many studies proposing theoretical structures and conceptual models to investigate its di-mensions (Churchill, Surprenant 1982; Gustafsson et al. 2005; Williams, Naumann 2011).
Anderson et al. (1994) investigated the link be-tween customer satisfaction and economic returns, finding that higher customer satisfaction leads to su-perior economic returns. Other studies also emphasize that satisfaction increases profitability through increas-ing loyalty and word-of-mouth communication, and decreasing marketing expenditure (Reichheld 2001; Hallowell 1996). Widespread acceptance of another re-lationship is also evident in the literature on customer satisfaction and both perceived quality and value (An-derson, Sullivan 1993, Chen 2008; Jen, Hu 2003; Petrick 2004; Malik 2012). Anderson and Sullivan (1993) state that satisfaction is best specified as a function of the perceived quality ‘disconfirmation’, which is the extent to which perceived quality fails to match prepurchase expectations. They further report that quality falls short of expectations and has a greater impact on satisfaction and repurchasing intentions than quality, which exceeds expectations, thus emphasizing the importance of feed-back from the market to draw implications to facilitate repurchasing.
Although, the majority of studies in the literature focusing on testing the link between customer satisfac-tion and related constructs have been conducted in vari-ous sectors, they have mostly been from the perspective of for-profit companies. There have been many studies about the satisfaction of services such as retail banking (Hallowell 1996; Culiberg, Rojšek 2010), e-markets (An-derson, Swaminathan 2011), and health services (Tataw
et al. 2011). Few studies have analyzed transportation
services. Although, the studies mentioned above mostly explore the satisfaction factors of for-profit companies, all of them share a common finding that service qual-ity, perceived value and customer satisfaction are closely related concepts.
In parallel with the findings of similar studies conducted for non-profit organizations in different in-dustries, Lai and Chen (2011) indicate that passengers who perceive the quality of a public transit service as being good are more likely to have a higher level of per-ceived value and satisfaction, and so continue to use the service. Fellesson and Friman (2008) provide a trans-national comparison of the perceived service satisfac-tion with public transport in eight European countries. Using factor analysis, they identified three satisfaction dimensions, namely, comfort, staff, and safety, present in most but not all of the cities. These findings indicate that there are differences in how public transport is per-Fig. 2. Maritime passenger transport usage in Istanbul
Tr an sp or t u sa ge [ p km ] 120000 80000 40000 32000 24000 20000 16000 12000 8000 4000 90 92 94 96 98 00 02 04 06 08 10 Year
ceived according to location. Thus, while there are in-dustry generic dimensions, it is also important to take local conditions into consideration. These findings mo-tivated us to explore the factors of a specific transport mode – maritime public transportation – in a specific city – Istanbul.
The present study identifies the satisfaction patterns of maritime transportation passengers as customers and defines different customer segments based on the per-ceived satisfaction levels of customers according to dif-ferent service attributes. Customers will consider some attributes as being more important than others and will give different satisfaction ratings to a particular attrib-ute (Lu 2003). Thus, analysis of customer satisfaction of maritime transportation should consider all factors in-fluencing the satisfaction.
Previous literature has mostly focused on the relationship between the antecedents (for example, ser-vice quality, perceived attributes of serser-vices or products, and perceived value) and consequences (for example, loyalty and repurchase intention) of customer satisfac-tion. Other studies have focused only on overall custom-er satisfaction as a function of satisfaction with the com-ponents of the service concept, that is, attribute-based models of satisfaction. As Anderson et al. (2008) point out, most service typologies in the latter studies focus exclusively on discriminating characteristics of the ser-vice concept. They ignore customer characteristics and implicitly treat all customers as identical. Few of these studies consider demographic characteristics of the cus-tomers as a tool for market segmentation together with the service components. The literature indicates that the attributes of the service/product itself, the attitude of the service personnel, the physical environmental con-ditions (such as comfort and cleanliness), as well as the demographic characteristics of the customers (such as age, gender and education level) have frequently been considered to be critical components of customer satis-faction in the service industries (Bedi 2010; Deng, Nel-son 2012; Olawole, Aloba 2014).
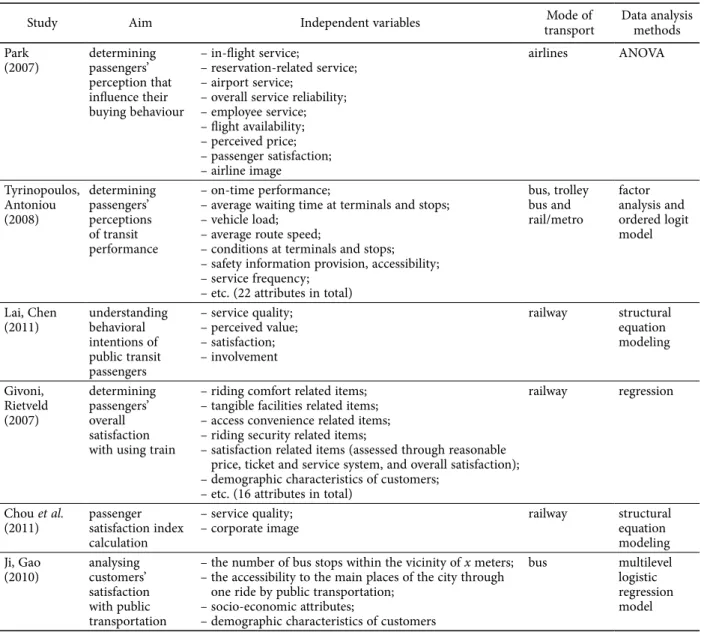
Park’s (2007) study is one of the few studies on cus-tomer satisfaction in the transport service industry that highlights the importance of other elements influencing overall satisfaction. This study analyses passenger satis-faction of airline transportation, finding 11 components, including six dimensions of airline services, namely: in-flight service, reservation-related service, airport service, reliability, employee service, flight availability, perceived price, passenger satisfaction, perceived value, airline im-age and overall service quality. The results reveal that passenger satisfaction perceptions differ significantly across airlines, seat classes, usage and travel frequency.
Tyrinopoulos and Antoniou (2008) analyzed stud-ies conducted by the Hellenic Institiute of Transport in Greece. The primary aim of the Hellenic Institute of Transport’s quality control programs for public trans-port operators was to assess the relationship between the quality and performance of the transit systems using a variety of performance and quality indicators, including on-time performance, average waiting time at terminals
and stops, vehicle load, average route speed, conditions at terminals and stops, provision of safety information and accessibility. The findings demonstrated that a well coordinated transportation environment should be the primary aim of policy makers in Athens to satisfy pas-sengers, followed by other quality attributes such as service frequency and accessibility (Tyrinopoulos, An-toniou 2008).
Lai and Chen (2011) explored the relationships between passenger behavioral intentions and the vari-ous factors affecting them using structural equation modeling. They used passenger survey data from the Kaohsiung Mass Rapid Transit, a newly operating pub-lic transit system in Taiwan, to test the validity of the conceptual model proposed in their study. In addition to the factors recognized by past studies, the present study addresses the importance of the involvement of the pub-lic transport service provider on passenger behavioral intentions. The relationships between service quality, perceived value, satisfaction, and behavioral intentions provide important implications for public transit com-panies. Passenger behavioral intentions and loyalty rely significantly on passenger satisfaction. Moreover, two antecedents – service quality and perceived value – must be improved to enhance passenger satisfaction.
Givoni and Rietveld (2007) found that the qual-ity and access to a station and personal space on the train have an important effect on the general usage of railways. Chou et al. (2011) also utilized a confirmatory passenger behavior model to appraise the quality and performance of high-speed rail services. Their empiri-cal study concludes that the service quality indicators ‘access to a station’ and ‘personal space on a train’ need to be addressed as a top priority to improve customer satisfaction and corporate profits (Chou et al. 2011).
Ji and Gao (2010) developed a method to evalu-ate the efficiency of urban structure focusing on public transportation systems. Taking Beijing as an example, the impact of selected factors including service attrib-utes and passenger characteristics such as demographics and personal characteristics on satisfaction of passen-gers were analyzed using a multilevel logistic regression model to identify significant factors of satisfaction. It was found that the number of bus stops within a distance of 800 m, access to the main places of the city by one ride on public transportation as well as passengers’ socio-economic characteristics significantly affected residents’ satisfaction with public transportation services. Zhang and Gao (2008) also presented an empirical analysis of the traffic problems in Beijing using a large-scale survey that measured the residents’ degree of satisfaction with the traffic environment. Spatial differentiations were identified across social groups. This study highlights that residents’ satisfaction is a comprehensive index, reflecting the qualities of physical space and transporta-tion service as well as the impact of personal attributes and preferences. Table 2 summarizes the studies analyz-ing passenger satisfaction accordanalyz-ing to the components considered, the mode of transport examined and the data analysis methods used.
Table 2 shows that a common finding of the ma-jority of the studies is that both the service quality and perceived value have a significant impact on passenger satisfaction, and hence, must be addressed to enhance passenger satisfaction. Attribute-based items found to be significant components of customer satisfaction in the transport service where physical conditions of a station and the transportation vehicle, availability, safety and re-liability of the service, perceived price and accessibility to the station. In the previous studies, the multivariate statistical analysis was generally used to determine the factors affecting passenger satisfaction and to analyse differences among passengers.
The majority of studies on passenger satisfaction were conducted in cities/countries in which the effec-tiveness of the public transportation is crucial because of the high population. These studies provide important insights for policy makers and decision makers in the related countries, facilitating the development of general policies and strategies. However, the passenger market could be analyzed in more detail by dividing into
dif-ferent groups according to the satisfaction level. This would enable decision makers to more effectively tailor policies and strategies to each type of passenger group in the market.
The literature lacks a systematic, comprehensive research approach to analyze passenger satisfaction in maritime transportation. This is especially true for Turkey in general, and Istanbul in particular, from the perspective of a customer satisfaction framework. As one of the most crowded cities in Europe, Istanbul is an attractive research setting for analyzing customer sat-isfaction of public services. For this reason, this study aims to analyze satisfaction of passengers in maritime transportation in Istanbul employing satisfaction-based segmentation. In summary, the general objectives of this study are to:
– divide the passengers into different segments ac-cording to their satisfaction levels with the dif-ferent attributes of the maritime transportation service;
Table 2. Summary of literature review on passenger satisfaction
Study Aim Independent variables transportMode of Data analysis methods
Park (2007) determining passengers’ perception that influence their buying behaviour – in-flight service; – reservation-related service; – airport service;
– overall service reliability; – employee service; – flight availability; – perceived price; – passenger satisfaction; – airline image airlines ANOVA Tyrinopoulos, Antoniou (2008) determining passengers’ perceptions of transit performance – on-time performance;
– average waiting time at terminals and stops; – vehicle load;
– average route speed;
– conditions at terminals and stops; – safety information provision, accessibility; – service frequency;
– etc. (22 attributes in total)
bus, trolley bus and rail/metro factor analysis and ordered logit model Lai, Chen (2011) understanding behavioral intentions of public transit passengers – service quality; – perceived value; – satisfaction; – involvement railway structural equation modeling Givoni, Rietveld (2007) determining passengers’ overall satisfaction with using train
– riding comfort related items; – tangible facilities related items; – access convenience related items; – riding security related items;
– satisfaction related items (assessed through reasonable price, ticket and service system, and overall satisfaction); – demographic characteristics of customers;
– etc. (16 attributes in total)
railway regression
Chou et al.
(2011) passenger satisfaction index calculation
– service quality;
– corporate image railway structural equation
modeling Ji, Gao (2010) analysing customers’ satisfaction with public transportation
– the number of bus stops within the vicinity of x meters; – the accessibility to the main places of the city through
one ride by public transportation; – socio-economic attributes;
– demographic characteristics of customers
bus multilevel
logistic regression model
– determine the profile of each segment based on demographics, socioeconomic characteristics of passengers and perceived importance of service attributes;
– prepare a guideline for maritime transportation companies to help them develop different strate-gies for passengers in different segments and to give some insights to governmental bodies for developing effective transportation policies. 3. Methodology
3.1. Data Collection Method and Instruments
This study is based on descriptive research through a cross-sectional quantitative study on data collected from maritime passengers using face-to-face interviews through questionnaires. Three main groups of variables are included in the study:
– the perceived importance of maritime transpor-tation service attributes acting as dimensions of satisfaction;
– satisfaction levels of the components of the mari-time transport service;
– demographic and usage characteristics of pas-sengers.
The first two groups of variables were measured based on statements rated using a five-point Likert scale. The survey aims to identify the level of customer satis-faction on the different dimensions of maritime trans-portation, their perceived level of importance as well as the demographic characteristics of the customers.
The surveys were conducted with foot passengers and included 63 items derived from both previous stud-ies in the literature and the findings of past studstud-ies con-ducted by SSC. First, passengers were asked to state the level of perceived importance of each dimension. They were then asked to give their level of satisfaction for each dimension. In addition to these dimensions, the survey included questions about demographics (age, gender, educational level, and traveling frequency).
3.2. Sampling
3.2.1. Sampling Population
Although SSC serves both foot and vehicle passengers, this study only focuses on foot passengers because of their high share of the total number of maritime pas-sengers. The survey was conducted through face-to-face interviews over a three-week period. In this study, 261 interviews were carried out in the period 9–18 October 2010 (with a 95% confidence level, ± 2.00% error margin and 0.5 distribution rate). The passengers in the sam-ple were chosen using a systematic sampling method, which is a probability sampling and has the potential to create a sample that is almost identical in quality to sample created from simple random sampling. At the predetermined time, intervals during ten days, based on the skip interval calculated, every twentieth passenger entering to the terminal was interviewed. Table 3 pre-sents the profile of the sample in terms of demographic and behavioral characteristics.
As can be seen from Table 3, the majority of pas-sengers are males aged 30–34. Additionally, 39.08% of the customers are high school graduates and there are no uneducated passengers. A high share of the total, 22.99% of passengers, travel daily by maritime transportation.
Table 3. Distribution of demographic data of interviewed passengers Age [%] 0–24 25–29 30–34 35–39 40–44 45–49 50–54 >55 15.32 18.39 21.46 15.33 12.26 7.66 5.36 4.22 Gender [%] female male 19.9280.08 Education Level [%]
primary school graduate secondary school graduate high school graduate
university graduate and higher educated
10.73 13.79 39.08 36.40 Travel frequency [%] every day 2–3 times a week once a week
once every two or three weeks once a month infrequently 22.99 18.39 20.31 19.92 7.66 10.72 3.2.2. Underlying Dimensions of Satisfaction
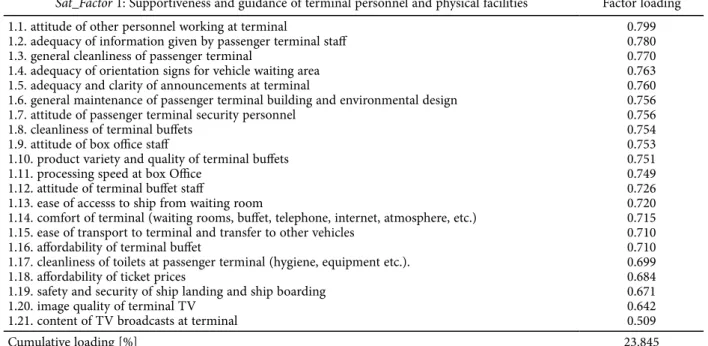
The survey includes 63 items representing satisfaction with the components of the maritime transport service, that is, service attributes. The perceived satisfaction with each attribute is measured on a five-point scale. As the most effective method to reduce large numbers of items to smaller sets of underlying factor analysis, is used to group the items (Ambrož, Lotrič 2009). Cumulative loading is the variance explained by the factor and the previous factors. Notice that Sat_Factor 1 accounts for 23.845% of the variance, Sat_Factor 1 and 2 account for 28.706% of the variance, and so on (Kim, Mueller 1978). The total variance explained by the factor analy-sis is 73.325%. Six factors with loadings greater than 0.5 were generated by the analysis and checked with KMO (Kaiser–Meyer–Olkin) and Bartlett’s test of significance (Kim, Mueller 1978). The interpretation of the factors and their variances are given in the tables. The factors derived from the analysis are as follows:
– Satisfaction Factor 1 – Supportiveness and guidance of terminal personnel and physical facilities: As can be seen from Table 4, this fac-tor includes attributes related to the attitude of the terminal personnel, informativeness of an-nouncements and orientation signs, and condi-tions at the terminal. Attitude of other personnel
working at the terminal has the highest loading
– Satisfaction Factor 2 – Adequacy and accessi-bility of information through technology-based support systems: As is shown in Table 5, this factor includes items about the website and call center. Adequacy of the information provided by
the call center’s automatic answering system has
the highest loading for this factor.
– Satisfaction Factor 3 – Quality and comfort of physical facilities: This is composed of attributes
related to comfort of the passenger halls and seats in the ship, physical conditions in the ship’s pas-senger halls, transportation safety and security, and promptness of ship departure times. Comfort
in ship’s passenger halls has the highest loading for
this factor (Table 6).
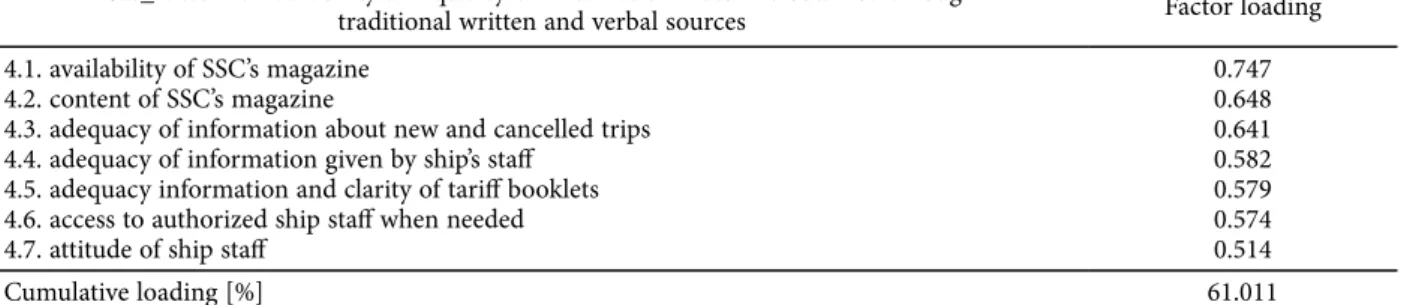
– Satisfaction Factor 4 – Availability and quality of information materials obtained through tra-ditional (written and verbal) sources: This relates Table 4. Satisfaction Factor 1 factor loadings
Sat_Factor 1: Supportiveness and guidance of terminal personnel and physical facilities Factor loading 1.1. attitude of other personnel working at terminal
1.2. adequacy of information given by passenger terminal staff 1.3. general cleanliness of passenger terminal
1.4. adequacy of orientation signs for vehicle waiting area 1.5. adequacy and clarity of announcements at terminal
1.6. general maintenance of passenger terminal building and environmental design 1.7. attitude of passenger terminal security personnel
1.8. cleanliness of terminal buffets 1.9. attitude of box office staff
1.10. product variety and quality of terminal buffets 1.11. processing speed at box Office
1.12. attitude of terminal buffet staff
1.13. ease of accesss to ship from waiting room
1.14. comfort of terminal (waiting rooms, buffet, telephone, internet, atmosphere, etc.) 1.15. ease of transport to terminal and transfer to other vehicles
1.16. affordability of terminal buffet
1.17. cleanliness of toilets at passenger terminal (hygiene, equipment etc.). 1.18. affordability of ticket prices
1.19. safety and security of ship landing and ship boarding 1.20. image quality of terminal TV
1.21. content of TV broadcasts at terminal
0.799 0.780 0.770 0.763 0.760 0.756 0.756 0.754 0.753 0.751 0.749 0.726 0.720 0.715 0.710 0.710 0.699 0.684 0.671 0.642 0.509 Cumulative loading [%] 23.845
Table 5. Satisfaction Factor 2 factor loadings
Sat_Factor 2: Adequacy and accessibility of information through technology support systems Factor loading 2.1. adequacy of information given by call center automatic answering system
2.2. adequacy of information on website 2.3. access to call center customer representative
2.4. adequacy of information given by call center representative 2.5. attitude and comportment of call center customer representative 2.6. up-to-dateness of website
2.7. facility for using website
2.8. facility for using call center automatic answering system 2.9. internet access to website
2.10. access to terminal’s authorized staff when needed
0.848 0.835 0.815 0.814 0.801 0.792 0.756 0.744 0.682 0.658 Cumulative loading [%] 38.706
Table 6. Satisfaction Factor 3 factor loadings
Sat_Factor 3: Quality and comfort of physical facilities Factor loading 3.1. comfort of seats in ship’s passenger halls
3.2. comfort in ship’s passenger halls
3.3. air conditioning and ventilation of ship’s passenger halls 3.4. lighting in ship’s passenger halls
3.5. general maintenance of ship
3.6. general cleanliness in ship’s passenger halls 3.7. adequacy and clarity of annoncements in ship 3.8. transportation safety and security
3.9. adequacy of warning/orientation signs in ship’s passenger halls 3.10. promptness of ship departure times
0.795 0.789 0.740 0.719 0.688 0.664 0.646 0.625 0.623 0.604 Cumulative loading [%] 52.475
to the availability of SSC’s magazine, adequacy of information provided and clarity of tariff book-lets. The item availability of SSC’s magazine has the highest loading for this factor (Table 7). – Satisfaction Factor 5 – Availability and
conveni-ence of transportation: This reflects frequency, promptness of ship arrival times and convenience of transportation times. Regulation of
transporta-tion times in accordance with customers’ expecta-tions has the highest loading for this factor (Table 8).
– Satisfaction Factor 6 – Availability of new lines and informative mass communication: As can be seen from Table 9, this factor relates to the avail-ability of new lines and information dissemina-tion. Opening new lines by SSC has the highest loading for this factor.
3.3. Satisfaction-Based Segmentation
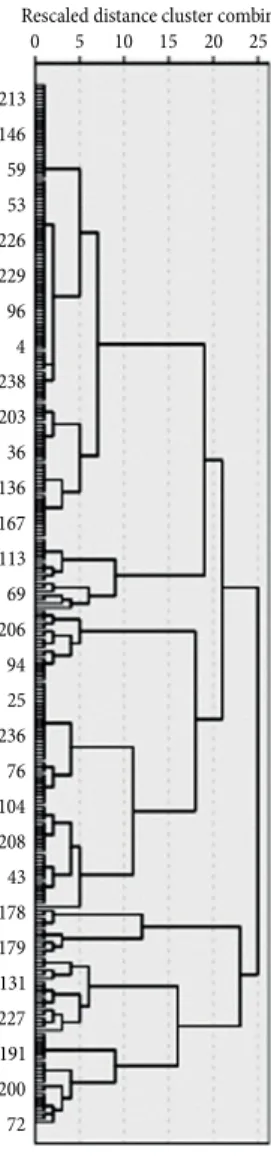
Due to the fact that the sample size of the survey is relatively small, we used Ward’s hierarchical technique method in order to get clusters of approximately equal size. Cluster analysis with Ward’s hierarchical technique using squared Euclidean distances (Hair et al. 1995) was employed to identify segments of customers ac-cording to their loading on each of the six satisfaction factors. Fig. 3 shows a dendogram of the method: 261 respondents were assigned to six segments, Segments 1 to 6, comprising 114, 18, 18, 57, 12 and 42 respondents, respectively.
Table 10 shows that all the factors were found to differ significantly among the segments at the p < 0.05 significance level according to the results of ANOVA, which was used to examine which factors differed among the segments (Hair et al. 1995). The analysis dif-ferentiated the following six market segments:
– Segment 1 – Passengers satisfied with continu-ous support and communication: This segment consists of customers highly satisfied with the continuous support and communication activi-ties of SSC. These customers seem to expect and are satisfied with a high level of service including availability and content of magazines, and ade-quacy of the information about new and canceled trips from the service provider.
– Segment 2 – Passengers satisfied with the avail-ability of information through technology-based support systems: This segment includes custom-ers mainly satisfied with the technology-based support service. To satisfy these customers a technology component should be included in SSC’s customer services. Although these pas-sengers are not satisfied with communication through traditional written and verbal sources, convenience of transportation and availability of new lines, they are satisfied with the primary ser-vice, namely, the transportation service.
– Segment 3 – Passengers satisfied with quality of core service and comfort: This group consists of customers whose perceived level of satisfaction is Table 7. Satisfaction Factor 4 factor loadings
Sat_Factor 4: Availability and quality of information materials obtained through
traditional written and verbal sources Factor loading
4.1. availability of SSC’s magazine 4.2. content of SSC’s magazine
4.3. adequacy of information about new and cancelled trips 4.4. adequacy of information given by ship’s staff
4.5. adequacy information and clarity of tariff booklets 4.6. access to authorized ship staff when needed 4.7. attitude of ship staff
0.747 0.648 0.641 0.582 0.579 0.574 0.514 Cumulative loading [%] 61.011
Table 8. Satisfaction Factor 5 factor loadings
Sat_Factor 5: Availability and convenience of transportation Factor loading 5.1. regulation of transportation times in accordance with customer’s expectations
5.2. convenience of transportation time 5.3. frequency of transportation
5.4. putting on a new transportation if necessary 5.5. noise level during transportation
5.6. promptness of ship arrival time
0.703 0.690 0.668 0.569 0.542 0.534 Cumulative loading [%] 68.816
Table 9. Satisfaction Factor 6 factor loadings
Sat_Factor 6: Availability of new lines and of informative mass communication Factor loading 6.1. opening new lines by SSC
6.2. advertising of SSC’S new lines and services
6.3. adequacy of SSC’s advertising about cultural and artistic activities
0.632 0.604 0.590
based mainly on the quality of the primary ser-vice, including safety, security and timeliness of the transportation service. They are also satisfied with the complementary services such as comfort of the passenger halls and seats in the ship, and the physical atmosphere of the ship. Therefore, they do not perceive maritime transportation solely as a transportation service but rather as an augmented service with complementary facilities. On the other hand, passengers in this segment are not satisfied with the traditional or technolo-gy-supported customer service system.
– Segment 4 – Information-prone passengers: These are the customers whose perceived level of satisfaction mainly results from the availabil-ity and qualavailabil-ity of information from written and personal sources. The passengers in this segment could be satisfied by increasing the quality and availability of information-related attributes, for example, being regularly informed about travel frequencies and times. A continuous flow of information between them and the company is crucial to maintain satisfaction level. Another finding is that the passengers in this segment are not generally satisfied with other attributes of the service.
– Segment 5 – Continuous guidance-focused pas-sengers: These are customers whose perceived level of satisfaction is mainly based on the sup-portiveness and guidance of the terminal person-nel and physical facilities. Although, this group is satisfied with the quality of mass communication and availability of new lines, they are unsatisfied with the primary service.
– Segment 6 – Passengers satisfied with availabili-ty of technology and mass communication based information: This segment consists of passengers who are satisfied with SSC’s level of technological responsiveness including newly opened lines and the advertisements about them as well as SSC’s cultural and artistic activities.
3.3.1. Profile of Segments According to Perceived Importance of Service Attributes
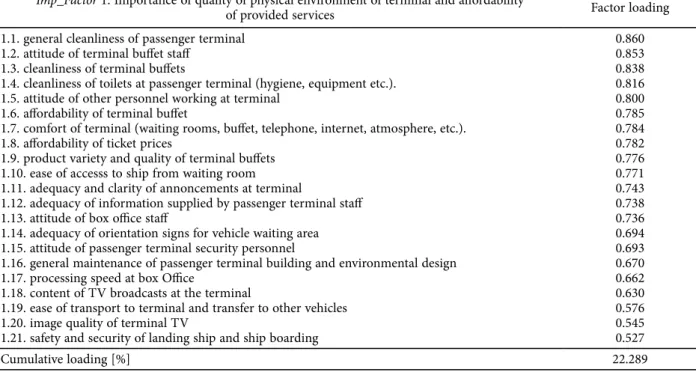
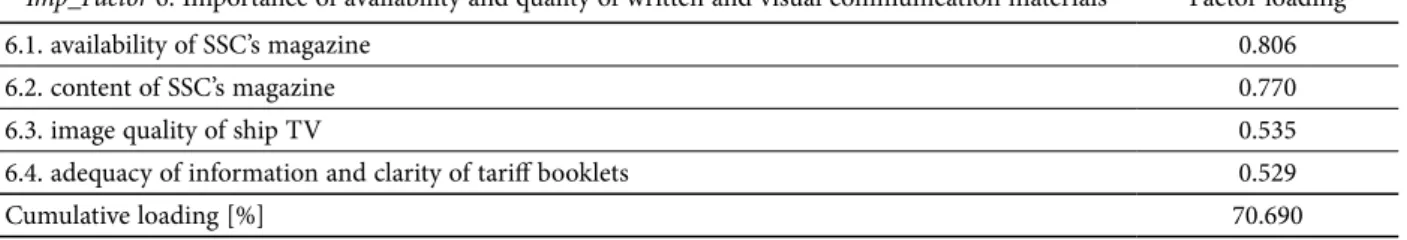
For the third objective of this study – demographic and usage characteristics of passengers – differences between segments in terms of the perceived importance of ser-vice attributes are also analyzed. Before undertaking this analysis, the items measuring the perceived importance of service attributes were analyzed by factor analysis to summarize and identify the underlying dimensions, and to describe the profile of each segment more precisely. The analysis identified six factors with 70.690% of the total variance explained. The factors are defined briefly as follows:
– Importance Factor 1 – Importance of quality of physical environment of terminal and afford-ability of the provided services: As shown in Ta-ble 11, this factor comprises attributes related to the cleanliness of the terminal, the attitude of the Fig. 3. Cluster analysis dendogram built using Ward linkage
72 200 191 227 131 179 178 43 208 104 76 236 25 94 206 69 113 167 136 36 203 238 4 96 229 226 53 59 146 213 0 5 10 15 20 25
Rescaled d stance cluster comb ne
Table 10. Analysis of satisfaction factors among the segments
Segment 1 Segment 2 Segment 3 Segment 4 Segment 5 Segment 6 Significance
Sat_Factor 1 0.370 0.141 0.049 –0.931 1.915 –0.369 0.000 Sat_Factor 2 0.284 0.411 –1.954 –0.276 –0.507 0.410 0.000 Sat_Factor 3 0.280 0.215 0.870 –0.320 –2.264 –0.141 0.000 Sat_Factor 4 0.392 –0.071 –0.368 0.406 –0.068 –1.409 0.000 Sat_Factor 5 0.190 –1.026 0.497 –0.396 –0.240 0.318 0.000 Sat_Factor 6 0.087 –1.996 –0.160 0.068 0.643 0.411 0.000
terminal staff and affordability of tickets. General
cleanliness of the terminal has the highest loading
for this factor.
– Importance Factor 2 – Importance of availabili-ty and convenience of transportation: This factor (Table 12) reflects the promptness of ship arrival times, convenience of transportation time, pas-sage frequency and security. Promptness of ship
arrival times and convenience of transportation times have the highest loadings for this factor.
– Importance Factor 3 – Importance of accessi-bility and adequacy of technology-based sup-port services: As shown in Table 13, this factor includes items about the website and call center.
Adequacy of the information on website has the
highest loading for this factor.
– Importance Factor 4 – Importance of quality of core service and of related physical facili-ties: This comprises attributes related to transfer (adequacy of orientations in the ship, comfort of
ship’s passenger halls, promptness of ship depar-ture times and physical conditions in the ship).
Adequacy of warning/orientation signs in ship’s passenger halls has the highest loading for this
factor (Table 14).
– Importance Factor 5 – Importance of responsive-ness to customer needs: As shown in Table 15, this factor refers to responsiveness to passenger wishes and complaints, opening new lines, and advertising new lines and cultural activities.
Giv-ing satisfactory answers to wishes and complaints
has the highest loading for this factor.
– Importance Factor 6 – Importance of availabil-ity and qualavailabil-ity of the written and visual com-munication materials: This factor includes the availability and content of magazines, image quality of the ship TV and adequacy of informa-tion and clarity of tariff booklets. Availability of
SSC’s magazine has the highest loading for this
factor (Table 16). Table 11. Importance Factor 1 factor loadings
Imp_Factor 1: Importance of quality of physical environment of terminal and affordability
of provided services Factor loading
1.1. general cleanliness of passenger terminal 1.2. attitude of terminal buffet staff
1.3. cleanliness of terminal buffets
1.4. cleanliness of toilets at passenger terminal (hygiene, equipment etc.). 1.5. attitude of other personnel working at terminal
1.6. affordability of terminal buffet
1.7. comfort of terminal (waiting rooms, buffet, telephone, internet, atmosphere, etc.). 1.8. affordability of ticket prices
1.9. product variety and quality of terminal buffets 1.10. ease of accesss to ship from waiting room 1.11. adequacy and clarity of annoncements at terminal
1.12. adequacy of information supplied by passenger terminal staff 1.13. attitude of box office staff
1.14. adequacy of orientation signs for vehicle waiting area 1.15. attitude of passenger terminal security personnel
1.16. general maintenance of passenger terminal building and environmental design 1.17. processing speed at box Office
1.18. content of TV broadcasts at the terminal
1.19. ease of transport to terminal and transfer to other vehicles 1.20. image quality of terminal TV
1.21. safety and security of landing ship and ship boarding
0.860 0.853 0.838 0.816 0.800 0.785 0.784 0.782 0.776 0.771 0.743 0.738 0.736 0.694 0.693 0.670 0.662 0.630 0.576 0.545 0.527 Cumulative loading [%] 22.289
Table 12. Importance Factor 2 factor loadings
Imp_Factor 2: Importance of availability and convenience of transportation Factor loading 2.1. promptness of ship arrival time
2.2. convenience of transportation time 2.3. putting on a new trip if necessary 2.4. frequency of transportation
2.5. regulation of transportation times in accordance with customers’ expectations 2.6. adequacy of information about new and cancelled transportation
2.7. transportation safety and security
2.8. access to authorized ship staff when needed 2.9. noise level during transportation
2.10. attitude and comportment of ship staff 2.11. adequancy information of ship staff
0.779 0.777 0.767 0.765 0.750 0.655 0.580 0.569 0.554 0.529 0.527 Cumulative loading [%] 35.481
Table 13. Importance Factor 3 factor loadings
Imp_Factor 3: Importance of accessibility and adequacy of technology support services Factor loading 3.1. adequacy of information on website
3.2. facility for using website 3.3. up-to-dateness of website
3.4. adequacy of information supplied by call center automatic answering system 3.5. access to call center customer representative
3.6. adequacy of information supplied by call center representative 3.7. ease of using call center automatic answering system
3.8. attitude of call center customer representative 3.9. internet access to website
3.10. access to terminal’s authorized staff when needed
0.853 0.850 0.845 0.815 0.814 0.803 0.801 0.794 0.779 0.669 Cumulative loadings [%] 48.271
Table 14. Importance Factor 4 factor loadings
Imp_Factor 4: Importance of quality of primary service and related physical facilities Factor loading 4.1. adequacy of warning/orientation signs in ship’s passenger halls
4.2. comfort in ship’s passenger halls
4.3. adequacy and clarity of annoncements in ship 4.5. promptness of ship departure times
4.6. comfort of seats in ship’s passenger halls 4.7. general maintenance of ship
4.8. lighting in ship’s passenger halls
4.9. air conditioner and ventilation in ship’s passenger halls 4.10. general cleanliness in ship’s passenger halls
0.770 0.67 0.652 0.647 0.646 0.588 0.587 0.536 0.512 Cumulative loading [%] 57.226
Table 15. Importance Factor 5 factor loadings
Imp_Factor 5: Importance of responsiveness to customer needs Factor loading 5.1. giving satisfactory answers to wishes and complaints
5.2. opening new lines
5.3. access to channels which will forward wishes and complaints from customers 5.4. advertising SSC’s new lines and services
5.5. timely solution of wishes and complaints
5.6. adequacy of SSC’s advertising about cultural and artistic activities
0.744 0.719 0.715 0.709 0.687 0.602 Cumulative loading [%] 64.484
Table 16. Importance Factor 6 factor loadings
Imp_Factor 6: Importance of availability and quality of written and visual communication materials Factor loading
6.1. availability of SSC’s magazine 0.806
6.2. content of SSC’s magazine 0.770
6.3. image quality of ship TV 0.535
6.4. adequacy of information and clarity of tariff booklets 0.529
Cumulative loading [%] 70.690
The differences and similarities among the seg-ments in terms of the six importance factors derived from the factor analysis are also analyzed using ANOVA. Table 17 indicates that here are significant differences at the 0.05 significance level for all importance factors in terms of perceived importance except for Importance
Factor 4 (importance of quality of primary service and related physical facities) and Importance Factor 5 (impor-tance of responsiveness to customer needs). Since the
clus-ter analysis was generated based on the factors derived from the satisfaction of service attributes, this result confirms that the segmentation is also successful in
dis-criminating between the passengers on the basis of the perceived level of importance of the service attributes.
As the Scheffe test shows, Segment 1 (passengers satisfied with continous support and communication) perceives importance of quality of physical environment
in terminal and affordability of provided services (Imp_ Factor 1) significantly more important than Segment 4
(information-prone passengers).
Segment 3 (passengers satisfied with quality of
primary service and comfort) perceives importance of
availability and convenience of transportation (Imp_Fac-tor 2) as more important than Segment 5 (continuous
guidance-focused passengers). Since Segment 3 includes passengers satisfied with quality of the primary service, both the perceived satisfaction and importance levels are in parallel.
On the other hand, perception of importance of
accessibility and adequacy of technology support services
(Imp_Factor 3) differs between Segment 1 (passengers satisfied with continuous support and communication),
Segment 3 (passengers satisfied with quality of primary
service and comfort), Segment 5 (continuous guidance focused passengers) and Segment 6 (passengers satisfied with availability of technology and mass communication based information). The finding that the levels of per-ceived importance of accessibility and adequacy of
tech-nology support services of Segments 6 and 1 are greater
than that of Segments 3 and 5 is a positive finding for the SSC. This shows that passengers who give more im-portance to this factor are also satisfied in terms of the availability of technology, mass communication-based information and continuous support and communica-tion.
Segment 1 (passengers satisfied with continuous
support and communication) perceives importance of
availability and quality of written and visual communi-cation materials (Imp_Factor 6) as being more important
than Segment 6 (passengers satisfied with availability of technology and mass communication-based informa-tion). Since Segment 1 passengers give high importance to availability and quality of written and visual
com-munication materials, and are satisfied with the level of
continuous support and communication, SSC can be considered successful in satisfying these passengers in terms of both factors.
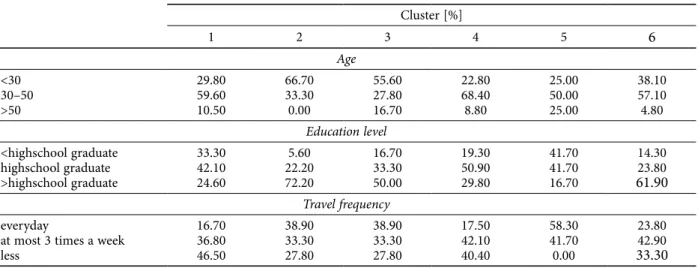
3.3.2. Profile of Segments in Terms of Demographics and Usage-Related Characteristics
Chi-square analysis (Hair et al. 1995) was conducted to determine the profile of each segment in terms of age, gender, educational level and travel frequency. The re-sults of the analysis show that education level (Pearson chi-square = 37.972, p = 0.000), age (Pearson chi-square: 24.227, p = 0.007) and travel frequency (Pearson chi-square = 21.929, p = 0.015, at the p < 0.05 significance level) are significantly related to the segment type. How-ever, there is no significant relationship between gen-der and market segment (Pearson chi-square = 10.095,
p = 0.073, at the p < 0.05 significance level). This may
indicate that the service provided by the SSC perfectly covers all the common satisfaction attributes related to different gender groups.
Table 18 shows that Segment 1 (passengers satis-fied with continuous support and communication) has the highest percentages of passengers aged 30–50, high school graduates and people who travel less than three times a week. Most of the people in Segment 2 (pas-sengers satisfied with the availability of information through technology-based support systems) are aged under 30, have at least a bachelor’s degree and travel every day. Informativeness is important for people who frequently travel. Therefore, we can infer that the com-Table 17. ANOVA results for segments and importance factors (average factor loadings)
Segment 1 Segment 2 Segment 3 Segment 4 Segment 5 Segment 6 Significance
Imp_Factor 1 0.2007922 0.3242883 –0.2190506 –0.48551316 0.52860917 –0.0726521 0.000 Imp_Factor 2 0.0895268 0.174681 0.5093806 –0.16572807 –0.75313 –0.1480693 0.003 Imp_Factor 3 0.207424 –0.36469 –0.82304 –0.0699093 –0.773956 0.279469 0.000 Imp_Factor 4 0.170711 –0.26862 –0.08029 –0.1959728 –0.019577 0.00488 0.188 Imp_Factor 5 0.165625 –0.5149 –0.19478 –0.1111416 –0.135824 0.066324 0.071 Imp_Factor 6 0.1925669 –0.2428822 –0.6918253 0.178768246 0.22310583 –0.4622993 0.000
Table 18. Cluster analysis of demographic characteristics and travel behaviour
Cluster [%] 1 2 3 4 5 6 Age <30 30–50 >50 29.80 59.60 10.50 66.70 33.30 0.00 55.60 27.80 16.70 22.80 68.40 8.80 25.00 50.00 25.00 38.10 57.10 4.80 Education level <highschool graduate highschool graduate >highschool graduate 33.30 42.10 24.60 5.60 22.20 72.20 16.70 33.30 50.00 19.30 50.90 29.80 41.70 41.70 16.70 14.30 23.80 61.90 Travel frequency everyday
at most 3 times a week less 16.70 36.80 46.50 38.90 33.30 27.80 38.90 33.30 27.80 17.50 42.10 40.40 58.30 41.70 0.00 23.80 42.90 33.30
pany is successful in this area. The profile of the major-ity of the passengers in Segment 3 (passengers satisfied with quality of core service and comfort) are aged under 30, have at least a university graduate and are frequent travelers. In Segment 4 (information-prone passengers), the highest values are for those aged 30–50, high school graduates and not very frequent travelers. Continuous guidance-focused passengers (Segment 5) include those aged 30–50, mostly high school graduates and frequent travelers. Since they frequently travel it is expected they are information-prone. Those aged 30–50, holding uni-versity degrees and traveling at most three times a week have the highest percentages in Segment 6 (passengers satisfied with availability of technology and mass com-munication based information).
3.4. Results
The results of the present study have shown that the market can be divided into six segments according to passenger satisfaction levels: Segment 1 (passengers sat-isfied with continuous support and communication);
Segment 2 (passengers satisfied with availability of
infor-mation through technology-based support systems);
Seg-ment 3 (passengers satisfied with quality of core service
and comfort); Segment 4 (information-prone gers); Segment 5 (continuous guidance focused passen-gers), and Segment 6 (passengers satisfied with availabil-ity of technology and mass communication). The largest segment is Segment 1 (114 of 261 passengers), followed by Segment 4 (57 passengers) and Segment 6 (42 passen-gers). The smallest segment is Segment 5 (12 passenpassen-gers).
Due to the growing importance of information dis-semination and customer communication, SSC seems to focus on information-based strategies to satisfy the majority of its customers. In recent years, SSC has been using technology as an important medium to deliver information on its services. Consequently, a high num-ber of passengers are satisfied with SSC in terms of the availability of technology and mass communication-based information. Hence, the SSC was able to increase its passenger numbers satisfied with these attributes, that is, Segments 1, 4 and 6. However, Segment 5 has a limited number of customers satisfied with the support and guid-ance of the terminal personnel and physical facilities. This shows that SSC, as a service provider, failed to de-velop effective strategies about two important marketing mix elements, namely, people and physical environment. A noteworthy fact about Segment 4 (information-prone passengers; 57 passengers), the second largest af-ter Segment 1 (114 passengers). Is those passengers are only satisfied with the availability and quality of infor-mation from written and personal sources, finding the other services insufficient? Since this segment includes a high number of passengers, the SSC needs to create strategies to increase their satisfaction with the other at-tributes.
The smaller segments (Segments 2, 3 and 5) differ from the larger segments according to the perceived im-portances of some attributes. However, they also differ from each other according to other attributes. For
in-stance, Segment 3 (passengers satisfied with the quality of primary service and comfort) gives more importance to the availability and convenience of transportation than
Segment 5 (continuous guidance-focused passengers).
This implies that it is necessary to develop strategies to satisfy the passengers in Segment 3 both in terms of
availability and convenience of transportation and the
quality of the primary service and comfort.
Segment 1 (passengers satisfied with continuous
support and communication) gives more importance to the quality of the physical environment of terminal and
affordability of provided services than Segment 4
(infor-mation-prone passengers). This indicates that satisfying information-prone customers do not depend mostly on the price or physical environment of the primary service.
Chi-square analysis conducted to determine the profile of each segment in terms of demographic and usage-related characteristics shows that, age, education level and travel frequency are significantly related to the types of market segments. Therefore, while developing strategies to increase the satisfaction level of customers, the SSC need not consider gender profiles of its passen-gers but should consider their age, education level, and travel frequency.
Our findings confirm findings of previous studies: (1) as underlined by Lai and Chen (2011), the relation-ships between service quality, perceived value, satisfac-tion, and behavioral intentions suggest important impli-cations for maritime service transportation; (2) in paral-lel with the findings of Ji and Gao (2010), perceptions among passengers differ according to socio-economic group; and (3) supporting the findings of Zhang and Gao (2008), the qualities of physical space and transpor-tation service as well as the impact of personal attributes and preferences are significant components of customer satisfaction in transport services. In other words, service quality, its perceived value and customer satisfaction are closely-related components, and customer satisfaction and the priorities given to different customer service levels vary according to socio-economic or demographic differences (Tarigan et al. 2014).
Conclusions and Further Suggestions
Due to its economy and environmentally friendly na-ture, maritime public transportation is attracting more and more attention and interest worldwide. Increasing the number of customers as well as their travel frequen-cy is one way of stimulating demand for maritime pub-lic transportation. As customer satisfaction increases, both the usage and travel frequency will increase. Thus, developing strategies to increase customer satisfaction should facilitate expansion of the market share of mari-time public transportation.
In the present study, we selected Istanbul, which has the dominant share of domestic maritime passenger transportation in Turkey, as a case study, and proposed different strategies for different groups of maritime transportation passengers based on a survey analysis,
which revealed the state of passenger satisfaction with maritime transportation and its determinants.
Our findings also confirm that passengers’ percep-tion of service attributes – such as service quality, value and importance – directly influences their level of sat-isfaction. Moreover, certain demographic and personal attributes such as socio-economic and demographic fac-tors are also found to impact level of satisfaction. How-ever, the majority of studies on passenger satisfaction focus on a limited standard set of service attributes such as station and transportation vehicle physical conditions, availability, service safety and reliability, perceived price, and accessibility, and satisfaction level of passengers on each dimension. In contrast to previous studies in the literature, this study analyzes the importance of a more extensive set of service attributes and related levels of customer satisfaction. We consider that various service attributes are directly influencing perceived value of the service and consequent satisfaction by integrating find-ings from a wide range of studies on satisfaction in the literature. Furthermore, the findings of this study indi-cate that maritime passengers can be segmented into dif-ferent subgroups according to level of satisfaction and that there are significant differences among the different market segments in terms of age, education level and travel frequency. This infers that not one strategy but a number of different strategies should be implemented to target the different maritime transportation user seg-ments.
Thus, the findings of the present study underline the fact that satisfaction with maritime transportation cannot be analyzed in a generalized format nor can a prescription suitable for all countries be proposed. In fact, the importance given to factors expected to influ-ence the satisfaction level of maritime passengers may vary from country to country as well as among cities within a single country. Therefore, maritime transporta-tion of each country should be analysed in detail and guidelines proposed to address the different customer segments.
Although this study gives important and valuable insights for developing effective strategies to expand the satisfaction with and usage of maritime transportation appropriate for each segment, it has some methodologi-cal limitations and weaknesses. Within this context, as a part of further research, cluster analysis should be con-ducted on the levels of importance assigned by custom-ers to the different service attributes. This would provide more detailed data to decision makers to aid prioritiza-tion of strategies. In other words, those attributes which are given primary importance and from which the low-est level of satisfaction is realized should be the initial focus of the Turkish Maritime Authorities and maritime service providers such as SSC.
Finally, this study could be extended to EU cit-ies attempting to increase the ratio of domestic mari-time passenger transportation to identify differences in priorities of different customer groups and to compare differences in demographic and socio-economic charac-teristics of the passengers.
References
Ambrož, M.; Lotrič, B. 2009. Impact of a mediating role of re-purchase intentions on customer retention, Promet –
Traf-fic &Transportation 21(5): 341–348. http://dx.doi.org/10.7307/ptt.v21i5.249
Anderson, R. E. 1973. Consumer dissatisfaction: the effect of disconfirmed expectancy on perceived product perfor-mance, Journal of Marketing Research 10(1): 38–44. http://dx.doi.org/10.2307/3149407
Anderson, E. W.; Fornell, C.; Lehmann, D. R. 1994. Customer satisfaction, market share, and profitability: findings from Sweden, Journal of Marketing 58(3): 53–66. http://dx.doi. org/10.2307/1252310
Anderson, S.; Pearo, L. K.; Widener, S. K. 2008. Drivers of service satisfaction: linking customer satisfaction to the service concept and customer characteristics, Journal of
Service Research 10(4): 365–381.
http://dx.doi.org/10.1177/1094670508314575
Anderson, E. W.; Sullivan, M. W. 1993. The antecedents and consequences of customer satisfaction for firms, Marketing
Science 12(2): 125–143.
http://dx.doi.org/10.1287/mksc.12.2.125
Anderson, R. E.; Swaminathan, S. 2011. Customer satisfaction and loyalty in e-markets: a PLS path modeling approach,
Journal of Marketing Theory and Practice 19(2): 221–234. http://dx.doi.org/10.2753/MTP1069-6679190207
Bedi, M. 2010. An integrated framework for service quality, customer satisfaction and behavioral responses in Indian banking industry – a comparison of public and private sec-tor banks, Journal of Services Research 10(1): 170–183. Birnerova, E. 2007. Assessment of customer satisfaction in
public transport companies, Promet – Traffic
&Transporta-tion 19(3): 163–166.
Cardozo, R. N. 1965. An experimental study of customer ef-fort, expectation, and satisfaction, Journal of Marketing
Research 2(3): 244–249. http://dx.doi.org/10.2307/3150182 Chen, C.-F. 2008. Investigating structural relationships be-tween service quality, perceived value, satisfaction, and behavioral intentions for air passengers: evidence from Taiwan, Transportation Research Part A: Policy and Practice 42(4): 709–717. http://dx.doi.org/10.1016/j.tra.2008.01.007 Chou, J.-S.; Kim, C.; Kuo, Y.-C.; Ou, N.-C. 2011. Deploying
effective service strategy in the operations stage of high-speed rail, Transportation Research Part E: Logistics and
Transportation Review 47(4): 507–519. http://dx.doi.org/10.1016/j.tre.2010.12.004
Churchill, G. A.; Surprenant, C. 1982. An investigation into the determinants of customer satisfaction, Journal of Marketing
Research 19(4): 491–504. http://dx.doi.org/10.2307/3151722 Culiberg, B.; Rojšek, I. 2010. Identifying service quality dimen-sions as antecedents to customer satisfaction in retail bank-ing, Economic and Business Review 12(3): 151–166. De Oña, R.; Eboli, L.; Mazzulla, G. 2014. Key factors affecting
rail service quality in the Northern Italy: a decision tree approach, Transport 29(1): 75–83.
http://dx.doi.org/10.3846/16484142.2014.898216 Deng, T.; Nelson, J. D. 2012. The perception of bus rapid
tran-sit: a passenger survey from Beijing southern axis BRT line 1, Transportation Planning and Technology 35(2): 201– 219. http://dx.doi.org/10.1080/03081060.2011.651885 EC. 2011a. Statistical Pocketbook 2011: EU Transport in
Fi-gures. 136 p. Available from Internet: http://ec.europa.
eu/transport/facts-fundings/statistics/pocketbook-2011_ en.htm
![Table 3. Distribution of demographic data of interviewed passengers Age [%] 0–24 25–29 30–34 35–39 40–44 45–49 50–54 >55 15.3218.3921.4615.3312.267.665.36 4.22 Gender [%] female male 19.9280.08 Education Level [%]](https://thumb-eu.123doks.com/thumbv2/9libnet/4291945.69251/6.871.430.767.227.629/table-distribution-demographic-interviewed-passengers-gender-female-education.webp)