c
⃝ T¨UB˙ITAK
doi:10.3906/kim-1209-32 h t t p : / / j o u r n a l s . t u b i t a k . g o v . t r / c h e m /
Research Article
Determination of zineb in tap water and tomato samples by adsorptive catalytic
stripping voltammetry
¨
Ozlem KARAKOC¸ ,1 Nuri NAK˙IBO ˘GLU2,∗ 1
Science Education Division, Necatibey Education Faculty, Balıkesir University, Balıkesir, Turkey
2
Chemistry Department, Sciences and Arts Faculty, Balıkesir University, Balıkesir, Turkey
Received: 17.09.2012 • Accepted: 26.01.2013 • Published Online: 16.09.2013 • Printed: 21.10.2013
Abstract: This paper describes a sensitive and accurate adsorptive catalytic stripping voltammetric method for the
determination of zineb (zinc ethylene-bis- dithiocarbamate) in tap water and tomato samples. The method is based on the reduction of adsorbed zineb at a hanging mercury drop electrode following its catalytic oxidation using peroxydisulfate as an oxidizing reagent. Chemical and instrumental parameters of the process were optimized. The catalytic mechanism of the reduction of zineb is discussed as well. The limits of detection (3 s) and quantification (10 s) and linear range of the method for accumulation time of 60 s were calculated as 8.1 nM, 28 nM, and 0.028–7.00 µ M, respectively. The relative standard deviation of the method was 3.68% for 2.5 µ M zineb (N = 5). The proposed method was applied successfully for the determination of zineb in tap water and tomato samples.
Key words: Catalytic, dithiocarbamate, peroxydisulfate, tomato, voltammetry, water, zineb
1. Introduction
Ethylene-bis-dithiocarbamate (EBDCs) fungicides are widely used for preventing crop damage in the field and protecting harvested crops from deterioration during storage and transportation. However, residuals of this kind of compound can cause environmental and human health problems as they have toxic effects on the liver and are carcinogenic. The EBCD group, which can form complex compounds with ions such as Fe+2, Mn+2, Cu+2, Na+, Ni+2, and Zn+2, has more toxic effects.1−3 Zineb (zinc ethylene-bis-dithiocarbamate) (Figure 1) is a slightly yellow, odorless powder used as a fungicide to protect fruit and vegetable crops from a wide range of diseases. It is also used in water-cooling systems, and the sugar and rubber industries. The toxicity of zineb is low to humans and warm-blooded animals. On the other hand, it is toxic to birds and even more so to fish. Detailed information about the toxicity of zineb can be found elsewhere.1 Therefore, determination of residual zineb is quite important in real samples and sensitive and accurate methods are still needed.
Various methods have been reported for determination of zineb in samples by spectrophotometry,3−7 high performance liquid chromatography,8−11 liquid chromatography–mass spectrometry,12 gas chromatography,13 capillary electrophoresis,7 and atomic absorption spectrometry.14 Most of these methods are time-consuming, expensive, and based on indirect determination of zineb. For this reason, they exhibit poor selectivity and inadequate sensitivity. A recent method for determination of zineb and ziram by flow injection-photoinduced-chemiluminescence has been also reported.15 In addition to all of those methods, electrochemical techniques such
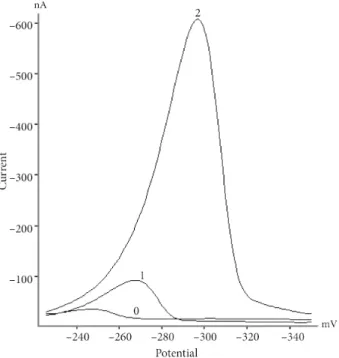
Figure 1. Square wave voltammograms obtained for 3.0 µ M of standard zineb in the absence (1) and presence (2)
of peroxydisulfate ion (2 mM) in acetate buffer at pH 3. The other conditions: accumulation potential: –100 mV, accumulation time: 60 s, waiting time: 5 s, and scan rate: 25 mV/s.
as polarography and voltammetry can be also used for determination of pesticides. A polarographic method has been reported for determination of zineb and maneb (manganese ethylene-bis-dithiocarbamate) in 40% acetone–formamide mixture (4:1).16 Another similar study was performed in potassium chloride and sulfuric acid in 40% acetonitrile–formamide (4:1).17 Yet, both methods suffer from poor sensitivity. A differential pulse polarographic method based on the formation of carbondisulfide and carbonoxysulfide gases has been described by Schwack et al.18 However, the method has poor selectivity because of the hydrolysis of other compounds, such as dithiocarbamate metabolites and amino acids also evolve carbondisulfide. A differential pulse anodic stripping voltammetric method has been reported for determination of ziram using a static mercury electrode.19 The method was applied to rice samples with recoveries of 95%–99%. However, this method is based on indirect determination of ziram using oxidation of zinc in the ziram after the accumulation period. Lin et al. developed a sensitive method derived from the reduction of the adsorbed EBCD group on the electrode surface for determination of zineb by adsorptive stripping voltammetry.2 The electrochemical properties and adsorption behavior of zineb were well-defined in that study. Possible interferences from copper(II), lead(II), cadmium(II), iron(II), hemoglobin, sodium dodecyl sulfate, gelatin, humic acid, and camphor have been also reported. However, there is no information about application of the method in real samples. Therefore, a validated voltammetric method for determination of zineb in real samples seemed necessary. As far as we know, no voltammetric study including the catalytic effect in the presence of an oxidant has been reported in terms of the determination of zineb.
Catalytic waves are an important field in voltammetry due to sensitivity enhancement. It is well known that platinum group metal ions and organic compounds containing nitrogen, oxygen, and sulfur functional groups produce a polarographic catalytic hydrogen wave while transition metal ions give a parallel catalytic wave in
the presence of oxidants such as chlorate, bromate, hydrogen peroxide, nitrate, and nitrite.20 On the other hand, organic substances containing reducible functional groups also generate catalytic waves in the presence of inorganic oxidants such as iodate,21,22 peroxydisulfate,22−24 and dissolved oxygen.25,26 High sensitivity can be achieved when the catalytic effect is combined with adsorption.
The aim of the present study was to develop an accurate and sensitive voltammetric method for deter-mination of zineb in real samples. The method is based on reduction of adsorbed zineb at a HMDE following catalytic reduction by using peroxydisulfate ion as an oxidizing reagent. Chemical and instrumental parameters (pH, type of buffer system and its concentration, ionic strength, concentration of peroxydisulfate, accumulation potential, accumulation time, and stripping mode) were optimized and the method was successfully applied for the determination of zineb in tap water and tomato samples.
2. Experimental
2.1. Apparatus and reagents
Voltammetric measurements were recorded using a Radiometer Pol 150 Polarographic Analyzer in combination with an MDE 150 polarographic stand. The analyzer was controlled by Trace Master 5 Software. A 3-electrode system with a HMDE as a working electrode, Ag/AgCl with saturated KCl as a reference electrode, and a platinum wire as an auxiliary electrode was used. Hexadistilled mercury (Radiometer, Copenhagen, Denmark) was used throughout the study for the HMDE. The surface area of a mercury drop was 0.0197 cm2/drop. A WTW Inolab pH-meter with combined pH electrode was used for pH measurement, and was calibrated with standard buffer solutions before pH measurements. All of the aqueous solutions were prepared with deionized water having resistivity of 18.2 M Ω .
Zineb (Riedel de Haen) solutions were prepared daily by solving 1.1 mg of zineb in 20 mL of 0.05 M chloroacetic acid–chloroacetate buffer solution at pH 3. Peroxydisulfate solution used as oxidizing agent was also prepared daily by dissolving the required amount of K2S2O8 (Merck). The other chemicals used throughout the study were of analytical grade.
2.2. Sample preparation procedure
Tap water samples were analyzed directly. Tomato samples collected from a local market were cut into small pieces with a knife, and then homogenized with a blender. About 20 g of the homogenized tomato sample was weighed into a glass Erlenmeyer flask and 20 mL of acetonitrile was added. The mixture was shaken for 2 h, and then filtered into a volumetric flask under vacuum. The filtrate was washed with 3 mL of acetonitrile 3 times and lastly the volume was completed to 50 mL with acetonitrile.
2.3. Procedure
The general procedure included the transfer of 50 µ L of 0.2 mM of zineb solution (or the required amount of tap water sample or tomato filtrate) into a 10-mL volumetric flask, and the solution was filled to the mark with chloroacetic acid–chloroacetate buffer solution (final concentration 0.05 M and pH 3.0) and 0.1 M KCl solution. The solution was transferred to a quartz voltammetric cell and nitrogen was purged for 5 min. Then accumulation on a new hanging mercury drop was performed at –100 mV by stirring the solution at 400 rpm for 60 s. The stripping was initiated starting from –100 mV toward the cathodic direction by using square wave modulation in quiescent solutions after addition of 100 µ L of 0.1 M of K2S2O8. The instrumental conditions
were as follows: step amplitude, 1 mV; step duration, 0.04 s; pulse amplitude, –25 mV. All of the measurements were performed at room temperature.
3. Results and discussion
3.1. Voltammetric characteristics of the zineb–peroxydisulfate catalytic system
Figure 1 shows square wave adsorptive cathodic stripping voltammograms for adsorbed zineb in the absence and presence of peroxydisulfate ion in chloroacetate buffer at pH 3.0. As seen, a relatively small peak was observed in the absence of peroxydisulfate ion. However, the peak current increased dramatically after addition of 1 mM of peroxydisulfate ion while the peak potential remained nearly unchanged. These behaviors suggested that the reduction of adsorbed zineb in the presence of peroxydisulfate was a catalytic process.
It is well known that the sulfate radical, SO−4 , results from chemical and electrochemical reduction of S2O28−. Standard electrode potentials versus Ag/AgCl (satd. KCl) for S2O28− in aqueous solution were as follows: S2O28−+ 2e→ SO 2− 4 E 0= 1.8V (1) S2O28−+ e→ SO4−.+ SO 2− 4 E 0≤ 0.4V (2) SO−.4 + e→ SO24−E0≥ 3.2V (3)
As the reduction peak potential of zineb in the presence of S2O28− is about –0.3 V, an electrochemical reduction reaction of S2O28− resulting in SO−.4 formation (reaction 2) cannot occur on the electrode surface. However, SO−.4 can be formed after the reaction between the reduction product of zineb and S2O28−. On the other hand, zineb is reduced by 2 electrons and 2 protons, resulting in the addition of 2 protons to the thio groups of the dithiocarbamate molecule. From the information given above, it can be concluded for the reduction process that zineb adsorbed to the electrode surface is firstly reduced by 2 electrons and 2 protons; then S2O28− and its intermediate product SO−.4 oxidize together the reduced dithiocarbamate molecule back to zineb. After that, the re-oxidized zineb is reduced again by completing the catalytic cycle. The following parallel catalytic mechanism can be suggested:
This catalytic process could be further confirmed by plotting the current versus various concentrations of S2O28−. The peak current obtained in the presence of S2O28− was linearly proportional to the square root of the concentration of S2O28− in the range of 0.1–2.5 mmol/L. The regression equation was ip= 3.6518C1/2+
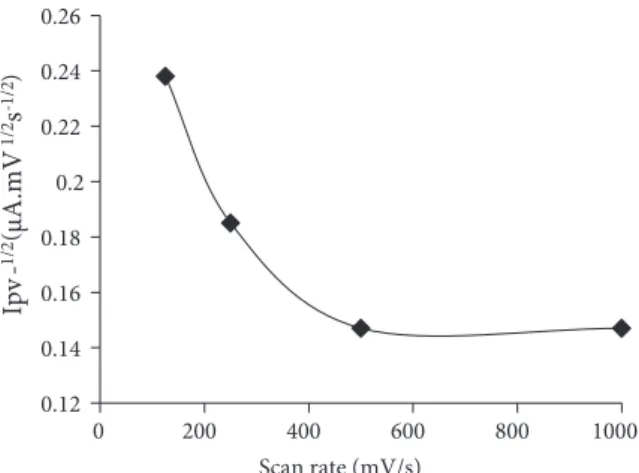
4.5741 (r = 0.9955, n = 8). At values higher than 2.5 mmol/L S2O28− concentrations, no peak was observed belonging to the catalytic system due to the oxidation of mercury on the electrode by S2O28−. For this reason, the concentration of S2O28− was selected as 2 mmol/L. The catalytic effect of KClO3 and KBrO3 was also tested for catalytic reduction of zineb at various pHs. The obtained results showed that only S2O28− caused a significant catalytic effect in chloroacetate buffer at pH 3.0. Therefore, S2O28− was selected as the best oxidant. On the other hand, the current function, Ipv−1/2, of the catalytic peak decreased with the potential scan rate,
v, in the range of 125–500 mV s−1 and then leveled off in the range of 500–1000 mV s−1 (Figure 2). The results also suggested a catalytic process.
CH2CH2 NH HN C S C S S S Zn + 2H+ + 2e -CH2CH2 NH HN C S C S HS SH + Zn2+ CH2CH2 NH HN C S C S HS SH + Zn2+ + S2O8 2-CH2CH2 NH HN C S C S S S Zn + SO4 + SO4 2- + 2H+ CH2CH2 NH HN C S C S HS SH + Zn2+ + SO4 CH2CH2 NH HN C S C S S S Zn + SO42- + 2H+ Zn-RS2 + 2H + +2e -R(SH)2 + Zn2+ S2O82-, SO4
3.2. Effect of pH, buffer system, and ionic strength
The effect of pH on the peak current of the adsorbed zineb in the presence of S2O28− was studied in the range of 2.5–7.0 as no significant signal related to zineb was obtained below pH 2.5 (Figure 3). The peak current increased dramatically with the increase in pH from 2.5 to 3.0 and gave a maximum at this pH, and then gradually decreased toward the higher pH. A negative shift in the peak potential was observed as the pH increased. These results suggest that the catalytic process was dependent on pH, and pH 3 is a critical parameter of sensitivity. Additionally, various buffer systems such as Britton–Robinson buffer, phosphoric acid– dihydrogen phosphate buffer, acetic acid–acetate buffer, and chloroacetic acid–chloroacetate buffer at pH 3 were tested. Among these, the highest peak current was observed in chloroacetic acid–chloroacetate buffer, and thus it was selected for subsequent experiments. Furthermore, the concentrations of chloroacetic acid–chloroacetate buffer at 0.01, 0.025, 0.050, 0.075, and 0.100 M were studied, and 0.05 M was found to be optimum. On the other hand, the effect of ionic strength was also considered using KCl in the range of 0.05–0.25 M and the maximum peak current was obtained in the case of 0.10 M KCl.
3.3. Effect of accumulation potential
The dependence of the peak current on the accumulation potential for 1 µ M of zineb in chloroacetic acid– chloroacetate buffer at pH 3.0 is given in Figure 4. The peak current increased up to accumulation potential of –100 mV and then decreased at more negative potentials. No change in the peak potential was observed as the accumulation potential increased in negative directions. Therefore, –100 mV was chosen as the accumulation potential. Additionally, differential pulse (DP) and square wave (SW) were studied to determine the stripping mode. SW mode was selected because of obtaining the highest peak current and the speed of measurement.
0.12 0.14 0.16 0.18 0.2 0.22 0.24 0.26 0 200 400 600 800 1000 Ipv -1 /2 µA .m V 1 /2s -1 /2 Scan rate (mV/s) ) ( 0 50 100 150 200 250 300 350 400 450 500 2.00 3.00 4.00 5.00 6.00 7.00 8.00 P eak h ei gh t (n A ) pH
Figure 2. Dependence of current function on the
poten-tial scan rate.
Figure 3. The effect of pH on peak current in
Britton-Robinson buffer at various pHs. Conditions: concentration of zineb = 1 µ M, concentration of S2O28 = 2.0 mM, tacc
= 60 s, scan rate = 25 mV/s.
3.4. Effect of accumulation time
Figure 5 shows the effect of accumulation time on the peak current at –100 mV of accumulation potential. The peak current increased with the accumulation time up to 90 s, and then remained constant due to the saturation of the electrode surface. This increase in the peak current shows also that zineb had an adsorptive characteristic at the hanging mercury drop electrode.
0 200 400 600 800 1000 1200 1400 -350 -300 -250 -200 -150 -100 -50 0 P eak h ei gh t (n A ) E (mV) 0 200 400 600 800 1000 1200 0 50 100 150 200 250 P eak h ei gh t (n A ) Time (s)
Figure 4. The effect of accumulation potential on peak
current in 0.05 M ClAcH/ClAc− buffer at pH 3. Other conditions are as in Figure 2.
Figure 5. The effect of accumulation time on peak
cur-rent. Conditions: concentration of zineb = 1 µ M, concen-tration of S2O28 = 2.0 mM, supporting electrolyte = 0.05
mol/L ClAcH/ClAc− buffer (pH = 3.0), Eacc = 100 mV, scan rate = 25 mV/s.
3.5. Validation and application of the method
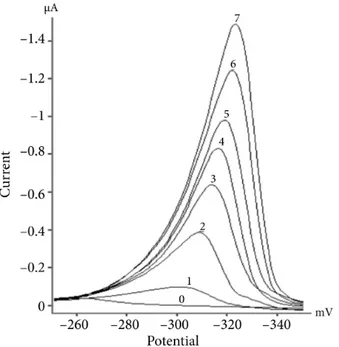
Under the optimum conditions achieved, a calibration graph was constructed for determination of zineb by using peak heights as analytical response. Voltammograms used for the calibration graph are shown in Figure 6. The calibration graph for the accumulation time of 60 s was linear in the concentration range of 0.027–7.00 µ M (7.2–1925 µ g/L) and obeyed the equation Ip = 211.61CZ (±14.67) – 38.98 (±57.91), where Ip and CZ are
the peak current (in nA) and the concentration of zineb (in µ M), respectively. The correlation coefficient was 0.998 (for n = 8). The limit of detection (3 s) and the limit of quantification (10 s) based on standard deviation of blank response (for N = 5) were estimated as 7.94 nM (2.2 µ g/L) and 26.46 nM (7.2 µ g/L), respectively. The relative standard deviation for 2.5 µ M zineb concentration was 3.68% (for N = 5). On the other hand, a calibration graph was also constructed under the conditions given in the literature2 for determination of zineb for 60-s accumulation time in the absence of S2O28− by adsorptive stripping voltammetry. The calibration graph with correlation coefficient of 0.992 obeyed the equation Ip = 40.18 (±4.50)CZ –16.74 (±17.75). The
results show that the calibration sensitivity of the adsorptive stripping voltammetric determination of zineb improved more than 5-fold for accumulation time of 60 s by using the catalytic effect of S2O28−.
Figure 6. Some voltammograms used for construction of the calibration curve. (0) Blank solution containing 0.05
mol/L ClAcH /ClAc−, 0.1 M KCl, 2 mM K2S2O8, and upon addition of standard zineb solution to be (1) 1 µ M, (2)
2 µ M, (3) 3 µ M, (4) 4 µ M, (5) 5 µ M, (6) 6 µ M, (7) 7 µ M.
Interference by Cd2+, Cu2+, Pb2+, and humic acid was investigated. The signal of 4 µ M of zineb disappeared in the presence of 2 µ M Cu2+. In addition, 4 µ M Cd2+, 4 µ M Pb2+, and 4 ppm humic acid caused 17%, 56%, and 68% signal decrease, respectively.
The proposed method was applied to 3 different tap water samples and 2 different tomato samples. No zineb was detected in any of the tap water samples while it was found in 1 of the tomato samples. All of the samples were spiked with zineb in various concentrations to check the accuracy of the proposed method. Determinations of zineb were performed using the standard addition method. The results obtained are presented in the Table. The recoveries for water samples and tomato samples were found to be in the range of 90%–112% and 94%–103%, respectively. The obtained recoveries are comparable to the results reported for ziram in rice samples in the literature.19 Those results demonstrate and confirm that the method can be applied for selective and accurate determination of zineb in water and tomato samples.
Table. Results obtained for the tap water and tomato samples.
Samples Zineb added Zineb found ¯x± s Recovery %
(µM) (µM) (N = 5)
*TW1 0.7 0.73± 0.12 105
TW2 2.5 2.80± 0.17 112
TW3 4.5 4.05± 0.27 90
Samples Zineb added Zineb found ¯x± s Recovery % (µg/g) (µg/g) (N = 5)
*T1 - 0.98± 0.11
5.0 5.70± 0.39 94
T2 - nd
-5.0 5.15± 0.48 103
*Abbreviations TW and T represent tap water and tomato samples, respectively
4. Conclusions
It is demonstrated that the sensitivity of the adsorptive stripping voltammetric method for determination of zineb can be improved by using the catalytic effect of peroxydisulfate ion. The proposed method differs from the adsorptive stripping voltammetric method given in the literature2 in terms of instrumental and solution parameters. The zineb–peroxydisulfate catalytic system was used for the first time in voltammetry and a catalytic mechanism of the reduction of zineb in the presence of peroxydisulfate ion was also suggested. The calibration sensitivity of the existing adsorptive stripping method was enhanced more than 5-fold for an accumulation time of 60 s by using the catalytic effect of peroxydisulfate ion. The detection limit of the method can be improved further in the case of a deposition time longer than 60 s. The method can be recommended for the sensitive and accurate determination of zineb in water and tomato samples.
Acknowledgments
This study was financially supported by the Research Project Unit of Balıkesir University (contract no: 2007/4). The authors would like to thank the Balıkesir University Research Center of Applied Sciences for providing laboratory facilities to carry out this study.
References
1. Extension Toxicology Network, Pesticide Information Profile, Zineb.
http://pmep.cce.cornell.edu/profiles/extoxnet/pyrethrins-ziram/zineb-ext.html. [last accessed 12.09.2012]. 2. Lin, M. S.; Jan, B. I.; Leu, H-J.; Lin, J. S. Anal. Chim. Acta. 1999, 388, 111–117.
3. Malik A. K.; Sharma, V.; Sharma, V.; Rao, A. L. J. K. J. Agr. Food Chem. 2004, 52, 7763–7767. 4. Agrawal, V.; Shivhare, P.; Gupta, V. K. Fresenius J. Anal. Chem. 1992, 344, 350–352.
5. Walash, M. I.; Belal, F.; Metwally, M. E.; Hefnawy, M. M. Food Chem. 1993, 47, 411–416. 6. Kesari, R.; Gupta, V. K. Talanta 1998, 45, 1097–1102.
7. Malik, A. K.; Faubel, W. Talanta 2000, 52, 341–346.
8. Gustafsson, K. H.; Thompson, R A. J. Agr. Food Chem. 1981, 29, 729–732.
9. Jongen, M. J. M.; Ravensberg, R. E.; Leenheers, L. H. J. Chromatogr. Sci. 1991, 29, 292–297. 10. Lo, C-C.; Ho, M-H.; Hung, M-D. J. Agr. Food Chem. 1996, 44, 2720–2723.
11. Weissmahr, K. W.; Houghton, C. L.; Sedlak, D. L. Anal. Chem. 1998, 70, 4800–4804. 12. Hanada, Y.; Tanizaki, T.; Koga, M.; Shiraishi, H.; Soma, M. Anal. Sci. 2002, 12, 441–444.
13. Vryzas, Z.; Papadakis, E. N.; Papadopoulou-Mourkidou, E. J. Agr. Food Chem. 2002, 50, 2220–2226. 14. Turker, A. R.; Sezer, B. Turk. J. Pharm. Sci. 2005, 2, 35–42.
15. Lopez Paz, J. L.; Catala-Icardo, M. Anal. Chim. Acta 2008, 625, 173–179. 16. Rao, A. L. J.; Verma, N. Bull. Electrochem. 1990, 6, 439–441.
17. Malik, A. K.; Rao, A. L. J. J. Indian Chem. Soc. 1998, 75, 491–492.
18. Schwack, W.; Br¨uger, B.; Nyanzi, S. Fresenius J. Anal. Chem. 1995, 351, 297–300.
19. Mathew, L.; Reddy, M. L. P.; Rao, T. P.; Iyer, C. S. P.; Damodaran, A. D. Talanta 1996, 43, 73–76. 20. Bobrowski, A.; Zarebski, J. Electroanalysis 2000, 12, 1177–1186.
21. Guo, W.; Yang, Y.; Song, J. Anal. Lett. 2000, 33, 847–859. 22. Song, J.; He, P.; Guo, W. Anal. Lett. 2001, 34, 1677–1688. 23. Song, J.; He, P.; Guo, W. J. Elec. Chem. 2001, 511, 31–38. 24. Song, J.; He, P.; Guo, W. Anal. Biochem. 2002, 304, 212–219.
25. Y. Ding, J. Li, J. Fei, Ding, Y., Li, J.; Fei, J. Microchim. Acta 2005, 150, 125–130. 26. Li, J.; Gao, P.; Li, X.; Yan, Z.; Mao, X. Sci. China Ser. B Chem. 2005, 48, 442–448.