A selective approach to index term weighting for robust
information retrieval based on the frequency distributions
of query terms
Ahmet Arslan1 · Bekir Taner Dinçer2
Received: 15 October 2017 / Accepted: 4 December 2018 / Published online: 13 December 2018 © Springer Nature B.V. 2018
Abstract
A typical information retrieval (IR) system applies a single retrieval strategy to every infor-mation need of users. However, the results of the past IR experiments show that a par-ticular retrieval strategy is in general good at fulfilling some type of information needs while failing to fulfil some other type, i.e., high variation in retrieval effectiveness across information needs. On the other hand, the same results also show that an information need that a particular retrieval strategy failed to fulfil could be fulfilled by one of the other exist-ing retrieval strategies. The challenge in here is therefore to determine in advance what retrieval strategy should be applied to which information need. This challenge is related to the robustness of IR systems in retrieval effectiveness. For an IR system, robustness can be defined as fulfilling every information need of users with an acceptable level of satisfac-tion. Maintaining robustness in retrieval effectiveness is a long-standing challenge and in this article we propose a simple but powerful method as a remedy. The method is a selec-tive approach to index term weighting and for any given query (i.e., information need) it predicts the “best” term weighting model amongst a set of alternatives, on the basis of the frequency distributions of query terms on a target document collection. To predict the best term weighting model, the method uses the Chi-square statistic, the statistic of the Chi-square goodness-of-fit test. The results of the experiments, performed using the offi-cial query sets of the TREC Web track and the Million Query track, reveal in general that the frequency distributions of query terms provide relevant information on the retrieval effectiveness of term weighting models. In particular, the results show that the selective approach proposed in this article is, on average, more effective and more robust than the most effective single term weighting model.
Keywords Chi-square goodness-of-fit · Index term weighting · Robustness in retrieval effectiveness · Selective information retrieval
* Ahmet Arslan
[email protected] Bekir Taner Dinçer [email protected]
1 Computer Engineering Department, Eskişehir Technical University, 26555 Eskişehir, Turkey 2 Computer Engineering Department, Muğla Sıtkı Koçman University, 48000 Muğla, Turkey
1 Introduction
An information retrieval (IR) system is supposed to fulfil every information need of users with an acceptable level of satisfaction, where a posed information need is a query that may be formulated by any inquirer. Given a set of queries, high average retrieval effective-ness is, in this respect, necessary but not the sufficient criterion. An IR system may have relatively a high level of retrieval effectiveness on average, while it makes abject failures for a few queries. Averaging over a set of queries would in general hide the per-query effec-tiveness of IR systems (Voorhees 2004).
In addition to high average retrieval effectiveness, an IR system should also be robust in per-query effectiveness, robust in the sense of making no abject failure for any query. We argue, in this study (Sect. 2), that robustness in per-query effectiveness can be maintained by means of a selective approach that predicts what retrieval strategy should be applied to which query, assuming that some retrieval strategy performs well on one query but poorly on a second, while other strategies may perform poorly on the first query, but succeed on the second (Buckley 2009).
In this article, we propose a selective approach to index term weighting (Sect. 3). The approach is of pre-retrieval type, where the model selection is made before the actual search takes place. It predicts the best model amongst a set of 8 well-established probabil-istic term weighting models, including BM25, PL2, DFRee, DPH, DLH13, LGD, DFI and the language model with Dirichlet smoothing (DLM). For any given query, the best model is determined by utilizing only one source of information, the frequency distributions of (query) terms on the target document collection. As a feature, term frequency distributions relate the underlying assumptions of probabilistic term weighting models to queries, and hence it provides information on the expected effectiveness of the models.
The contributions of the work presented in this paper can be summarized as given by: • A query-based selective term weighting algorithm that predicts the best index term
weighting method, for any given query, among a predefined set of index term weighting methods (Sect. 3).
• An empirical justification in support for the claim that the probabilistic index term weighting models can be characterized with respect to retrieval effectiveness on the basis of the frequency distributions of query terms on documents.
From the results of the experiments presented in this article (Sect. 4), we observe that the proposed approach is on average more effective and also more robust than that of the 4 well-formed baselines considered, including the current state-of-the-art selective approach to index term weighting in the IR literature (He and Ounis 2003b, 2004). On the other hand, we note, also, that there is still room for improvement in this research direction. On this account the experimental results reveal that the proposed approach shows a signifi-cantly lower performance on average than an optimal/oracle approach that could predict the most effective model for any given query, with 100% accuracy. We speculate the reasons behind the latter observation, and discuss the possible improvements over the proposed approach, in the discussion section (Sect. 5).
The experimental evaluations presented in this article is performed using the set of 200 queries released from the TREC Web track studies performed between the years 2009 and 2012, and the set of 562 queries released from the TREC Million Query (MQ) track study in 2009. The official document collection used in those two studies is called “ClueWeb09
collection” (Callan et al. 2009). For the set of 200 TREC Web track queries, we use the English portion of the ClueWeb09 collection consisting of about 500 million English Web pages, and for the set of 562 MQ track queries, the Category B subset of the English por-tion consisting of about 50 million English Web pages. These subsets are the original sub-sets used in the corresponding TREC tracks. The details of the data sub-sets and the experi-mental setup are given in “Appendix.”
2 Motivation
The reliable information access (RIA) workshop1 is the pioneering effort to investigate the
factors that affect the variability in retrieval effectiveness, where the goal is to perform a per-query failure analysis of individual IR systems (Harman and Buckley 2004). A major result from the RIA workshop is that most of the failures could in fact be fixed by applying an existing retrieval strategy. On this account, Harman and Buckley (2009) state, later on, that “it may be more important for research to discover what current techniques should be applied to which topics [i.e. queries], rather than to come up with new techniques.”
Selective information retrieval is in theory capable of fulfilling every information need of users, with a level of satisfaction that the current IR strategies could together provide. Table 1, for instance, lists the 50 TREC 2012 Web track queries along with the Table 1 The highest nDCG@100 scores observed for 50 TREC 2012 Web Track queries over all of the participating IR systems
The average is 0.4239
Query Run nDCG Query Run nDCG Query Run nDCG
151 uogTrA44xu 0.4090 168 uogTrA44xi 0.9145 185 QUT..Bline 0.3118
152 uogTrA44xl 0.5066 169 QUT...TQEg1 0.5144 186 uogTRA44xu 0.6683
153 qutwa 0.3870 170 manualSTA 0.3307 187 qutwa 0.2392
154 uogTrB44xu 0.4634 171 autoSTB 0.3221 188 2012b...d8 0.3223
155 uogTrA44xl 0.4560 172 comb...CatB 0.2996 189 ICT...ADR1 0.7205
156 ICT...DVR3 0.3461 173 utw...lm09 0.4715 190 uogTrA44xi 0.4321
157 uogTrB44xu 0.4896 174 uogTrB44xu 0.4987 191 src...12c10 0.4105
158 DFalah121A 0.5088 175 uogTrB44xu 0.3031 192 src...12c10 0.3581
159 lcmweb10p 0.7799 176 comb...CatB 0.4908 193 QUT...Bline 0.5737
160 uogTrA44xu 0.2308 177 src...12c00 0.4468 194 qutwb 0.3331
161 ICT...ADR2 0.1897 178 uogTrA44xu 0.5443 195 autoSTB 0.3699
162 lcm4res 0.0560 179 uogTrA44xl 0.2699 196 DFalah120A 0.7029
163 uogTrB44xu 0.5952 180 DM...CatASP 0.2077 197 autoSTA 0.4311
164 QUT...TQEg1 0.3365 181 utw2012fc1 0.2700 198 uogTrB45aIs 0.4296
165 ICT...DVR3 0.4855 182 uogTrA44xu 0.3606 199 lcm4res 0.3114
166 lcmweb10p 0.2572 183 uogTrA44xi 0.2351 200 uogTrB44xu 0.5266
167 uogTrB45aIs 0.3202 184 uogTrB44xu 0.7543
highest observed nDCG@100 scores over all of the participating IR systems. The aver-age of the per-topic highest nDCG@100 scores over the 50 queries is 0.4239. The mean nDCG@100 score of the most effective IR system participating in the TREC 2012 Web track is 0.2784. For this instance, selective information retrieval is, therefore, capable of being nearly as twice as more effective than the most effective single IR system, on average.
In the context of selective information retrieval, it is presumed that a query that a particular retrieval strategy failed to fulfil can be fulfilled by one of the other exist-ing retrieval strategies. Basically, the success of any selective approach depends on to what degree this fundamental assumption holds true in practice. As seen in Table 1, the assumption holds true for the TREC 2012 Web track queries.
Actually, the truth value of this assumption, in turn, depends on the richness or diver-sity of the alternative retrieval strategies among which the selection will be made, sim-ply because similar retrieval strategies would in general show similar performances on the same queries. In this respect, it can be said, in general, that the potential retrieval effectiveness of any selective approach increases, as the number of distinct retrieval strategies increases.
In the TREC 2012 Web track, the total number of participating IR systems is 48 and the number of distinct systems yielding the highest nDCG@100 scores for the 50 que-ries in Table 1 is 24. This means that a set of 24 distinct retrieval strategies is diverse enough to be as twice as more effective than the state-of-the-art TREC 2012 IR system, on average.
A full-fledged IR system, such as the systems participating in the TREC Web track, usually employs a multi-stage retrieval strategy (Mackenzie et al. 2018), including query expansion techniques, index term weighting models, learning-to-rank techniques, spam filtering, etc. Index term weighting is the core component of such multi-stage retrieval strategies, since it quantifies the degree of relevance between a document and a given query. Thus, the resulting effectiveness of any retrieval strategy basically depends on the effectiveness of the index term weighting model in use. In this respect, it can be said that the key to effective retrieval is to determine what index term weighting model should be applied to which query.
In this study, we consider a set of probabilistic term weighting models that is diverse enough to cover the major methods in the IR literature, including the informa-tion theoretic models (e.g. LGD), the language model (e.g. DLM), the divergence from Table 2 The 8 probabilistic index term weighting models and the probability distributions that each model assumes for the frequency distributions of (query) terms
No Model Distribution References
1 BM25 Two-Poisson distribution Robertson and Zaragoza (2009)
2 DLM Binomial/multinomial distribution Zhai and Lafferty (2004)
3 DFIC Empirical distribution Kocabaş et al. (2014)
4 DFRee Hypergeometric distribution Amati (2009)
5 DLH13 Hypergeometric distribution Amati (2006)
6 DPH Hypergeometric distribution Amati (2006)
7 LGD Log-logistic distribution Clinchant and Gaussier (2010, 2011)
randomness models (e.g. PL2, DFRee, DPH and DLH13), the divergence from inde-pendence models (e.g. DFIC) and the Harter’s two Poisson model (e.g. BM25). The models under consideration are listed in Table 2, along with the probability distribu-tions that each model assumes.
Table 3 lists the same TREC 2012 Web track queries along with the highest observed nDCG@100 scores over those term weighting models. The average of the per-topic highest nDCG@100 scores is 0.1760. The most effective model is “PL2” and the corresponding mean nDCG@100 score is 0.1368. This means that, for the term weighting models, an optimal selective approach could provide nearly 50% increase in average nDCG@100 score, compared to the most effective, single term weighting model.
Table 3 also shows the within-query performance variations among the 8 term weighting models, i.e. the column labeled as “CoV.” Here, within-query performance variation is expressed as a standardized measure of dispersion, called the “Coefficient of Variation” in statistics. For each query in Table 3, the associated “CoV” value refers to the ratio of the standard deviation (s) of the 8 models’ within-query nDCG@100 scores to the corresponding mean ( 𝜇 ) of the scores, i.e., s∕𝜇 . For this reason, “Coef-ficient of Variation” is also known as relative standard deviation, i.e., s “relative” to 𝜇 . In the current context, “Coefficient of Variation” can be interpreted as how informative a query is, with respect to the performance differences between the 8 term weighting models under consideration. Since “Coefficient of Variation” is a standardized measure of dispersion, CoV values can be compared with each others. In other words, two que-ries with different within-query mean scores may have the same CoV value, and hence they can provide equal information on the within-query rankings of 8 term weighting models, irrespective of the mean scores. A “supervised” selective approach to index term weighting is, thus, likely to benefit more from the queries with high CoV values than the queries with low CoV values.
In addition to improved average retrieval effectiveness, selective approaches are also capable to provide robustness, in a way that the “Risk-Sensitive” measures of IR can quantify (Collins-Thompson 2009). Risk-sensitive measures assess the extend to which a system is more effective for a given query than a baseline system. For any given query, baseline effectiveness can, in general, be thought of as the level of performance that a state-of-the-art IR system would, on average, show for that query. In this respect, as the per-query effectiveness of an IR system increases, the level of robustness of the system increases. In particular, Table 3 represents an instance of the highest level of robustness, in terms of nDCG@100, that an optimal selective approach could achieve by using the 8 index term weighting models under consideration. Similarly, Table 1 represents an instance of the highest level of robustness, with respect to full-fledged IR systems. This notion of robustness can directly be quantified by using the Geometric Risk measure, “GeoRisk” (Dinçer et al. 2016), as demonstrated in Sect. 4—Results.
Although the uncertainty associated with a selective approach to index term weight-ing is relatively high (i.e., for the case of 8 term weightweight-ing models it is 87.5%) and the per-query expected effectiveness of a term weighting model is difficult to estimate, probabilistic term weighting models have a common property that in fact enables selective term weighting. Every probabilistic term weighting model makes an assump-tion (Table 2) about the shape of the frequency distributions of terms on documents and this property can be exploited in selective term weighting, as explained in the next section.
Table 3 The highes t nDCG@100 scor es obser ved f or 50 TREC 2012 W eb T rac k q uer ies o ver t he eight inde x ter m w
eighting models under consider
ation The a ver ag e is 0.1760 Quer y Model nDCG CoV (%) Quer y Model nDCG CoV (%) Quer y Model nDCG CoV (%) 151 BM25 0.3438 17 168 BM25 0.7548 8 185 DFR ee 0.0676 122 152 DPH 0.0130 2 169 DFIC 0.3212 79 186 DFR ee 0.1012 45 153 DPH 0.1880 36 170 BM25 0.0774 72 187 DFIC 0.0795 27 154 DPH 0.0731 46 171 DPH 0.2696 19 188 BM25 0.0289 93 155 DFR ee 0.4532 10 172 PL2 0.1181 52 189 DLH13 0.2333 91 156 DFIC 0.1504 55 173 PL2 0.4038 30 190 BM25 0.2609 18 157 DFIC 0.1321 134 174 PL2 0.1578 25 191 DLM 0.3078 26 158 PL2 0.3147 51 175 LG D 0.0778 103 192 DLH13 0.1456 73 159 DLH13 0.2082 24 176 BM25 0.0468 125 193 DFR ee 0.1948 6 160 DPH 0.1753 283 177 BM25 0.2298 68 194 BM25 0.2395 50 161 LG D 0.0084 138 178 BM25 0.3106 9 195 BM25 0.0332 44 162 DFR ee 0.1038 103 179 DFIC 0.1214 44 196 DPH 0.1350 39 163 DFR ee 0.0834 57 180 DFR ee 0.0096 27 197 LG D 0.2767 21 164 DFR ee 0.0042 77 181 BM25 0.0275 42 198 DPH 0.0981 13 165 LG D 0.4371 13 182 DFIC 0.0773 38 199 LG D 0.0643 2 166 DLM 0.1503 31 183 DFIC 0.0090 54 200 PL2 0.3271 21 167 DPH 0.0606 39 184 PL2 0.2921 64
3 The proposed selective approach to index term weighting
The key to success in selective term weighting is to determine a source of information that explains the variation in the retrieval effectiveness of individual term weighting models across queries. In other words, retrieval effectiveness of term weighting models should, somehow, be related to the characteristics of queries, in a way that permits to predict the model that is most likely to show the highest performance for any given query. Here, we argue that one of the primary sources of information for this purpose is the observed fre-quency distributions of query terms on the document collection in use.
A simple but powerful selective approach to index term weighting can be built upon pairwise query similarity, as demonstrated in the inspiring works of He and Ounis (2003b, 2004). In this approach, it is assumed that the same term weighting model will show simi-lar levels of effectiveness for two queries that are simisimi-lar to each other in terms of some measurable query characteristics. Application of such an approach can vary in practice depending on the measure of similarity to be adapted and the query characteristics to be chosen for similarity measurements. For instance, He and Ounis (2004) use Euclidean distance as the measure of similarity, and the vectors of 3 query properties for similarity measurements, where the properties are (1) the number of terms in a given query, (2) the number of documents that contain at least one of the query terms, and (3) the ratio of the minimum Inverse Document Frequency (IDF) to the maximum IDF associated with the query terms.
In this study, we use only a single query property, the frequency distributions of query terms, and, as the similarity measure, we use the Chi-square statistic.
3.1 The Chi‑square statistic as a query similarity measure
We claim that frequency distributions of query terms on documents, as a query characteris-tic, can explain the variation in the retrieval effectiveness of individual index term weight-ing models across queries. The underlyweight-ing theoretical basis for this claim is simple and it can be expressed as follows. Every probabilistic term weighting model assumes a particu-lar probability distribution (e.g., Poisson, Geometric, etc.) for the observed term frequen-cies on documents (i.e. empirical distribution). Such an assumed probability distribution characterizes the corresponding term weighting model, with respect to the degree of rel-evance to be quantified by the model, given a pair of document and query. Thus, for any given query, it is expected that the effectiveness of a probabilistic term weighting model will be proportional to the degree of the goodness-of-fit between the assumed probability distribution and the actual distribution of term frequencies on documents. This implies that any probabilistic term weighting model would show similar performances for the queries that are similar to each others with respect to the term frequency distributions. Indeed, the results of the experiments presented in Sect. 4 provide empirical evidence in support of this claim.
To measure the similarity in distribution between two queries, we use the Pearson’s Chi-square statistic. The Chi-square statistic, which is the test statistic of the Chi-square goodness-of-fit test (Agresti 2002; Press et al. 2007), can be expressed for the frequency distributions of two (query) terms, t1 and t2 , as given by:
(1) 𝜒2= n ∑ i=0 [Ft 1(i) − Ft2(i) ]2 Ft1(i) + Ft2(i)
In Eq. 1, n denotes the number of relative frequency groups taken into account (i.e. n= 1000 ), and Ft1(i) and Ft2(i) ( i = 0, 1, 2, … , n ) refers to the observed document density
at the ith bin for the terms t1 and t2 , respectively. In particular, Ft1(0) and Ft2(0) refer to the
density of the documents at the relative term frequency value of 0 for t1 and t2 , respectively.
Here, a low 𝜒2 value implies a high degree of goodness-of-fit, where 𝜒2= 0 refers to the
perfect fit between two term frequency distributions. It is worth noticing, here, that, for any term t, the document density at 0, Ft(0) is proportional to the inverse document frequency
(IDF) of the term t.
Every probabilistic term weighting model applies some form of normalization to within-document raw term frequencies (He and Ounis 2003a, 2005), in order to avoid bias-ing towards long documents in quantifybias-ing the relevance of a document to the query given. The reason behind this practice can be explained as follows. A term may occur in two documents with the same value of frequency, but the documents would in general be differ-ent in length from each others. On the other hand, for any given term, it is expected that the number of occurrence of the term would increase, as the length of the document increases. Probabilistic term weighting models assume that the number of occurrence of a query term in a particular document is proportional to the relevance of the document to the query. This means that longer documents are more relevant than shorter documents to any given query, which in fact is not always true. Hence, in order to make such frequency values comparable with each others across documents, probabilistic term weighting models employ “docu-ment length normalization.” For this purpose, we use relative term frequencies, i.e. the ratio of the number of occurrences of a term in a document to the length of the documents.
Here, raw term frequencies constitute a discrete distribution, while, in contrast, relative term frequencies constitute a continuous distribution. The Chi-square statistic can only be applied to discrete distributions. Thus, for any given term, the calculated relative frequen-cies should be grouped into a finite number of bins, in order to obtain the required discrete distribution. According to our normalization scheme, relative term frequencies can vary in between 0 and 1. Except for the relative frequency value of 0, we divided that range into 1000 intervals of equal length: (0.000–0.001], (0.001–0.002], and so on. The case of the value 0 is special because, in contrast to those 1000 bins, it refers to the density of the documents that the term under consideration does not occur in. In query similarity meas-urements, we take into account both the relative frequency value of 0 (as a separate group) and the relative frequency values grouped into 1000 bins, so that the calculated relative fre-quencies for any given term sum up to 1 over all of the documents in the target collection, i.e. in order to obtain a formal probability distribution.
Figure 1 illustrates the relative frequency distribution of the terms family, for, of and wedding, where the relative frequency value of 0 is excluded for the ease in interpretation.2
The observed frequency distributions of family and wedding are quite different from that of for and of, while the distributions are relatively similar to each other for both the for-mer terms and the latter terms. As seen in Fig. 1, the frequency distributions of the terms for and of resemble a Poisson distribution. Given that the terms for and of are used due to grammatical necessity rather than serving to impart knowledge (i.e. semantically non-selective words) and the terms family and wedding are semantically non-selective words, it is reasonable that, for a query including these 4 terms, a term weighting model assuming a 2 Since the number of documents in which a term does not occur is usually far more higher in magnitude than that of the complementary case, inclusion of the relative frequency value of 0 into such a plot would in general make the plot unreadable, especially with respect to the semantically selective words.
Poisson distribution for the frequency distributions of terms is likely to distinguish seman-tically selective words (i.e. index terms) from the semanseman-tically non-selective words (i.e. function words), than a term weighting model assuming a different probability distribution.
Our approach is based on pairwise query similarity but queries would in general be dif-ferent from each others in length. This is an issue, because Chi-square statistic can in fact be used as the measure of pairwise similarity between terms, rather than queries, except for the queries that are composed of a single term. In order to measure the similarity between two queries having more than one term, we adapted a simple heuristic that aggregates the term similarity measurements over queries.
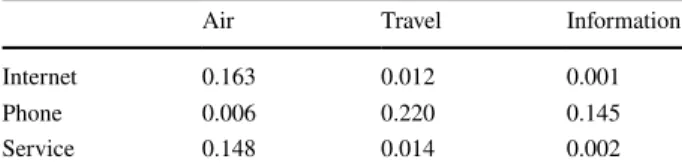
Assuming that the occurrence of a term in a query is independent of the occur-rences of other terms, we can construct a cartesian table for any given pair of queries. Table 4 illustrates a cartesian table for two queries Q1= {internet, phone, service } and
Q2= {air, travel, information }. Each cell of such a cartesian table contains the value of the
Chi-squared distance/difference that is measured between the frequency distribution of the associated row and the frequency distribution of the corresponding column. For instance, the measured Chi-squared distance is 0.163 for the term pair (internet, air).
70 60 50 40 30 20 10 0 Bin No 0 0.5 1 1.5 2 2.5 3 3.5 Number of Documents 107 family wedding for of
Fig. 1 Grouped relative frequency distributions for the terms family, for, of and wedding Table 4 Cartesian
table for the queries
Q1= {internet, phone, service } and Q2= {air, travel, information}
Each cell contains the Chi-squared difference in frequency distribution between the associated row and the corresponding column. The meas-ured Chi-squared difference between internet and air, for instance, is 0.163
Air Travel Information
Internet 0.163 0.012 0.001
Phone 0.006 0.220 0.145
Service 0.148 0.014 0.002
X
In Table 4, the smallest measured Chi-square distance is 0.001 and it is observed for the term pair (internet, information). This suggests that the terms internet and information are the terms that have the highest degree of similarity in frequency distribution, among all possible pairs of terms that are yielded by the cross-product of the sets of terms Q1 and
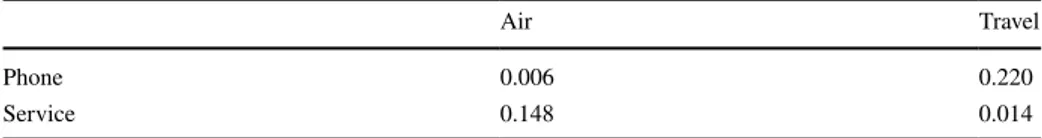
Q2 . According to our heuristic algorithm, after determining the most similar query terms,
we remove the corresponding row and the column from the table. For two queries each of which consists of n terms, this operation results in a cartesian table of (n − 1) × (n − 1) cells, as illustrated in Table 5 for the example queries. In the resulting cartesian table, the most similar terms are phone and air, with the smallest Chi-squared distance value of 0.006. For this example, there remains only one pair of terms, (service, travel) , with a Chi-squared distance value of 0.0014, and as a result, we can, now, aggregate the obtained term-based Chi-square measurements to derive an overall similarity value for the queries Q1 and Q2 . We have examined two aggregation methods, namely arithmetic mean and
Euclidean distance, but the aggregation method that serves well with respect to average effectiveness is the Normalized Euclidean Distance, as given by:
The pseudocode of the demonstrated sim measure is given in Algorithm 1. Similar to the 𝜒2 measure, a low value of this sim measure refers to a high level of similarity between the
queries Q1 and Q2 , where sim(Q1, Q2) = 0 indicates that Q1 is identical to Q2 , with respect
to term frequency distributions.
(2) sim(Q1, Q2) =
√
0.0012+ 0.0062+ 0.0142
3 = 0.005
Table 5 The resulting cartesian table after removing the most similar pair of terms internet and information from the original table in Table 4
Air Travel
Phone 0.006 0.220
Data: Input: Q1 and Q2
Data: Output: Similarity between Q1 and Q2
if |Q1 = |Q2| then
throw new IllegalArgumentException(“Query lengths are not equal!”); end
double [ ][ ] table = new double[|Q1|][|Q2|]; for termi ∈ Q1 do for termj ∈ Q2do table[i][j] ← χ2(term i, termj); end end double euclidian ← 0.0; while table is not empty do
int minimum ← Math.minimum(table); int r ← row index of the minimum element; int c ← column index of the minimum element;
remove all elements at rowr and columnc from the table;
euclidian ← euclidian + table[r][c] × table[r][c]; end
return√euclidian÷ |Q1|;
Algorithm 1: Couple Similarity
This sim measure requires that the two queries to be compared should have equal lengths as measured by the number of terms. In our heuristic, when the lengths of the queries are differ-ent, we label the two queries as Qlong and Qshort . Then, we generate Qshort combination of Qlong ,
each of which has the same length as Qshort . In order to give a concrete example, consider two
queries X = {internet, phone, service} and Y = {disneyland, hotel }. First, we obtain ( Qlong Qshort ) =( 3 2 )
= 3 sub-queries of the long query X: [internet, phone] [internet, service] [phone, service]. Then we apply sim, as is, for each sub-piece using Qshort:
• sim(disneyland hotel, internet phone) • sim(disneyland hotel, internet service) • sim(disneyland hotel, phone service).
This process results in a list of similarity values computed for each sub-query of the long query hence an aggregation method is required to obtain an overall similarity value for the queries Q1 and Q2 . To obtain a final similarity score, we use the average of the minimum and
the maximum of the list: sim = max(list)+min(list)
2 . The whole process of how unequal query
lengths are handled is given in Algorithm 2.
Data: Input: Q1 and Q2
Data: Output: Similarity between Q1 and Q2
if |Q1| == |Q2| then return couple(Q1, Q2); end if |Q1| > |Q2| then Qlong ← Q1; Qshort ← Q2; else Qshort ← Q1; Qlong ← Q2; end end
List<Double> list = new ArrayList<>();
// generate Qshort combination of Qlong
for Qi ∈ QQlong short do list.add(couple(Qshort, Qi)); end return min(list)+max(list) 2 ;
Algorithm 2: Cartesian Similarity
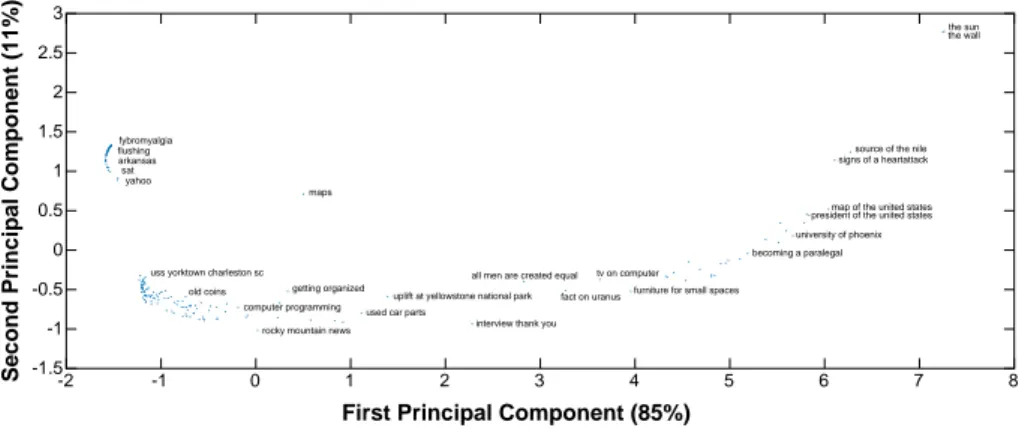
Figure 2 shows the plot of the calculated pairwise similarities between the 194 TREC Web track queries. The scatter plot in Fig. 2 is obtained by “Multidimensional Scaling” (MDS) of the matrix of calculated pairwise similarities. In such a MDS plot, distances between points correspond to the magnitudes of the differences between rows and columns, as measured by the similarity/difference measure in use. Here, points represent queries. Thus, in Fig. 2, simi-lar queries, with respect to the simisimi-larity scores calculated as given above, are shown close to
First Principal Component (85%)
8 7 6 5 4 3 2 1 0 -1 -2
Second Principal Component (11%) -1.5 -1 -0.5 0 0.5 1 1.5 2 2.5 3 the sun the wall
source of the nile signs of a heartattack
map of the united states president of the united states university of phoenix becoming a paralegal
furniture for small spaces tv on computer
interview thank you all men are created equal
fact on uranus maps fybromyalgia flushing arkansas sat yahoo
uss yorktown charleston sc getting organized
rocky mountain news
uplift at yellowstone national park old coins
computer programming used car parts
Fig. 2 The multidimensional scaling analysis of the ClueWeb09 queries
each others, and vice versa. In the plot, selected queries are labeled by their query texts for the ease in interpretation. As seen in Fig. 2, the queries that are different from each others in length are scattered along the x axis, suggesting that the difference between one-term queries and multiple-term queries are exhibited along the x axis for this MDS plot. Similarly, along the y axis, it appears that the differences between the queries with equal lengths are depicted. The queries with terms such as the, of, and a are grouped at the upper right corner. One-term queries are positioned at the upper left corner, with the exception of the query maps, which is neither specific nor common. The queries that are composed of the terms with similar prop-erties to that of the term maps are grouped around the origin of the plot, suggesting that these queries are not different from each others compared to the differences observed for those queries that are scattered towards the edges of the plot. The MDS plot in Fig. 2 suggests in general that term frequency distribution, as a feature, is capable to characterize queries with respect to the types of the terms that the queries are composed of.
3.2 The win‑sets, the loss‑sets and the small sample size problem
Our selective approach is of supervised classification type and hence it requires training data to learn the association between queries and term weighting models, with respect to retrieval performance. In our approach, given a set of training queries, we, first, measure the per-query performances of the 8 term weighting models in order to determine the best model amongst the 8 term weighting models under consideration. We, then, compose a win set of queries for each of the 8 term weighting models, by grouping those training queries that the corresponding term weighting model has the highest per-query performance score. In the case of a tie, we apply the following process. When there are more than one winner model for a training query, the query is added to all win-sets of the winner models sepa-rately; and when every term weighting model has a per-query performance score of 0 or all of the observed scores are equal to each others in magnitude, the query is simply discarded. Having the win-sets for the 8 term weighting models, the model that is likely to show the highest performance for any given new query can be predicted by measuring the similar-ity of the new query to the associated win-sets. The predicted model for a new query will in this respect be the one whose win-set consists of the queries that are, on average, more similar to the new query than the queries in the win-sets of the other models.
This classification algorithm actually suffers from the same, universal weakness that every supervised, statistical classification algorithm suffers from, the lack of enough training data. In theory, the information to be provided by the “win-sets” can be assumed enough to fully explain the differences in per-query effectiveness between individual term weighting models, as long as the training set is large enough in size. For instance, the num-ber of queries released from the TREC Web track studies in between 2009 and 2012 is 200. In our approach, there are 8 term weighting models to be classified with respect to their per-query performances. This means that each model would ideally have the highest per-query performance score for 25 queries at most, if the win-sets were, somehow, to be balanced in size for the 8 term weighting models. In practice, the win-sets associated with individual term weighting models would usually vary in size. For the 200 TREC Web track queries and the 8 term weighting models under consideration, the number of the training queries in each win-set varies from 10 (for DLM) to 38 (for BM25). Comparing to the sample size of 8! (40,320) required for the full factorial design to have at least one sample query for every possible within-query rankings of the 8 term weighting models, it would appear that a set of 200 training queries is quite small in size.
To alleviate the effect of this weakness, we also use loss sets, in addition to the win-sets, which in theory doubles the amount of information that could be obtained for each term weighting model from the same set of queries. In similar to win-sets, we compose a loss-set of queries for each of the 8 term weighting models, by grouping those training queries that the corresponding term weighting model has the lowest per-query performance score. On this account, the most likely term weighting model is the one whose loss-set consists of the queries that are, on average, more dissimilar to the new query than the queries in the loss-sets of the other models. As a result, relating the win-sets and the loss-sets, we can say that the term weighting model that is likely to show the highest performance for any given query would be the one whose win-set and loss-set are respectively the most similar to, and, simultaneously, the most dissimilar to the query given. To obtain an overall similarity score for a query with respect to both the win-set and the loss-set associated with a particu-lar term weighting model, we use the ratio of the win-set simiparticu-larity score to the loss-set dissimilarity score.
Lastly, we compose the training sets of queries by choosing those queries within which the 8 term weighting models show high variation in performance. In other words, given a set of queries, the training set of queries is composed of the 75% of the original queries having the highest CoV scores (i.e., the highest Coefficient of Variation scores) among all. This election process discards the queries that carry relatively less or no information about the within-query performance differences between the models, i.e. it eliminates the noise and the extreme/outlier cases from the training data.
4 Results
In this section, we demonstrate the effectiveness of the proposed selective approach to index term weighting, using the standard TREC test collections. Two sets of queries are used for this purpose: (1) the official set of 200 queries from the TREC Web track and (2) the official set of 562 queries from the TREC MQ track. In accordance with the sets of que-ries at hand, we divided this section into two subsections, and at the end of the section we summarize the results of individual experiments.
The proposed selective approach is evaluated with respect to the two aspects of retrieval effectiveness: (1) the observed average retrieval performance and (2) the accuracy in clas-sifying the test queries into the true classes of 8 term weighting models, i.e. the classi-fication accuracy. The measure of retrieval effectiveness that we use in the evaluations is the normalized Discounted Cumulative Gain at 100 document, nDCG@100 (Järvelin and Kekäläinen 2002). Although the main analysis is made using the nDCG@100 values, nDCG@20 values are also reported in order to make the performance gains reported in this paper comparable with existing work.
To measure the robustness of the proposed selective approach, we use the current state-of-the-art risk-sensitive evaluation measure, called the GeoRisk (Dinçer et al. 2016). GeoRisk is a well-founded measure that is used for the risk-sensitive evaluation of IR experiments (Collins-Thompson 2009; Wang et al. 2012; Dinçer et al. 2014). As a risk-sensitive measure, GeoRisk combines the average performance of an IR system and the level of risk associated with the system, i.e. the geometric mean of the average retrieval performance of a system and the associated level of risk:
where RP(si
)
stands for the average retrieval performance of the system si as measured by
a performance measure (e.g., nDCG, ERR, etc.) and ZRisk(si
)
stands for the level of risk associated with the system si . Here, c is the number of queries under consideration and
0 ≤ 𝛷() ≤ 1 is the cumulative distribution function of the standard normal distribution. 𝛷() is used to normalize ZRisk values into [0,1], because − ∞ ≤ ZRisk∕c ≤ +∞.
The measure of risk in GeoRisk is ZRisk and in the context of risk-sensitive IR evalua-tion, “risk” refers to the risk of performing worse than a baseline system for a given query. In this respect, ZRisk rewards the system under evaluation for the queries that the system is better than the baseline, and conversely, it punishes for the queries that the system is worse than the baseline, as given by
For any system si ( i= 1, 2, … , r ), Q+ ( Q− ) is the set of queries where ziq> 0 ( ziq< 0 ,
respectively), determined by whether system si outperforms the baseline on query q. In
Eq. (4), the risk sensitivity parameter3 𝛼 ≥ 0 controls the tradeoff between reward and risk
(or win and loss). Here, ziq=�xiq− eiq�∕√eiq , where xiq and eiq are, respectively, the
per-formance score of the system si for query q and the expected performance score for q from
the baseline system(s). Given a system si , the expected performance score for a particular
query j ( j = 1, 2, … , c ) is calculated as eij=(Si× Tj)∕N , where N is the total performance
score over all systems and queries (i.e., N = ∑i
∑
jxij ), Si is the total performance score of
the system si over all queries (i.e., Si=
∑
jxij ), and Tj is the total performance score for the
query j over all systems (i.e., Tj=
∑
ixij).
The risk measure ZRisk, as a result, promotes a particular system over another system if that system is more robust, or rather less “risky” than the other. The ZRisk measure per-mits to derive the baseline performance of a query from multiple (baseline) systems. In this study, we derive the per-query baseline performances from the set of 8 term weighting models under consideration.
It is worth mentioning that the baselines in ZRisk measurements are different from the baselines that are used for the comparative evaluation of the proposed approach. The for-mer baselines are implicit, and embedded into the GeoRisk measurements, in contrast to the latter baselines. For the comparative evaluation of the proposed approach, we use four (explicit) baselines. One of those 4 baselines is the most effective, single term weighting model on average. For the TREC Web track queries, the most effective term weighting model is LGD, with an average nDCG@100 score of 0.1808, and the most effective term weighting model for the TREC MQ track queries is DPH, with an average nDCG@100 score of 0.3585. In addition, we define two theoretical selection strategies as two baselines: (1) a random selection strategy (RND), and (2) a maximum likelihood estimation/selection strategy (MLE). The fourth and the last baseline is the current state-of-the-art selective approach to index term weighting in the IR literature (He and Ounis 2003b, 2004), which is referred to as “MS7” in this study.
(3) GeoRisk(si) =√RP(si) × 𝛷(ZRisk(si)∕c) (4) ZRisk(si) = [ ∑ q∈Q+ ziq+ (1 + 𝛼) ∑ q∈Q− ziq ]
Lastly, we use both the Student’s t test and the Wilcoxon signed-rank test for testing the significance of the experimental results presented in this section.
4.1 The results for the TREC Web track queries
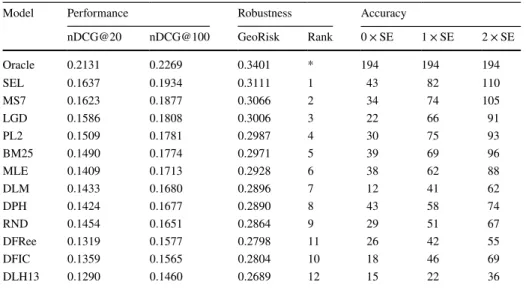
The results of the experiment on the TREC Web track queries are presented in Table 6. There are 194 queries that are actively used in this experiment, due to the lack of relevant documents in the result sets of the considered 8 term weighting models for 6 queries.
The 13 models that are listed in Table 6 are ranked according to their average nDCG@100 scores. As seen in the table, the proposed selective approach, “SEL,” has the highest average nDCG@100 score of 0.1934, except for the score associated with the vir-tual model, “Oracle,” that could select the best model for every query. Similarly, “SEL” has the highest GeoRisk score of 0.3111. Relating these effectiveness and robustness scores of the proposed method, we can say that, for the TREC Web track queries, the proposed method, “SEL” is more effective and more robust than the state-of-the-art term weighting models under consideration.
Except for the “MS7” model, the differences in average nDCG@100 scores between “SEL” and each of the models listed in Table 6 are statistically significant, with a p value that is less than 0.05, according to both the t test and the signed-rank test. The two hypoth-esis tests, the t test and the signed-rank test, failed to give significance to the observed dif-ference between “SEL” and “MS7.” This suggests, either that the difdif-ference may be attrib-uted to chance fluctuation on the population of queries, or that the size of the sample at hand may not be sufficient to provide a reasonable chance (power) to the hypothesis tests in order to detect the population effect between the models, “SEL” and “MS7.” Considering the results presented in the next sub-section, it would appear that the latter is true: a set of 200 queries is not sufficient in size to provide reasonable power. Indeed, a set of approxi-mately 500 queries can provide enough power to both the t-test and the signed-rank test to give significance to the observed difference between “SEL” and “MS7,” as demonstrated in Sect. 4.2.
Table 6 Selective term weighting result for ClueWeb09A dataset over 194 queries
Model Performance Robustness Accuracy
nDCG@20 nDCG@100 GeoRisk Rank 0 × SE 1 × SE 2 × SE
Oracle 0.2131 0.2269 0.3401 * 194 194 194 SEL 0.1637 0.1934 0.3111 1 43 82 110 MS7 0.1623 0.1877 0.3066 2 34 74 105 LGD 0.1586 0.1808 0.3006 3 22 66 91 PL2 0.1509 0.1781 0.2987 4 30 75 93 BM25 0.1490 0.1774 0.2971 5 39 69 96 MLE 0.1409 0.1713 0.2928 6 38 62 88 DLM 0.1433 0.1680 0.2896 7 12 41 62 DPH 0.1424 0.1677 0.2890 8 43 58 74 RND 0.1454 0.1651 0.2864 9 29 51 67 DFRee 0.1319 0.1577 0.2798 11 26 42 55 DFIC 0.1359 0.1565 0.2804 10 18 46 69 DLH13 0.1290 0.1460 0.2689 12 15 22 36
The risk-sensitive evaluation measure, GeoRisk quantifies the degree of robustness associated with each model. As seen in Table 6, the robustness ranking of the models is identical to the ranking based on their average performance scores, except for the models “DFRee” and “DFIC.” This means that each model distributes their total performance on the queries proportional to the expected performances for each query. Here, the expected performance for each query refers to the baseline performance for each query. Thus, for two models, the one that has a higher GeoRisk score is the one that is better than the other in making no abject failure, on average.
The number of queries that a model has the highest score, which corresponds to the “Accuracy” in this study, is actually a measure of robustness in a similar sense that GeoRisk refers to. However, they are different, in that GeoRisk takes into account the per-query baseline performances, in contrast to the “Accuracy.” In Table 6, the number of queries that a model has the highest score4 is listed under the column with label “0 × SE.” Here, for a
query, “SE” stands for the standard error in the within-query average nDCG@100 score over 8 models. Thus, a “0 × SE” difference from the highest score for a query corresponds to exactly that highest score. On the other hand, a “1 × SE” difference from the highest score means that the query will also be considered as a hit for those models whose scores are less than the highest score but within the range of one standard error from the highest score. Similarly, “2 × SE” refers to the range of two standard error from the highest score.
SEL vs. MS7 -0.8 -0.6 -0.4 -0.2 0 0.2 0.4 0.6 0.8 Diff. in nDCG@100 SEL vs. LGD -0.8 -0.6 -0.4 -0.2 0 0.2 0.4 0.6 0.8 SEL vs. RND (Random)
Number of Topics (Web Track)
-0.8 -0.6 -0.4 -0.2 0 0.2 0.4 0.6 0.8 Diff. in nDCG@100
SEL vs. MLE (Maximum Likelihood)
20 40 60 80 100 120 140 160 180 20 40 60 80 100 120 140 160 180
20 40 60 80 100 120 140 160 180 20 40 60 80 100 120 140 160 180
Number of Topics (Web Track)
-0.8 -0.6 -0.4 -0.2 0 0.2 0.4 0.6 0.8 SEL > MS7 RND > SEL SEL > RND SEL > LGD LGD > SEL SEL > MLE MLE > SEL MS7 > SEL 59% 55% 26% 17% 20% 46% 30% 24% 19% 24% 63% 17%
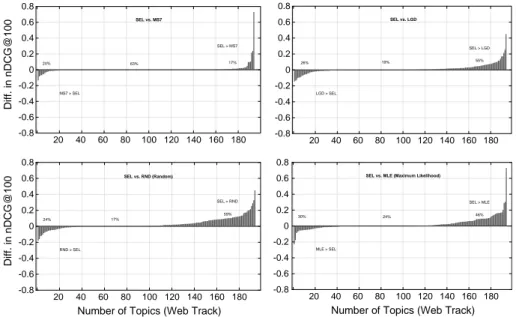
Fig. 3 Visual comparison of the proposed selective term weighting method “SEL” with the 4 baselines for the 194 TREC Web track queries. Each of the 4 plots shows the per-query nDCG@100 score differences, in ascending order of magnitude along the x axis, for “SEL” and one of the 4 baselines. For each plot, the label at the left, on the origin line, shows the percent of queries that the corresponding baseline has higher scores than “SEL.” The label at the right shows the percent of queries where “SEL” has higher scores than the cor-responding baseline
4 The number of queries listed for 8 models does not sum up to 194 due to the ties on the highest scores for some queries. In the case of a tie, that query is counted for each model, separately.
..
...-Factoring out the hits associated with a model in such a way allows us to interpret the GeoRisk score of the model in detail, to a certain extent.
A visual comparison of the proposed selective term weighting method (“SEL”) with the 4 baselines is given in Fig. 3. For the pairs of models, such a visual comparison allows us to fully explore the per-query score differences between the models, and hence the robust-ness of one model with respect to the other. There are 4 plots in Fig. 3, each of which is dedicated to the comparison of the proposed method with one baseline model. Each plot in Fig. 3 show the per-query differences in nDCG@100 scores between “SEL” and one of the 4 baselines, i.e. y axis. The x axis represents the number of queries, where the per-query score differences are sorted in increasing order of magnitude. Thus, the left side of each plot (i.e. the low values of x axis) shows the queries that the baseline has a higher nDCG@100 score than “SEL,” and conversely the right side of the plot shows the queries that “SEL” has higher scores than the baseline. The middle part of the plots, where the score difference is equal to 0, shows ties (i.e. no risk). In such a plot, the ideal case is to have no score difference that is less than zero, i.e. the area under the origin line, the left part, would be equal to zero for a model that is absolutely more robust than the baseline.
Figure 3 shows in general that the proposed selective term weighting method is more robust than all of the 4 baselines. In particular, it seems that the observed difference in average nDCG@100 scores between “SEL” and “MS7” is due to a few queries (i.e., a high score difference in positive direction for a few queries that are shown on the right side of the corresponding plot), while for the majority of the queries, there is a tie. On the other hand, this plot also shows that the GeoRisk scores reflect the fact that “SEL” does not make any abject failure, compared to the model “MS7.” For the other 3 baselines, the superiority of the model “SEL,” with respect to robustness, is clearly exposed by the plots.
Overall, the results of the experiment on TREC Web track queries show that term frequency distributions are a viable source of information for the prediction of the per-query effectiveness of individual term weighting models. Indeed, as we demonstrated in the following sub-section, a selective term weighting method built upon this single source of information can outperform every single term weighting model, as well as the existing approach to selective term weighting, “MS7.”
4.2 The results for the TREC million query track queries
The TREC MQ track provides 562 queries in total, 34 of which are eliminated due to the lack of relevant documents in the result sets of the 8 base models. The resulting set of 528 queries is used for the evaluation of the proposed selective term weighting method. Table 7 lists the results of the experiment performed on the TREC MQ track queries.
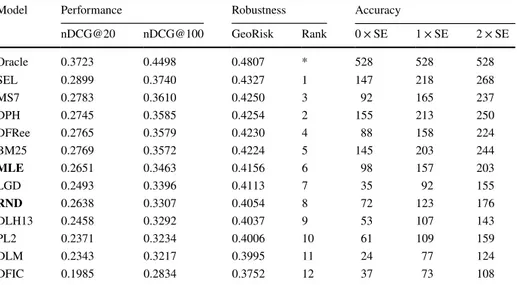
For the TREC MQ track queries, the proposed selective term weighting method, “SEL” has the highest average nDCG@100 score (0.3740), except for the score of the virtual model, “Oracle” (0.4498). Similar to the TREC Web track queries, for the TREC MQ track queries, the t test and the signed-rank test give significance to the observed differences in average nDCG@100 scores between “SEL” and each of the models under consideration, with a p value less than 0.05. In contrast to the TREC Web track queries, for this query set, the observed average performance difference between “SEL” and “MS7” is statistically significant, suggesting that a set of approximately 500 queries is sufficient enough in size to detect the population effect between “SEL” and “MS7.”
The calculated GeoRisk scores for the models indicate, in this time, that the most effective single term weighting model, DPH is more robust than the baseline selective
approach “MS7.” As listed in the column “Accuracy,” the model “DPH” has more hits than “MS7” at every level of standard error. It is worth mentioning that the model DPH has also more hits than the proposed method “SEL” at “0 × SE,” while the “SEL” is in fact more robust than “DPH,” as the number of hits at the deeper levels of standard error indicates. This means that the model DPH is a strong alternative to selective term weighting. On the other hand, since the observed difference in average nDCG@100 scores between “SEL” and “DPH” is statistically significant, it is expected, on the popu-lation of queries, that using “DPH” for every query will cause significant performance losses, compared to “SEL.” This is also true with respect to robustness, as indicated by the GeoRisk scores associated with “SEL” and “DPH.”
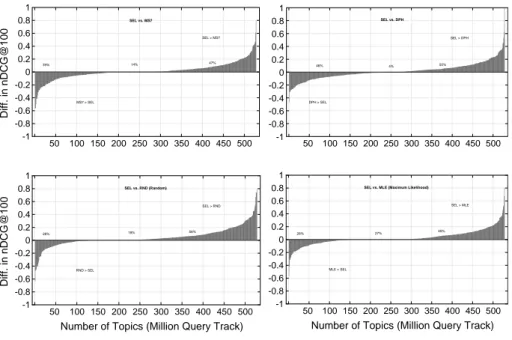
A visual comparison of the proposed term weighting method with the 4 baselines is given in Fig. 4. Figure 4 has the same properties with the Fig. 3 that is given for the visual comparison for TREC Web track queries in Sect. 4.1.
For the TREC MQ track queries, the observed difference in average nDCG@100 scores between “SEL” and “MS7” is not attributed to a few queries: the right side of the corresponding plot in Fig. 4 (i.e. SEL > MS7) has an apparently larger area than the left side of the plot (i.e. MS7 > SEL), as indicated by the associated GeoRisk scores. “SEL” has a higher score than “MS7” for 248 queries in total (i.e. 47% ), and for 73 queries (i.e. 14% ), they have the same scores, and for 207 queries (i.e. 39% ), “MS7” has a higher score than “SEL.”
The case of the most effective single term weighting model, “DPH,” is similar to the case of “MS7.” The proposed term weighting method, “SEL” has a higher score than “DPH” for 263 queries (i.e. 50% ), and there is a tie for 24 queries (i.e. 4% ), and for 241 queries (i.e. 46% ), “DPH” has a higher score than “SEL.”
In summary, Fig. 4 shows that the proposed selective term weighting method, “SEL” is better in both performance and robustness than the most effective term weighting model, as well as the exiting approach to selective term weighting, “MS7.”
Table 7 Selective term weighting result for Million Query 2009 dataset over 528 queries
Model Performance Robustness Accuracy
nDCG@20 nDCG@100 GeoRisk Rank 0 × SE 1 × SE 2 × SE
Oracle 0.3723 0.4498 0.4807 * 528 528 528 SEL 0.2899 0.3740 0.4327 1 147 218 268 MS7 0.2783 0.3610 0.4250 3 92 165 237 DPH 0.2745 0.3585 0.4254 2 155 213 250 DFRee 0.2765 0.3579 0.4230 4 88 158 224 BM25 0.2769 0.3572 0.4224 5 145 203 244 MLE 0.2651 0.3463 0.4156 6 98 157 203 LGD 0.2493 0.3396 0.4113 7 35 92 155 RND 0.2638 0.3307 0.4054 8 72 123 176 DLH13 0.2458 0.3292 0.4037 9 53 107 143 PL2 0.2371 0.3234 0.4006 10 61 109 159 DLM 0.2343 0.3217 0.3995 11 24 77 124 DFIC 0.1985 0.2834 0.3752 12 37 73 108
4.3 Overall analysis
We evaluated the proposed selective term weighting method in comparison of 4 baselines, using the two official sets of queries from previous TREC studies. Relating the results in Table 6 and the results in Table 7, it would appear that, as the set of queries changes, the most effective, single term weighting model changes. For the TREC MQ track, the most effective term weighting model is “DPH,” whereas it is “LGD” for the TREC Web track queries. As seen in Table 6, where the results for the TREC Web track queries are presented, the model “DPH” has a rank of 8: that is, it is listed below the baseline “MLE” and above the baseline “RND.” Thus, in the general context of making a decision to choose between a single term weighting model and a selective approach, it can be said, in the body of the data at hand, that the best decision to be made is, on average, to choose a selective approach to index term weighting. In particular, compared to the existing selective approach “MS7,” the proposed selective term weighting method “SEL” will be the best choice, with respect to both average retrieval performance and robustness.
5 Discussion
From the results of the experiments presented in Sect. 4, we observe that the proposed selective term weighting method has significantly lower effectiveness than the “Oracle,” the optimal selective approach that could predict the best model for any given query,
SEL vs. MS7 -1 -0.8 -0.6 -0.4 -0.2 0 0.2 0.4 0.6 0.8 1 Diff. in nDCG@100 SEL vs. DPH -1 -0.8 -0.6 -0.4 -0.2 0 0.2 0.4 0.6 0.8 1 SEL vs. RND (Random)
Number of Topics (Million Query Track)
-1 -0.8 -0.6 -0.4 -0.2 0 0.2 0.4 0.6 0.8 1 Diff. in nDCG@10 0
SEL vs. MLE (Maximum Likelihood)
50 100 150 200 250 300 350 400 450 500 50 100 150 200 250 300 350 400 450 500
50 100 150 200 250 300 350 400 450 500 50 100 150 200 250 300 350 400 450 500
Number of Topics (Million Query Track)
-1 -0.8 -0.6 -0.4 -0.2 0 0.2 0.4 0.6 0.8 1 DPH > SEL SEL > RND
RND > SEL MLE > SEL
SEL > MLE SEL > DPH SEL > MS7 MS7 > SEL 47% 14% 56% 26% 18% 39% 46% 50% 28% 27% 45% 4%
Fig. 4 Visual comparison of the proposed selective term weighting method “SEL” with the 4 baselines for the 528 TREC Million Query track queries. Each of the 4 plots shows the per-query nDCG@100 score dif-ferences, in ascending order of magnitude along the x axis, for “SEL” and one of the 4 baselines. For each plot, the label at the left, on the origin line, shows the percent of queries that the corresponding baseline has higher scores than “SEL.” The label at the right shows the percent of queries where “SEL” has higher scores than the corresponding baseline
with 100% accuracy. We speculate that one of the reasons behind this optimality issue is the existence of the supplementary components in the functional forms of the proba-bilistic term weighting models. Probaproba-bilistic term weighting models are, in theory, built upon a particular assumed probability distribution, but in practice the implemented functional forms usually include supplementary components, in addition to the theo-retical basis. For instance, the PL2 weighting method, which is an instance of the diver-gence from randomness model (Amati and Van Rijsbergen 2002), assumes a Poisson distribution, denoted by “P” in PL2, and its functional form includes an additional com-ponent that is derived from the Laplace law of succession, denoted by “L” in PL2, and it also applies a term frequency normalization scheme, denoted by “2” in PL2. Similarly, the BM25 method, which is one of the successful implementations (Robertson et al. 1981; Robertson and Walker 1994) of the Harter’s 2-Poisson model (Harter 1975a, b), assumes in principle a Poisson distribution, but its functional form additionally includes an “IDF” component, and applies a term frequency normalization scheme. A remedy for this issue could be factoring out each model into its components and then combining a term weighting model on the fly based on the query given. However, such an approach would suffer from the lack of enough training queries in number. One of the future work that can be carried out in the same line of research will perhaps be to experiment on this component-based selective approach, once a large enough set of queries is obtained.
6 Related work
Selective IR is an attractive subject of interest, simply because it promises, at least in theory, a great deal of improvement in retrieval effectiveness, as well as robustness, compared to the traditional methods of IR. Unfortunately, this potential has not been completely put into practice yet, though there exist several attacks in the literature.
The scope of selective IR is wide and virtually it covers every phase of IR process. A typical example for the successful application of selective IR is perhaps query expan-sion, where the expansion is applied to the queries that are likely to benefit from auto-matic query expansion (Amati et al. 2004; Yom-Tov et al. 2005).
Regarding the different tasks in IR, a selective approach to personalization, for instance, is introduced by Teevan et al. (2008). Similarly, in the work of White et al. (2008), commercial search engines are the subject of selection and in the works of Peng et al. (2010) and Balasubramanian and Allan (2010), the subject is learning-to-rank methods. Search result diversification (Santos et al. 2010) and collection enrichment (Peng et al. 2009a, b) are also known subjects of selective IR.
In addition to making selective application of alternative IR techniques, it is also possible to make selective application of different document representations (Plachouras et al. 2004, 2006), and selective application of query-independent features (Peng and Ounis 2009), or to make selection among different query sets for the purpose of train-ing a machine learntrain-ing technique (Geng et al. 2008), or to make dynamic pruning of the result sets to be re-ranked via a learning-to-rank technique (Tonellotto et al. 2013).
Among all of the IR tasks, the least studied one is the task of index term weighting. In this respect, the pioneering work is the work of He and Ounis (2003b, 2004). In that study, queries are represented by vectors of three features: (1) the number of query terms, (2) the
number of documents that contain at least one of the query terms,5 and (3) the ratio of the
minimum IDF to the maximum IDF associated with the query terms. The candidate model set used in the original work consists of 11 term weighting models that are derived from the divergence-from-randomness (DFR) framework (Amati and Van Rijsbergen 2002). Given a set of training queries, the proposed approach clusters the queries into k clusters, and assigns the most effective DFR model to each cluster. The term weighting model to be applied to a new query is determined according to the distance of the new query from the k clusters.
Recently, Petersen et al. (2016) present an extension to the DFR framework, called Adaptive Distributional Ranking (ADR) model. In that work, given a dataset consisting of a document collection and a query set, the best-fitting distribution to non-informative query terms is, first, selected among a candidate set of statistical distributions including the geometric, negative Binomial, Poisson, power law and Yule-Simon distributions. Then, the corresponding term weighting model is derived from the DFR framework, and applied to any given new query. In this respect, ADR can be considered a per-dataset basis selective approach to index term weighting.
As a summary, the aforementioned works suggest in general that selective IR is a prom-ising line of research, with the potential of being a viable remedy for the long-standing challenge of robustness in IR.
7 Conclusions
There has been a great deal of research dedicated to developing term weighting models for IR. However, IR research has shown that there is no single term weighting model that could satisfy every information need of users, with an acceptable level of satisfaction. Rather, high performance fluctuation across information needs has been empirically shown in time. This issue refers to the robustness in retrieval effectiveness. The presented study in this paper investigates the selective application of existing term weighting models on a per-query basis to tackle down the challenge of robustness in retrieval effectiveness.
We test the proposed selective method on the ClueWeb09-English corpus and its cor-responding TREC tasks, namely the Web Track and the Million Query Track. The experi-mental results show that selective term weighting does improve retrieval effectiveness on average, compared to a baseline where a single term weighting model is applied uniformly to every query. The experimental results also show that the proposed method forms a robust system that avoids making an abject failure for any query, while maintaining a high average retrieval effectiveness at the same time. In other words, we show that a robust and an effective system can be built by leveraging only the existing term weighting models in a selective manner, without inventing a new one.
Most importantly, to our best knowledge, this study is the first that provides empirical evidence in favor of the fundamental assumption of probabilistic term weighting models, which relates the relevance of a document to a query by means of probability distributions. In particular, we empirically justify the presumed relationship between the frequency dis-tributions of (query) terms and the retrieval effectiveness of probabilistic term weighting models.
5 In order to calculate this feature, the test query must be searched without fetching the result list. Thus, this feature is not a pure pre-retrieval type.
Acknowledgements This work is supported by TÜBİTAK, scientific and technological research projects funding program, under Grant 114E558. Any opinions, findings and conclusions or recommendations expressed in this material are the authors’ and do not necessarily reflect those of the sponsor.
Appendix: Experimental setup and details
The IR community has recently encouraged the reproducibility of the published experi-mental results (Arguello et al. 2016; Lin et al. 2016; Voorhees et al. 2016). In this section, therefore, we provide every detail of our experimental setup necessary to reproduce the results of the experiment presented in this article. To further promote open-source sharing, repeatability and reproducibility, the source codes are made publicly available on GitHub, https ://githu b.com/iorix xx/lucen e-cluew eb-retri eval, so that IR researchers could benefit from the presented work as much as possible.
The ClueWeb09-English documents are indexed after the Hyper Text Markup Language (HTML) tags are stripped from every document using the jsoup6 library (version 1.10.2).
The HTML tag stripping procedure yields empty text blocks for some documents, which are skipped during indexing. We employ no structural document representation i.e. the title and body sections of each document are combined together to form a single text block. However, anchor texts from incoming links are appended to the document contents.
In our experiments, we discard the topics that have no relevant documents in the judg-ment set. The exact number of effective topics used in this study is 759. The descriptive statistics for those 759 queries are given in Table 8.
We use gdeval.pl (version 1.3) TREC evaluation tool (downloaded from trec-web-20147 GitHub repository) to calculate nDCG@k values. The tool computes nDCG
using the standard rank-plus-one discount function and exponential gain (Burges et al. 2005). The relevance judgments for the Million Query (Carterette et al. 2009) 2009 topics are distributed as a five-column prels file instead of a four-column standard qrels file. Therefore, statAP_MQ_eval_v4.pl8 evaluation script is used to calculate nDCG@k
values for the Million Query 2009.
The models LGD, PL2, and Language Modeling with Dirichlet smoothing (DLM) contain one free parameter, while BM25 contains two free parameters. It is important to Table 8 Salient statistics for the query sets used in the experiments
Track # of queries Average
query length Average # of relevant documents per query Average # of non-relevant documents per query # of relevance levels MQ09 562 2.6 15.5 ( ± 25.7) 38.6 ( ± 48.1) 3 WT09 49 2.1 140.0 ( ± 79.0) 333.6 ( ± 80.1) 3 WT10 48 2.0 109.0 ( ± 70.7) 418.7 ( ± 132.1) 5 WT11 50 3.4 63.1 ( ± 63.7) 324.5 ( ± 101.4) 5 WT12 50 2.3 70.5 ( ± 55.3) 250.6 ( ± 87.2) 6 6 http://jsoup .org. 7 http://githu b.com/trec-web/trec-web-2014. 8 http://ir.cis.udel.edu/milli on/statA P_MQ_eval_v4.pl.