Full Terms & Conditions of access and use can be found at
http://www.tandfonline.com/action/journalInformation?journalCode=wtnm20
Download by: [Bilkent University] Date: 02 October 2017, At: 23:26
Journal of Transnational Management
ISSN: 1547-5778 (Print) 1547-5786 (Online) Journal homepage: http://www.tandfonline.com/loi/wtnm20
Measuring and Evaluating Efficiency of Hospitals
Through Total Quality Management
Selim Zaim , Nizamettin Bayyurt , Ali Turkyilmaz , Nihat Solakoglu & Halil Zaim
To cite this article: Selim Zaim , Nizamettin Bayyurt , Ali Turkyilmaz , Nihat Solakoglu & Halil Zaim (2008) Measuring and Evaluating Efficiency of Hospitals Through Total Quality Management, Journal of Transnational Management, 12:4, 77-97, DOI: 10.1300/J482v12n04_05
To link to this article: http://dx.doi.org/10.1300/J482v12n04_05
Published online: 22 Sep 2008.
Submit your article to this journal
Article views: 145
View related articles
of Hospitals Through Total
Quality Management:
A Multi-Criteria Data Envelopment
Analysis Model
Selim Zaim Nizamettin Bayyurt Ali Turkyilmaz Nihat Solakoglu Halil ZaimABSTRACT. The purpose of this study is to measure and evaluate the
efficiency of 12 hospitals in Turkey using a multi-criteria Data Envelop-ment Analysis (DEA) methodology. Number of beds, number of physi-cians and the critical factors of total quality management in the health care sector were used as inputs of the model. The outputs used in this analysis incorporated financial and non-financial performance of hospi-tals, number of outpatients and number of patient days. Performance of the hospitals was measured using subjective measures based on executive’s
Selim Zaim is affiliated with Fatih University, Faculty of Economics and Adminis-trative Sciences, Department of Management, 34500 Buyukcekmece, Istanbul, Turkey (E-mail: [email protected]).
Nizamettin Bayyurt is affiliated with Fatih University, Faculty of Economics and Administrative Sciences, Department of Management, 34500 Buyukcekmece, Istan-bul, Turkey.
Ali Turkyilmaz is affiliated with Fatih University, Department of Industrial Engineering. Nihat Solakoglu is affiliated with Bilkent University, Department of Banking and Finance. Halil Zaim is affiliated with Fatih University, Faculty of Economics and Adminis-trative Sciences, Department of Management.
Journal of Transnational Management, Vol. 12(4) 2007 Available online at http://jtran.haworthpress.com Ó 2007 by The Haworth Press. All rights reserved.
doi:10.1300/J482v12n04_05 77
perception of how their organization performed relative to the competition. Results provide management with information regarding the relatively best practice hospitals in the observation sets and locate the relatively inefficient hospitals by comparison with the best practice ones. At last some suggestions are made for the least efficient hospital.doi:10.1300/J482v12n04_05 [Article
copies available for a fee from The Haworth Document Delivery Service: 1-800-HAWORTH. E-mail address: <[email protected]> Website: <http:// www.HaworthPress.com>Ó 2007 by The Haworth Press. All rights reserved.]
KEYWORDS. Total quality management, data envelopment analysis,
health care industry
Comparative performance evaluation is very important for the opti-mum management of an organization. The performance of an organiza-tion is usually evaluated by comparison with other organizaorganiza-tions in the same industry.
The efficiency of hospitals traditionally has been measured by ratio analysis such as cost per day, cost per patient, etc., and econometric methods on the basis of which a production function or a cost function are estimated.
Ratio analysis is limited to only two factors, one input and one out-put. When multiple outputs are produced using multiple inputs ratio analysis is not an appropriate method. Econometric methods are supe-rior to ratio analysis mainly because the model takes into account the in-teraction between a number of inputs and outputs.
Recently, to estimate the relative efficiency of hospitals data envel-opment analysis (DEA) has been used. DEA determines hospitals’ rela-tive efficiency on the basis of their inputs/outputs.
The purpose of the study is to estimate the relative efficiency of hos-pitals in Turkey using subjective critical factors of total quality manage-ment and objective measuremanage-ments such as number of beds, number of physicians, number of outpatients and number of patient days.
LITERATURE REVIEW
Performance measurement is very important for the optimum man-agement of an organization. According to Deming without measuring something, it is impossible to improve it. Therefore, to improve
zational performance, one needs to determine the total quality manage-ment criteria (Madu et al., 1996; Gadenne, Sharma, 2002).
Both the manufacturing and service sector literature contain a con-siderable number of studies that measure business performance through total quality management criteria (Samson & Terziovski, 1998; Flynn et al., 1995; Wilson & Collier, 2000; Fynes & Voss, 2001; Flynn & Saladin, 2001; Azaranga et al., 1998; Montes et al., 2003; Benson et al., 1991; Stein, 1998; Choi, Eboch, 1989).
Due to the presence of a multitude of barriers, many healthcare organizations utilize only a partial implementation of TQM, and hence are unable to achieve continuous and systematic improvement (Nwabueze & Kanji, 1997; Zabada et al., 1998). In these studies, two main culprits were identified. The first was the uncertain definition of TQM. The second was the inappropriate implementation of TQM (Hansson & Ericsson, 2002). Despite this lack of success, many re-searchers found that TQM is still a very important source for improv-ing the organizational performance of hospitals. Particularly, quality management has become an important issue in the healthcare sector after 1980 (Kunst & Lemming, 2000; McAlexander et al., 1994; Kenagy et al., 1999; Andaleeb, 2001; Eggli, Halfon, 2003; Butler, Leong, 2000; Yasin et al., 1998; Li, 1997; Yang, 2003; Meyer, Collier, 2001; Ovretveit, 2001; Brashier et al., 1996).
In the literature, various approaches have been used to measure ser-vice performance. The most common methods are ratio analysis, and econometric methods on the basis of which a production function or costs function are estimated. In the econometric approach, usually Cobb-Douglas function is chosen as an objective function. However, in many situations, it is very difficult to know the production function, es-pecially in the case of health care industry. Therefore econometrics methods may not be appropriate for health care industry.
The deterministic methods to the measurement of productive effi-ciency often involve mathematical programming (non-parametric) mod-els, including DEA, where no assumptions are made about the form of the production function. Instead, a best-practice function is empirically built from observed inputs and outputs. DEA is a powerful aggregate comparative method for assessing the productivity of organizations with multiple incomparable inputs and outputs. DEA has been devel-oped by Charnes et al. (1978) as a generalization of the framework of Farrell (1957) on the measurement of productive efficiency. The objec-tive function in that model was to maximize the ratio of weighted out-puts to weighted inout-puts for a particular decision making unit. This is
done subject to the constraints that the ratio of weighted outputs to weighted inputs is less than or equal to one. The decision variables are output weights and input weights. DEA has wide applications in health care sector (Al-Shammari, 1999; Harris et al., 2000; Valdmanis et al., 2004; Ozgen & Ozcan, 2004; Steinmann et al., 2004).
THE MODEL
Data envelopment analysis is used to determine whether a hospital is less productive or inefficient, compared to other hospitals in the model. Methodology
For the empirical research, we selected as our universe the private and state hospitals in Turkey. Data for this study was collected using a questionnaire that was distributed to 50 chief executive officers of healthcare institutions in Turkey. The identification of the input and output dimensions a questionnaire were constructed. The instrument used in this study originally was developed by Jayant V. Saraph, P. George Benson, and Roger G. Schroeder with the purpose of identify-ing critical factors (areas) of total quality management in a business unit adapted by Raju, Lonial for use in the hospital industry (Raju & Lonial, 2002).
However, in the present questionnaire, the eight critical factors were reduced to four. The basic justification for this lies in the researchers’ impression (derived from the pilot study) that the hospital sector is in the “awakening” stage described by Crosby (Crosby, 1996). Our inter-views corroborated that management “recognized that quality manage-ment may be of value but was not willing to provide money or time to make it all happen, teams were set up to attack major problems instead of soliciting long range solutions,” and that company quality posture could be summarized as “is it absolutely necessary to always have prob-lems with quality?” These signified a very close alignment with the “awakening” stage of Crosby’s stages of maturity.
As is typical of this stage, none of the hospitals in the sample re-ported an established quality department or relevant training pro-grams. Consequently, three critical factors, namely role of quality department, training, and product and service design were excluded from the questionnaire. A fourth critical factor, supplier quality man-agement, was also omitted since the Turkish Ministry of Health requires
hospitals to award contracts to vendors who are the lowest bidders as long as they satisfy certain specifications. A second section in the ques-tionnaire measures business performance criteria.
The original version of the questionnaire was in English. This ques-tionnaire was translated into the local language (Turkish). Each item was rated on a five-point Likert scale, ranging from “very low” to “very high.” The questionnaire was pre-tested several times to ensure that the wording, format, and sequencing of questions were appropriate. Occa-sional missing data on variables was handled by replacing them with the mean value. The percentage of missing data across all data was calcu-lated to be relatively small.
The analysis of the data is conducted four steps:
1. Performing an exploratory factor analysis with varimax rotation to determine the critical factors of the total quality management. 2. Performing an exploratory factor analysis with varimax rotation
to determine the factors of business performance criteria.
3. Using canonical correlation analysis to measure the correlation between subjective inputs and subjective outputs.
4. Using DEA after adding two objective inputs and two objective outputs to the result of the first two steps for measuring the effi-ciency of the hospitals. To simplify the study for DEA analysis, twelve hospitals were randomly selected.
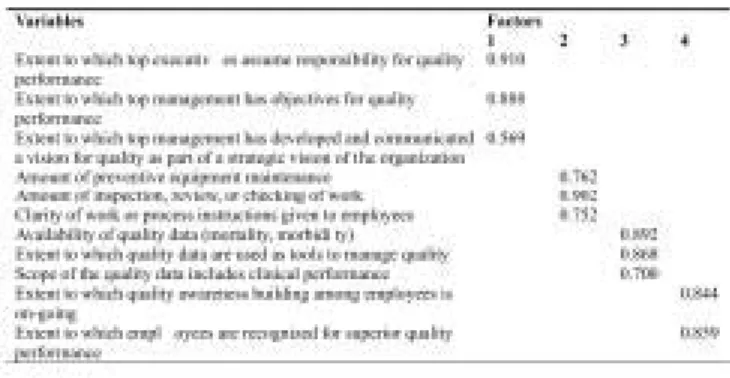
Exploratory factor analysis with varimax rotation was performed on the total quality management criteria in order to extract the dimensions underlying the construct. The factor analysis of the 30 variables (Ap-pendix A) yielded four factors explaining 83.953% of total variance. Only eleven of the thirty items loaded on these four factors and, based on the items loading on each factor, the factors were labeled “Role of
di-visional top management and quality policy” (Factor 1), “Process man-agement” (Factor 2), “Quality data and reporting” (Factor 3), “Employee relations” (Factor 4). These eleven items are shown in Table 1.
These items were factor analyzed to see if they were structurally re-lated. Factor analysis is a multivariate technique which links the three variables in the factor 1, 2 and 3 and two variables in the factor 4 in such a way that only the unique contribution each of the eleven variables is considered for each factor. Thus factor analysis avoids potential prob-lems of multicollinearity (Hair, Anderson, Tatham & Black, 1998).
The Cronbach’s alpha measures of reliability for the four factors were 0.8349 for factor 1, 0.8787 for factor 2, 0.8399 for factor 3, 0.8209
for factor 4. Since Cronbach’s alpha measures for each factor are above the traditionally acceptable value of 0.70, all of the factors were ac-cepted as being reliable for the research.
Exploratory factor analysis with varimax rotation was performed on the performance measurement criteria of the hospital in order to extract the dimensions underlying the construct. Performance of the hospitals was measured using financial and non-financial indicators. Financial criteria include subjective measures such as revenue growth over the last three years, net profits, return on investment, profit to revenue ratio, cash flow from operations. On the other hand, non-financial criteria contain subjective measures such as reputation among major customer segments, capacity to develop a unique competitive profile, new prod-uct/ service development and market development. Non-financial crite-ria are based on executive’s perception of how the organization is performing relative to the competition.
The factor analysis of the 19 variables (Appendix B) yielded two fac-tors explaining 77.901% of total variance. Only nine of the nineteen items loaded on these two factors and, based on the items loading on each factor, the factors were labeled “Financial factor” (Factor 1),
“Non-financial factor” (Factor 2). Factor loadings of these nine items
are shown in the Table 2.
The Cronbach’s alpha measures of reliability for the two factors were 0.9092 for factor 1, 0.9206 for factor 2. Since Cronbach’s alpha mea-sures for each factor are above the traditionally acceptable value of 0.70, all of the factors were accepted as being reliable for the research.
TABLE 1. Factor Analysis of Total Quality Management Criteria
Canonical correlation analysis is a more general case of usual multi-ple regression. In multimulti-ple regression analysis, the aim is to find a linear combination of the independent (or predictor) variables such that the composite has the maximum correlation with the dependent (or crite-rion) variable. Canonical correlation analysis seeks to identify and quantify the associations between two sets of variables. It focuses on the correlation between a linear combination of the variables in one set and a linear combination of the variables in another set (Johnson, 2002).
In this study, canonical correlation was used to investigate the inter-relationships between two sets of variables: the criterion set (outputs) includes performance factors (financial and non-financial performance variables) while the predictor set (inputs) consists of variables reflect-ing TQM factors (process management, quality data and reportreflect-ing, em-ployee relations, role of divisional top management and quality policy).
Table 3 displays the test statistics of canonical correlation. The first canonical correlation (R = 0.56) indicates a strong relationship between performance and TQM variables. Both canonical functions were found to be significant at an alpha level of .05 using Bartlett’s chi-square test. As a result of canonical correlation we can ascertain that the subjective inputs explain the subjective outputs.
In the study total six inputs and four outputs were identified. The four inputs (“Role of divisional top management and quality policy” (Factor 1), “Process management” (Factor 2), “Quality data and reporting” (Factor 3), “Employee relations” (Factor 4)) and two outputs (Financial factor (Factor 1), Non-financial factor (Factor 2)) measures were deter-mined using subjective measures related to critical factor of total quality management. Additionally two objective inputs (number of beds and number of physicians) and two objective outputs (number of outpatients and number of patient days) are included in this analysis. These
objec-TABLE 2. Factor Analysis for Performance Criteria
tive inputs and outputs are generally used variables in the evaluation of the efficiency of hospitals. Data set is given in Table 4.
Data Envelopment Analysis
DEA is a linear programming based technique for measuring the rel-ative efficiency of organizational units which has received significant attention in recent years due to its advantages over traditional methods. DEA produces a single score for each unit, which makes the compari-son easy. It is based on peer group comparicompari-son in which efficient units will form the efficient frontier and inefficient units will be enveloped by this frontier. Unlike ratios, DEA can accommodate multiple inputs and multiple outputs. These inputs and outputs can be expressed in different units of measurement.
In contrast to regression methods, DEA focuses on individual obser-vations and optimizes the performance measure of each unit. A priori knowledge of weights or prices for inputs and outputs is not required in DEA; however, managerial judgment can be accommodated when desired.
Another advantage of DEA that attracts analysts and management is its ability to identify the potential improvement for inefficient units. For units enveloped by the frontier, the inefficient units, DEA compares the
TABLE 3. Canonical Correlations
TABLE 4. Input/Output Data for Hospitals
unit with a convex combination of units located on the frontier and en-ables the analyst to indicate the sources and the level of inefficiency for each of its inputs and outputs. The indicated targets, which are shown to the inefficient units as models, are their actual peer units, therefore the results are more likely to be accepted by the managers of these units. DEA advantages resulted in the widespread application of this technique in various industries.
The value of outputs is forced to be 1 or less by the next set of con-straints. In general terms, the efficiency of a particular unit can be de-fined as
It is not possible for any service unit to be more than 100% efficient; thus, the efficiency of a unit must be less than or equal to 1
A standard model can be expressed as
Where
Z : efficiency score
Xkn: k-th input value of n-th hospital
yln: l-th output value of n-th hospital
vln,ukn weights attached to outputs and inputs of hospital n
Converting this to standard linear form, value of outputs value of in-puts implies value of outin-puts - value of inin-puts 0
According the DEA calculation rules, both input and output factors can not have negative values. If negative value occurred in any factor, a pos-itive value should be added to all DMU for adjusting to be pospos-itive. Therefore, we add 2,70 to the first, second, third, and fourth inputs and first and second outputs. After the adjustments, the input and output data for hospitals are given in Table 4.
In total six inputs and four outputs were identified. Inputs were coded x1,..,x6, and outputs were designed y1, y2, y3 and y4.
The input measures were: x1 = process management x2 = quality data and reporting x3 = employee relations
x4 = role of divisional top management and quality policy x5 = number of beds
x6 = number of physicians The output measures were: y1 = financial performance y2 = non-financial performance y3 = number of outpatients y4 = number of patient days
The objective of the model is to determine whether a hospital is inefficient–if the value of the objective function equals 1 the hospital is efficient; if it is less than 1, it is inefficient.
Model Solution and Results
The solution to the DEA models was carried out using the optimiza-tion modeling system for linear programming called LINDO (Linear,
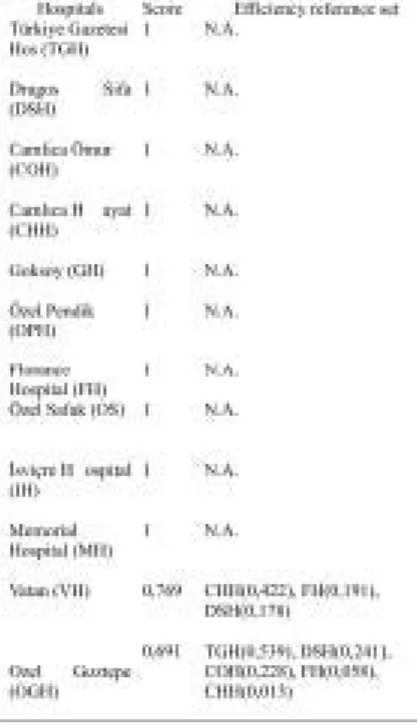
Interactive, Discrete Optimizer). The efficiency score of a certain hos-pital is given by the objective function value of its DEA model. The DEA results for the 12 hospitals that are given in Table 5 identified the comparatively efficient best practice hospitals (score = 1) and relatively inefficient hospitals (score < 1) and efficiency reference set.
According to the analysis 2 out of 12 hospitals were found ineffi-cient. These are Vatan and Ozel Goztepe hospitals. Efficiency scores of inefficient hospitals are 0,769 and 0,691, respectively. The relatively most inefficient hospital was Ozel Gostepe.
In Table 5, the value in parentheses that is associated with each mem-ber of the efficiency reference set (i.e., CHH (0,422), FH (0,191), DSH (0,178)) represents the relative weight assigned to that efficient unit in calculated the efficiency rating for Vatan. These relative weights are the shadow prices that are associated with the respective efficient unit con-straints in the linear programming solution.
TABLE 5. DEA Efficiency Ratings
In addition to the identification of inefficient hospitals and their effi-ciency reference set, DEA provides additional insights about the magni-tude of inefficiency for the inefficient hospitals. The magnimagni-tude of inefficiency is given by the magnitude excess resources (inputs) and/or deficient outputs produced by inefficient hospitals. Excess inputs or de-ficient outputs are calculated by subtracting the actual input/output val-ues of a given hospital from the ideal valval-ues of the composite (best practice) hospital.
Table 6 shows the calculation of the input/output vector for the com-posite (best practice) hospital and the magnitude of inefficiency for the least inefficient hospital (OGH).
The composite (best practice) hospital is formed from the weighted average of hospital TGH, DSH, COH, FH and CHH. Hospital OGH’s comparative efficiency rating of 0,691 indicates the extent to which the efficiency of OGH hospital is lacking in comparison to the efficiency of its reference subset hospitals.
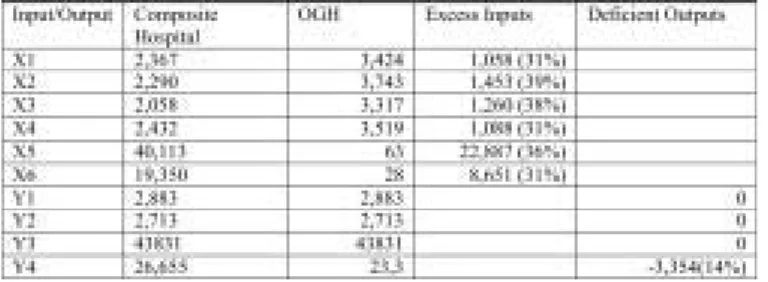
Table 7 shows the values of excess inputs and deficient outputs that existed in OGH. Excess inputs are attributed a positive sign whereas
The results that pertain to either the potential reduction in the usage of inputs or the potential increase in the production of outputs for hospi-tal OGH can be summarized as follows:
• Excess inputs for the subjective measures show the input values over the necessity for the obtained outputs. Deficient outputs show the lack of outputs obtained by means of the given resources. This result indicates that the managers perceive the subjective inputs, such as process management, data and reporting, employee rela-tions and role of top management are high but the output of num-ber of patient days is not sufficient.
• A potential reduction of 23 beds (36%). • A potential reduction of 9 physicians (31%). • A potential increase of 3,354 (14%) patient days. Discussion
TQM model contains four main factors: data reporting, role of top management, process management, and employee relations. Perfor-mance of hospitals consists of two dimensions: financial and non-finan-cial factors. In this study, as it is mentioned above, implementation of TQM in healthcare industry in Turkey is found to have a strong correla-tion with business performance (R = 0.56).
There are many purposes for gathering data in quality management. Data can be collected to determine mortality and morbidity rate in hos-pitals to understand current processes. Moreover, data provides inspec-tion, various test results and verification records. Data also are used to analyze the process using various types of statistical process control tools such as control charts, Pareto charts, cause and effect diagrams, check sheet, histograms, scatter diagram, and so on. These traditional quality tools are very useful in monitoring and measuring progress and performance. Management by facts requires that management decisions are based on relevant data and reports. In this model, data and reporting has a very strong correlation with TQM and financial performance of the hospital.
In healthcare industry, successes of TQM applications depend on a strong leadership that must be initiated by the top management. Quality TABLE 7. Computation of Excess Inputs and Deficient Outputs for Ozel Goztepe Hospital
TABLE 6. Computation of Composite Reference Set for Ozel Goztepe Hospital
improvement plans proposed by several gurus emphasize primarily the commitment of top management. In this study, role of top management and quality policy has the second highest correlation with TQM plan. Top management of the hospitals determines an appropriate organiza-tion culture, vision, and quality policy. Managers of healthcare organi-zations should determine objectives, and set specific measurable goals to satisfy customer expectations and improve their organizations’ per-formance. On the other hand, the top management must provide ade-quate resources to the implementation of quality efforts. This model implies that the managers’ role has a direct impact on the financial per-formance of the hospitals. In order to increase net profit and revenue, and to reduce cost of quality, hospital managers must convey their priorities and expectations to their employees.
Employee relations, the third factor has a sufficient correlation with TQM. In this model, employee relations have two variables. The first one is building quality awareness among employees; the second vari-able is recognition of employees for superior quality performance. Hospitals must develop formal reward and recognition systems to en-courage employee involvement, and support teamwork. In this model, employee relations have a strong correlation with non-financial perfor-mance factor. Non-financial measures contain reputation, capacity of hospital, new service design, and new market development. Non-finan-cial performance measures are better indicators of management effort and reflect the reasons for future financial performance (Hoque, 2003). Therefore, non-financial measures supplement financial measures in providing support for TQM. Hence, employee relations have also indi-rect impact on the financial performance of hospitals.
The fourth factor, process management, which includes such sub-factors as process monitoring, supervision, and preventive equipment maintenance, did not have sufficiently strong influence on TQM in this model. A possible reason for this might be the high level of personnel compliance with the implicit and explicit norms and rules of the work-place. Under such circumtances the marginal contribution to total qual-ity of the inputs used for process management (inspection, supervision, etc.) purposes would be expected to be low. This could explain the low value of the process management-coefficient in the model.
Ten hospitals out of twelve appear to be relatively efficient and the rest are not on the efficiency frontier. Inefficient hospitals can improve their performance using the same resources to become efficient. The deployment of physicians, number of beds, role of divisional top man-agement and quality policy, process manman-agement, quality data and
porting, and employee relations can be improved in the results of accurate information on the current provision of services. DEA results introduce a new dimension, but can not be generalized for population. The results also show the relationship between resource utilization and resource allocation. DEA results help top managers of hospitals by pro-viding new insights on the distribution of health resources to improve performance of hospitals.
Conclusions
TQM primarily focuses on the production of quality goods and ser-vices and the delivery of excellent customer service; however, its success increases when it is extended to the entire company. This en-ables the reformation of the corporate culture and the permeation of the new business philosophy into every facet of organization. The philosophy of doing things right must be implemented with enthusi-asm and commitment throughout the organization–from top to bot-tom and the little steps forward (called “Kaizen” by the Japanese) must be viewed as “a race without a finish.” Consequently, effective use of TQM is a valuable asset in a company’s resource portfolio– one that can produce important competitive capabilities and be a source of competitive advantage.
DEA is a powerful and efficient mechanism to evaluate efficiency of multiple input and multiple output hospitals in Turkey. DEA effi-ciency analysis can be useful in strategic planning for hospitals. In this study, four critical factors of TQM and two objective measures such as number of beds and physicians were used as inputs and two performance factors and two objective measures such as number of outpatients and number of patient days were used as outputs to evalu-ate the relative efficiency of twelve popular hospitals in Istanbul, Turkey. The least efficient hospital was identified and compared with the composite (best practice) hospital using output maximiza-tion model. The output maximizamaximiza-tion model provides informamaximiza-tion on how much performance of hospital can be improved using the same resources. Although DEA results tell nothing about the resource needs of hospitals, they say more about resource utilization. DEA of-fers many opportunities for an inefficient hospital to become effi-cient regarding its reference set of effieffi-cient units. The motivation for change is clear; other hospitals are able to achieve similar outputs with fewer resources.
REFERENCES
Al-Shammari, M. A Multi Criteria Data Envelopment Analysis for Measuring the Pro-ductive Efficiency of Hospitals. International Journal of Production & Operations Management, 1999; 19 (9); 879 - 890.
Andaleeb, S. S. Service Quality Perceptions and Patient Satisfaction: A Study of Hos-pitals in a Developing Country. Social Sciences and Medicine, 2001; 52; 1359-1370. Azaranga, M. R., Gonzalez, G., Reavill, L. An Empirical Investigation of the
Relation-ship Between Quality Improvement Techniques and Performance: A Mexican Case. Journal of Quality Management, 1998; 3(2); 265-292.
Bayyurt, N., Dilber, M., Tarim, M., Zaim, S. Critical Factors of Total Quality Manage-ment and Its Effect on Performance in Health Care Industry: A Turkish Experience, Problems and Perspectives in Management, 2005; 4.
Benson, G. P., Saraph, J. V., Schroeder, R. G. The effects of organizational context on quality management: An empirical investigation. Management Science, 1991; 37 (9); 1107-1124.
Brashier, L. W., Sower, V. E., Motwani, J., Savoie, M. Implementation of TQM/CQI in Health Care Industry A Comprehensive Model. Benchmarking for Quality Man-agement & Technology, 1996; 3(2); 31-50.
Butler, T. W., Leong, G. K. The Impact of Operations Competitive Priorities on Hospi-tal Performance. Health Care Management Science, 2000; 3; 227-235.
Charnes, A., Cooper, W. and Rhodes, E. Measuring the efficiency of decision-making units. European Journal of Operational Research, 1978; 2 (6); 429-44.
Choi, T. Y., Eboch, K. The TQM Paradox: Relations Among TQM Practices, Plant Performance, and Customer Satisfaction. Journal of Operations Management, 1989; 17; 59-75.
Crosby, P. B. Quality is Free. McGraw-Hill; 1996; 31-55.
Eggli, Y., Halfon, P. A Conceptual Framework for Hospital Quality Management. In-ternational Journal of Health Care Quality Assurance, 2003;16(1); 29-36. Farrell, M. The measurement of productive efficiency. Journal of the Royal Statistical
Society, Series A. 1957; 120(3); 253-81.
Flynn, B. B., Saladin, B. Further Evidence on the Validity of the Theoretical Models Underlying the Baldrige Criteria. Journal of Operations Management. 2001; 19; 617-652.
Flyyn, B. B., Schroeder, R. G., Sakakibara, S. The Impact of Quality Management Practices on Performance and competitive Advantage. Decision Sciences, 1995; 26(5); 659-691.
Fynes, B., Voss, C. A Path Analytic Model of Quality Practices. Quality Performance, And Business Performance. Production and Operations Management, 2001; 10(4); 494-513.
Gadenne, D., Sharma, B. An Inter-Industry Comparison of Quality Management Prac-tices and Performance. Managing Service Quality, 2002; 12(6); 394-404.
Hair, J. F., Anderson, R.E., Tatham, R.L. & Black, W.C. Multivariate data analysis, Prentice-Hall, 1998; pp. 87-120, 443, 454.
Hansson, J., Eriksson, H. The Impact of TQM on Financial Performance. Measuring Business Excellence, 2002; 6(4); 44-54.
Hoque, Z. Total Quality Management and the Balanced Scorecard Approach: A Criti-cal Analysis of Their Potential Relationships and Directions for Research. CritiCriti-cal Perspectives on Accounting, 2003; 14; 553-566.
Harris J, Ozgen H, Ozcan Y. Do mergers enhance the performance of hospital effi-ciency?. Journal of the Operational Research Society, 2000; 51 (7); 801-811. Johnson, R. A. & Wichern D. W. Applied Multivariate Statistical Analysis, 2002,
Prentice Hall.
Kenagy, J. W., Berwick, D. M., Shore, M. F. Service Quality in Health Care. The Jour-nal of American Medical Association. 1999; 281(17); 661-668.
Kunst, P., Lemmink, J. Quality Management and Business Performance in Hospitals: A Search for Success Parameters. Total Quality Management, 2000; 11(8); 1123-1133. Li, L. Relations between Determinants of Hospital Quality Management and Service Quality Performance: A Path Analytic Model. Omega, Int. J. Mgmt Sci,1997; 25(5), 535-545.
Madu, C. N., Kuei, C. H., Jacob, R. A. An Empirical Assessment of the Influence of Quality Dimensions on Organizational Performance. 1996; 34(9); 1943-1962. McAlexander, J. H., Keldenberg, D. O., Koenig, H. F. Service Quality Measurement.
Journal of Health Care Marketing, Fall, 1994;14(3); 34-39.
Meyer, S. M., Collier, D. A. An Empirical Test of the Causal Relationships in the Baldrige Health Care Pilot Criteria. Journals of Operations Management, 2001;19; 403-425.
Montes, F. J. L. M., Jover, A. V., Fernandez, L. M. M. Factors Affecting the Relation-ship Between Total Quality Management. International Journal of Quality & Reli-ability Management, 2003; 20(2);189-209.
Nwabueze, U., Kanji, G. K. A System Management Approach for Business Process Re-Engineering. Total Quality Management,1997; 8(5); 281-292.
Ovretveit, J. Japanese Health Care Quality Improvement. International Journal of Health Care Quality Assurance, 2001;14(4/5); 164-167.
Ozgen, H., Ozcan Yasar A. Longitudinal Analysis of Efficiency in Multiple Output Di-alysis Markets. Health Care Management Science, Special Issue, 2004; 7(4); 253-61. Raju, P. S., Lonial, S.C. (2002). The Impact of Service Quality and Marketing on
Fi-nancial Performance in the Hospital Industry. An Empirical Examination. Journal of Retailing and Consumer Services, 2002; 9; 335-348.
Samson, D., & Terziovski, M. The Relationship Between Total Quality Management Practices and Operational Performance. Journal of Operations Management, 1998;17; 393-409.
Saraph, J. V., Benson, G. P., Schroder, R. G. An Instrument for Measuring the critical Factors of Quality Management. Decision Science, 1989; 20; 810-829.
Stein, P. Effective Measurement of Business Performance. Annual Quality Congress Proceedings, 1998; 414-417.
Steinmann, L., Dittrich, G., Karmann, A., Zweifel, P. Measuring and Comparing the (In)Efficiency of German and Swiss Hospitals. European Journal of Health Eco-nomics, 2004; 5(3); 216-226.
Valdmanis, V., Kumanarayake, L., Lertiendumrong, J. Capacity in Thai Public Hospi-tals and the Production of Care for Poor and Nonpoor Patients. Health Services Re-search, 2004; 39(6); 2117-34.
Wilson, D. D., Collier, D. A. An Empirical Investigation of the Malcolm Baldrige Na-tional Quality Award Causal Model. Decision Sciences, 2000; 31(2); 361-390. Yang, C. C. The Establishment of a TQM System for the Health Care Industry. The
TQM Magazine, 2003;15(2); 93-98.
Yasin, M. M., Meacham, K. A., Alavi, J. The Status of TQM in Healthcare. Health Marketing Quarterly, 1998; 15(3); 61-84.
Zabada, C., Asubonteng, R., Munchus, G. Obstacles to the Application of Total Qual-ity Management in Health Care Organizations. Total QualQual-ity Management, 1998; 9(1); 57-66.
SUBMITTED: December 2006 REVISED: March 2007 ACCEPTED: May 2007 doi:10.1300/J482v12n04_05
APPENDIX A Role of Top Management and Quality Policy
1. Extent to which top executives assume responsibility for quality performance.
2. Acceptance of responsibility for quality by major department heads.
3. Degree to which top management (top executive and major de-partment heads) is evaluated for quality performance.
4. Extent to which top management supports a long term quality im-provement process.
5. Extent to which the top management has objectives (Management By Objectives) for quality performance.
6. Importance attached to quality by top management in relation to cost/revenue objectives.
7. Degree to which top management considers quality improvement as a way to increase profits.
8. Degree of comprehensiveness of the quality plan.
9. Extent to which top management has developed and communi-cated a Vision for Quality as part of a Strategic Vision of the Orga-nization.
Process Management/Operating Procedures
1. Use of statistical control charts to control processes. 2. Amount of preventive equipment maintenance. 3. Amount of inspection, review or checking of work. 4. Importance of inspection, review or checking of work. 5. Stability of work schedules.
6. Clarity of work or process instructions given to employees. Quality Data and Reporting
1. Availability of cost of quality data in the hospital.
2. Availability of quality data (mortality and morbidity, etc.). 3. Timeliness of quality data.
4. Extent to which quality data (cost of quality, mortality and mor-bidity, errors, etc.) are used as tools to manage quality.
5. Extent to which quality data are available to managers and super-visors.
6. Extent to which quality data are used to evaluate supervisor and managerial performance.
7. Extent to which quality data, control charts, etc., are displayed in work areas.
8. Scope of the quality data includes clinical performance and ser-vice/process performance.
Employee Relations
1. Extent to which employee involvement type programs are imple-mented in the hospital.
2. Effectiveness of quality teams or employee involvement type pro-grams in the hospital.
3. Extent to which the employees are held responsible for error free output.
4. Amount of feedback provided to the employees on their quality performance.
5. Degree of participation in quality decisions by hourly/non-super-visory employees.
6. Extent to which quality awareness-building among employees is ongoing.
7. Extent to which employees are recognized for superior quality performance.
APPENDIX B Performance
1. Revenue growth over the last three years. 2. Service quality as perceived by customers. 3. Market share gain over the last three years. 4. Investments in R&D aimed at new innovations. 5. Net profits.
6. Return on investment.
7. Reputation among major customer segments. 8. Capacity to develop a unique competitive profile. 9. Profit to revenue ratio.
10. Cash flow from operations.
11. New product/service development. 12. Market development.
13. Cost per adjusted discharge.
14. Mortality and Morbidity rate. 15. Return on Assets.
16. Employee Turnover. 17. Number of Admissions. 18. Share of net patient revenue. 19. Market Orientation.