Identifying side effects
of commonly used drugs
in the treatment of Covid 19
İrfan Aygün
1, Mehmet Kaya
2& Reda Alhajj
3,4,5*To increase the success in Covid 19 treatment, many drug suggestions are presented, and some clinical studies are shared in the literature. There have been some attempts to use some of these drugs in combination. However, using more than one drug together may cause serious side effects on patients. Therefore, detecting drug-drug interactions of the drugs used will be of great importance in the treatment of Covid 19. In this study, the interactions of 8 drugs used for Covid 19 treatment with 645 different drugs and possible side effects estimates have been produced using Graph Convolutional Networks. As a result of the experiments, it has been found that the hematopoietic system and the cardiovascular system are exposed to more side effects than other organs. Among the focused drugs, Heparin and Atazanavir appear to cause more adverse reactions than other drugs. In addition, as it is known that some of these 8 drugs are used together in Covid-19 treatment, the side effects caused by using these drugs together are shared. With the experimental results obtained, it is aimed to facilitate the selection of the drugs and increase the success of Covid 19 treatment according to the targeted patient.
As of December 2019, a coronavirus species that can spread from person to person was identified in Wuhan, China1. The disease later on called Covid-19 posed a risk to be declared as a pandemic by the World Health Organization (WHO) in a short time2. As of the date of this study in early June 2020, more than 6.4 million people were infected with this virus, and 373,334 persons died. It has been realized that scientists and researchers have published thousands of clinical trial results and articles in this process to provide treatment methods for the disease3. An important part of these studies examines the use of existing drugs for Covid-19 treatment, and suggests possible treatment methods4–6.
One of the issues that should be examined before recommending a drug to a patient and after treatment is the side effects of the drug. Research shows that multiple drugs usage (polypharmacy) significantly increases drug side effects7,8. For older patients, the probability of polypharmacy generally increases. However, studies clearly show that as the number of drugs used increases, the negative effects seen in patients may also increase9–11. Therefore, it is vital to predict drug-drug interactions (DDI) and adverse drug reactions (ADR) for the drugs to be used in the treatment of a disease8,12. Knowing the side effects and DDI of the drugs recommended in Covid-19 treatment will play an important role in the success of the process.
According to statistical studies, the vast majority of Covid-19 patients are seen at age 50 and over (Sobotka et al. 2020). According to the results of polypharmacy studies, regular and multiple drugs usage is over 60% in this age group7. When these two examinations are evaluated together, it is understood that the rates of multiple drugs usage for Covid-19 patients are quite high. For this reason, the importance of DDI studies increases in Covid-19 treatment.
Today, DDI research efforts are mainly conducted using computer-based methods13. In this paper, possible interactions of drugs used in Covid-19 treatment will be examined by employing graph convolutional networks. The aim of the study is to create a projection on the interactions of drugs used in Covid-19 treatment with other drugs. This way, it is aimed to contribute to increasing the success of the treatment by reducing the negative effects of the drugs. To achieve this, answers to the following questions were sought for each of the 8 drugs examined within the scope of the study.
• Which other drugs used in combination with a given drug will have the most dangerous side effects?
OPEN
1Department of Software Engineering, Celal Bayar University, Manisa, Turkey. 2Department of Computer Engineering, Fırat University, Elazığ, Turkey. 3Department of Computer Science, University of Calgary, Calgary, AB, Canada. 4Department of Computer Engineering, Isstanbul Medipol University, Istanbul, Turkey. 5Department of Health Informatics, University of Southern Denmark, Odense, Denmark. *email: [email protected]
• What are the most common side effects as a result of using another drug with a given drug?
• Which disease or organ system are mostly affected by the side effects caused by the given drug?
Related work
This section concisely reviews previous research efforts described in the literature. Firstly, DDI studies for Covid-19 treatment are investigated. Then, DDI studies, and methods with different approaches were examined.
DDI studies for the treatment of COVID 19.
Drug interactions for different drugs and disease groups were examined during the treatment of the disease. For example, it is recommended that the risks should be evaluated well before using Ritonavir/Lopinavir drugs in patients with kidney transplantation14. In addition, the need for guidelines to be prepared on this subject was emphasized. In a different study15, possible effects of drugs were investigated according to the heart rhythm graphics of patients. This research shares the side effects of the combination of Hydroxychloroquine and Azithromycin when used together in Covid-19 treatment. In a more comprehensive research, interactions of 4 different drug groups were examined16. In addition to these studies, there are websites which are available for online access by universities and pharmaceutical research laboratories (COVID-19 Drug Information, 2020; Medscape Drug Reference Database, 2020; Liverpool COVID-19 Interac-tions, 2020).Computer based DDI studies.
Extracting complex relationships from big data has become possible with today’s technology and data analysis methods. Since the concept of DDI focuses on the relationships between drugs, many studies have been conducted using data mining methods20. In such studies, a corpus with pharma-cological data on drugs is usually used. The next step is to apply data mining methods to extract relationships from this corpus21–23.Another method of relationship extraction using information technology employs neural networks24. These structures, consisting of nodes and edges, form the basis for studies that can reveal the relationships between drugs when shown by graphs. Many studies have been presented in the literature using this approach25–27. In these studies, nodes were interpreted as drugs, and edges were interpreted as interactions between drugs.
There are also DDI studies specific to a group of drugs or to drugs used to treat a specific disease, rather than focusing on the entire drug network. For example, various studies have been conducted on cancer preven-tion drugs28,29; others tackled high blood pressure patients; and some medications used in the treatment30,31. In these studies, only the risks and interactions for the examined group are calculated. Therefore, in addition to a general medical corpus, additional data needs may occur with case or disease focus. However, it becomes possible to obtain faster results because it focuses on a certain region instead of the relationships formed on the whole network.
In 2018, a DDI research called Decagon was completed; it predicts the interactions of 645 drugs32. The work done by Zitnik et al. is open to development, and its models are shared so that it can be used in different projects. Accordingly, another study (ESP) (Cohen & Widdows, 2017) representing semantic predictions in pharmaco-logical data was combined with Decagon (Burkhardt et al., 2019). The work done by Burkhardt et al. forms a resource for existing DDI researches, thanks to its rapid training and ease of reuse. In this study, in addition to the biomedical data and graph structure presented by Decagon, the infrastructure of the study conducted by Burkhardt is also used.
Materıal and methods
Datasets.
This study uses data from the study shared by Burkhardt et al. and pre-trained vectors suitable for reuse33. The dataset cluster contains the following data from Decagon.• 964 different polypharmacy side effects derived from a wider side effect dataset34, each seen at least 500 times.
• Graph network consisting of 645 drugs and 19,085 protein nodes (4,651,131 drug-drug, 18,596 drug-protein node)
• Graph network hosting protein–protein and drug-protein relationships (total 8,083,300 pieces)
The LitCovid dataset was used to determine the drugs used in Covid-19 treatment. Covid-19 focused articles published in Pubmed are updated daily and added to this dataset. As of the day of the study in Mid June 2020, there are bibliographic format and summaries of about 17,288 studies within the dataset.
DDI with graph convolutional networks (GCN).
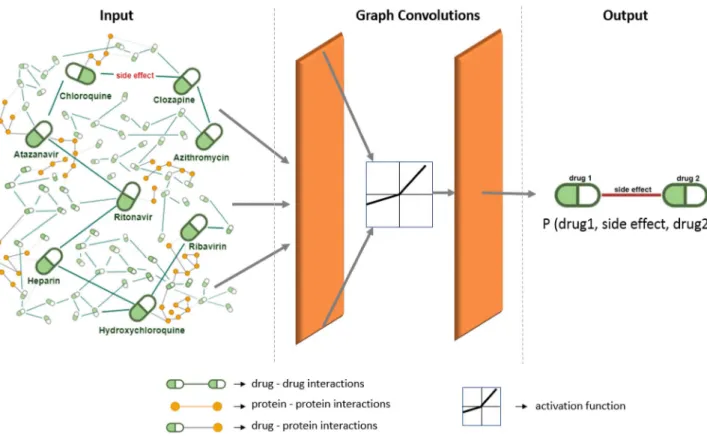
Convolutional Neural Networks (CNN) and GCN are quite similar in architectural structure. However, GCN uses graphs as input35. A standard GCN architecture is shown in Fig. 1.It is aimed to explore graph properties and signals for GCN (Kipf and Welling 2019). It is assumed that each node has the properties it has from neighboring nodes and the relationships it establishes with these nodes (Wu et al. 2019). Due to the Convolution layers and activation function (such as ReLU), the properties of all nodes are scanned. Depending on the study, the GCN output can be produced in different formats as a graph, featuring or representing bilateral relations.
Detecting relationships over biomedical data is one of the main study areas of GCN (Zhang et al. 2019). DDI studies or graph-based studies for the detection of side effects and ADRs are available in the literature. Through these studies, DDI predictions are carried out with different approaches. As shown in Fig. 2, a graph containing drugs and proteins as nodes was created in the Decagon study.
It can be easily realized from Fig. 2 that estimates of possible side effects are produced by examining drug-drug, drug-protein and protein–protein interactions. In this study, the graph shown in Fig. 2 is used as the GCN input and the results of drug interaction (in the form of drug1, drug2, side_effects) are obtained as output. Using this infrastructure, Burkhardt et al. have also classified side effects according to diseases or organ systems33.
Choosing the target drugs.
In this study, a combination of three different sources was used to select the drugs whose interactions with other drugs would be calculated. The first is the Decagon study, from which we use the network infrastructure. Another source is the LitCovid dataset, which compiles Covid-19 oriented stud-ies on PubMed. The last one is an online system called "covid19-druginteractions.org" that predicts drug interac-tions which is shared by Liverpool University.Firstly, 645 drugs from the Decagon project were chosen in the ’drug_names’ dataset. In the next step, the frequency of being in the LitCovid dataset was measured for each of these drugs. The target is to identify the most mentioned drugs in Covid 19 studies published in PubMed. In order to count the number of times the drugs were mentioned, a series of operations were performed in the LitCovid data set. To avoid producing misleading results in the frequency calculation of the terms that are mentioned in the same article, only the abstract sec-tions of the studies were searched. This way, it is easier to get more consistent results regarding the number of papers that include a drug. Data preprocessing steps have been applied to reduce the dataset only to the ’abstract’ sections and make it searchable. On the normalized data, 645 drugs were subject to frequency measurement.
After frequency measurement on the LitCovid dataset, it was realized that 543 drugs were never mentioned in the dataset. The mentioning frequency of the remaining 102 drugs in the dataset was calculated as 9.06 on average. However, when we removed the 8 most frequently used drugs from the produced list, the mentioning frequency of the remaining 94 drugs drops below 3. For this reason, experiments continued by focusing only on the first 8 drugs listed in Table 1 with their mentioning frequency in the dataset. Table 1 also shows whether the drugs obtained by the LitCovid scan are available in the online system accessible from the link: www.covid 19-drugi ntera ction s.org.
It has been observed that 6 of the selected drugs are also available on the ’http://www.covid 19-drugi ntera ction s.org’ website designed to show drug interactions for Covid-19.
Figure 1. GCN work architecture.
Figure 2. General view of the graph from the Decagon Study, where the nodes and their relationships are
Although Heparin and Clozapine drugs are not found in this system, they have been addressed in many stud-ies for Covid-19 treatment36–39. Some of the studies on these drugs have been carried out in the form of clinical trials directly on patients with Covid-19. Considering their frequent history in the literature, the two drugs Heparin and Clozapine were included in this study. The drugs to be examined within the scope of the study and the GCN architecture to be applied are shown in Fig. 3 with representative modeling. When Fig. 3 is examined, it can be eassily seen that the drug graph containing 8 focused drugs is used as the GCN input. This network will be analyzed in convolutional steps to generate side effect predictions as output. As can be seen in Fig. 3, the output format to be obtained should consist of triplets in the form (drug1—side effect—drug2).
Experiments.
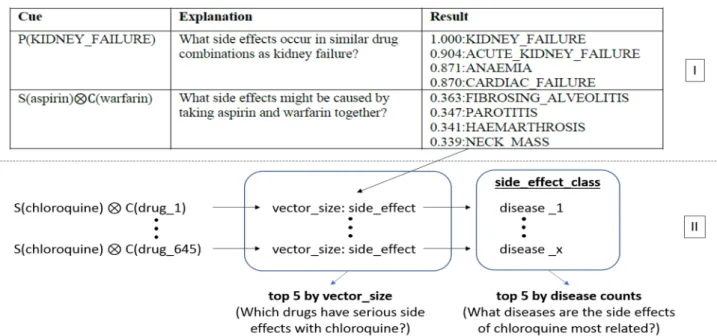
Experiments were conducted using a modified version of the project shared by Burkhardt, and using the pre-trained vectors of this project40. Thus, there was no need for the re-vectorization and training of the Decagon network of medicines and proteins. Only the drugs selected in the previous section were sent as input to the side effect estimation module used in the project. This module was then updated based on the format of each input; interactions with all drugs in the network are monitored and the 5 highest scoring results are produced. It is also possible to measure whether the side effects defined in the project are included in any disease or organ system. In another update, all the side effect results resulting from the interaction of the target drugs with other drugs were classified, and the organ systems and the disease groups that these drugs may cause the most were measured. The way the project works and its differences from previous works is depicted in Fig. 4.Table 1. Frequency of drugs according to LitCovid dataset and covid19-druginteractions.org.
Drug name Drug frequency in LitCovid Existence in the covid19-druginteractions.org system (Liverpool Uni.)
Hydroxychloroquine 265 ✓ Chloroquine 191 ✓ Azithromycin 88 ✓ Heparin 47 – Clozapine 24 – Ritonavir 15 ✓ Ribavirin 13 ✓ Atazanavir 6 ✓
The first part, shown as Section I in Fig. 4, reflects the arthitecture of the past study, while the second part represent the arthitecture of the current study. The vector representation shown in Fig. 4 was created by adding the ESP study to the Decagon study. These vectors are between 0 and 1, indicating that the effect will increase as the value gets closer to 1 and will decrease when it is closer to 0. Throughout the study, all other drugs shown in Table 1 were subject to the same steps, with Chloroquine shown in the example.
Results and discussion
In this section, the results for each of the drugs are examined under sub-headings. After the interactions of each drug were examined, the resulting side effects were classified. A drug which causes the same side effect as 25 or more drugs will have its side effects are added to the chart. This way, the most common side effects of the 8 drugs used in the experiments have been derived and visualized. Values of the area under the ROC curve (AUROC) and values of the area under precision-re-call curve (AUPRC) were used to measure the performance of the side effect predictions produced in the experiments. The average AUROC value is 0.872 and the average AUPRC value is 0.832 for the types of side effects associated with the Decagon network used in the study. These values are the results of the measurements made separately for 964 different types of side effects. The biomedical literature was consulted in order to present the predictions of the side effects produced due to polypharmacy more strongly. The findings for the drugs studied are presented together with recommendations collected from previous studies specific to these drugs.
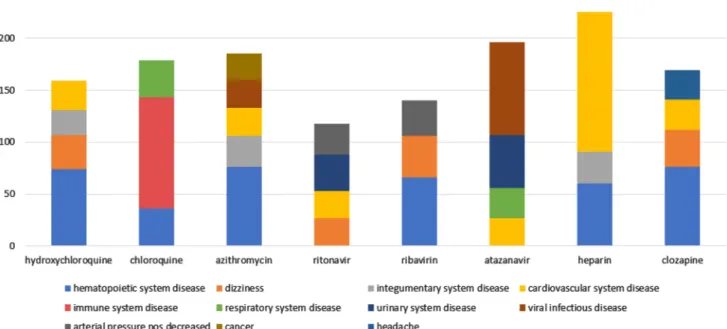
While counting side effects, the rates of the side effects were not taken into consideration. Regardless of these rates, the focus is on which disease group is mostly produced as a result of side effects. However, more detailed data by considering the rates of the side effects are reported in tables given in the sequel. In order to compare the effects of the drugs in general, the chart summarizing the side effects is shown in Fig. 5; it was produced using the 645 drugs in the dataset.
The most common side effects of drugs are seen in Fig. 5. In addition, organ systems the most damaged by these side effects are revealed. Examining the chart, it is possible to infer that Heparin has more cardiovascular system side effects than other drugs, and Chloroquine causes more side effects on the immune system. These are important to create a general drug interaction projection. According to Fig. 4, it can be observed that hemat-opoietic and cardiovascular system diseases are the most common side effects of drugs. For this reason, patients with a diagnosis of Covid 19 positive and having any of these disease groups will need special attention during the treatment. The reactions of the drugs will be examined in more detail in the following sub-headings.
Following this summary, the rest of this section addresses the following questions for each drug.
• Which are the most dangerous drugs to use in combination with a given drug?
• What are the most common side effects related to the use of other drugs with a given drug?
• Which diseases or organ systems are mostly associated with common side effects?
Ribavirin.
According to the results obtained from the experiments, the drugs which have the highest rate of side effects with Ribavirin are shown in Table 2. The table shows between 2 and 5 side effects for each drug. This variability is because different edges on the graph can show the same side effects.Figure 4. Updates on past studies and showing the logic of the current study with the example of Chloroquine.
Figure 5. The most common side effects of drugs according to the results of the experiment.
Table 2. The riskiest drugs and possible side effects with Ribavirin concomitant.
Drug name Side effects that can be seen with ribavirin concomitant Side effect rates (0–1)
Pregabalin Abnormal_gait 0.689 Balance_disorder 0.680 Aptyalism 0.678 Diplopia 0.675 Fluticasone Acute_bronchitis 0.667 Polyarthritis 0.655 Bronchitis 0.655 Duloxetine Anosmia 0.666 Excessive_sleepiness 0.658 Abnormal_gait 0.654 Valdecoxib Arthritis 0.663 Acid_reflux 0.658 Osteoarthritis 0.654 Varenicline Aptyalism 0.654 Amnesia 0.649 Insomnia 0.647
Table 3. Side effects according to the average frequency and effect rate depending on drug use with Ribavirin.
Most common side effects Number Side effects with the highest effect rate Side effect average (0–1)
Thrombocytopenia 42 Balance_disorder 0.680
Dizziness 40 Diplopia 0.675
Arterial_pressure_nos_decreased 34 Acute_bronchitis 0.667
Aspergillosis 27 Anosmia 0.666
From the experiments, the riskiest drugs to be used with Ribavirin are listed in Table 2. Among the 644 other drugs used in the study with Ribavirin, the most common side effects are shown in Table 3. There is an impor-tant issue to be considered when examining the data in this table. For the interaction of two drugs, a side effect prediction is always produced. These estimates vary between 0 and 1 with a value closer to 1 increases the likeli-hood of side effects. All the side effects produced in this study were included in the calculation. For this reason, an alternative display which considers the rates of effects is presented in the second column. In the second part of Table 3, while preparing the side effects column with the highest impact rate, the vectors created for that side effect were averaged. Other tables related to the remaining drugs have been created following the same format.
According to Table 3, due to the use of different drugs together with Ribavirin, it is likely that thrombocytope-nia and dizziness complaints may be seen. Even though these are not very common in some drug combinations (such as ribavirin-pregabalin), the loss of balance and the possibility of double vision have been calculated to be quite high.
Chloroquine.
The drugs with the highest rate of side effects in use with Chloroquine are listed in Table 4. When Table 4 is examined, the five drugs Methotrexate, Prednisolone, Folate, Omeprazole and Lisinopril when used together with Chloroquine show the highest rate of ADR. The side effects seen with Methotrexate, which is generally used for cancer patients, are also mostly associated with cancer41. These results can be inter-preted as reducing the effect of Methotrexate when Chloroquine and Methotrexate drugs are used together. It is possible to establish such connections for other drugs in the table. For instance, ’adenopathy’ affects the lymph nodes or ’lung neoplasms’ in the lungs, and are often observed in cancer cases42,43. Table 5 examines the most common side effects with Chloroquine.According to Table 5, Chloroquine has the possibility of showing the side effect defined as ’primary biliary cirrhosis’ with one of every 6 drugs in the experiment set. A study shows that this side effect is more effective on women44. With further interpretation by experts, it is aimed to increase the success in Covid 19 treatment.
Ritonavir.
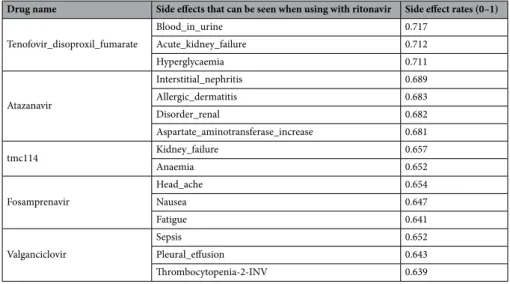
Drugs with the highest rate of side effects when used with Ritonavir are listed in Table 6.Ritonavir has a very high rate of side effects with the drugs listed in Table 6. Among these drugs, special atten-tion should be paid to Atazanavir because it is used in Covid 19 treatment45. The side effects that may occur when the two drugs are used together are mentioned in detail later on under the subheading of Atazanavir. Table 7 reports the most common side effects of Ritonavir with other drugs.
Table 4. Drugs with the highest rate of side effects when used with Chloroquine.
Drug name Side effects that can be seen when using with chloroquine Side effect rates (0–1)
Methotrexate Candida_infection 0.639 Lung_neoplasms 0.634 Adenopathy 0.632 Prednisolone Peliosis 0.571 Interstitial_nephritis 0.561 Bilirubinaemia 0.559 Agranulocytoses 0.559 Folate Herpes_zoster 0.555 Adenocarcinoma 0.550 Angiitis 0.548 Skin_lesion 0.548 Omeprazole Angiitis 0.548 Lung_neoplasms 0.545 Night_sweat 0.544 Lisinopril Bundle_branch_block_left 0.546 Cardiomyopathy 0.536
Table 5. Side effects according to average frequency and effect rate due to drug use with Chloroquine.
Most common side effects Number Side effects with the highest effect rate Side effect rate (0–1)
Primary_biliary_cirrhosis 107 Candida_infection 0.633
Tracheitis 45 Adenopathy 0.632
Anaemia_hypochromic 36 Lung_neoplasms 0.589
Kidney_transplant 35 Peliosis 0.569
According to Table 7, ’renal tubular acidosis’ may be claimed as the most common side effect of Ritonavir. The reason for ’hiv disease’ among other popular side effects is the use of Ritonavir in HIV treatment46. This result shows that some drugs reduce the effect of Ritonavir (on HIV) and cause it to lose its treatment properties.
Azithromycin.
The drugs with the highest rate of side effects when used with Azithromycin are listed in Table 8.Table 6. Drugs with the highest rate of side effects when used with Ritonavir.
Drug name Side effects that can be seen when using with ritonavir Side effect rates (0–1)
Tenofovir_disoproxil_fumarate Blood_in_urine 0.717 Acute_kidney_failure 0.712 Hyperglycaemia 0.711 Atazanavir Interstitial_nephritis 0.689 Allergic_dermatitis 0.683 Disorder_renal 0.682 Aspartate_aminotransferase_increase 0.681 tmc114 Kidney_failure 0.657 Anaemia 0.652 Fosamprenavir Head_ache 0.654 Nausea 0.647 Fatigue 0.641 Valganciclovir Sepsis 0.652 Pleural_effusion 0.643 Thrombocytopenia-2-INV 0.639
Table 7. Side effects according to average frequency and effect rate due to drug use with Ritonavir.
Most common side effects Number Side effects with the highest effect rate Side effect rate (0–1)
Renal_tubular_acidosis 35 Blood_in_urine 0.712 Arterial_pressure_nos_decreased 30 Allergic_dermatitis 0.620
Dizziness 27 Dermatitis_medicame 0.589
HIV_disease 27 Ntosa disorder_renal 0.610
Cardiovascular_collapse 26 Bronchitis 0.604
Table 8. Drugs with the highest rate of side effects when used with Azithromycin.
Drug name Side effects that can be seen when using with azithromycin Side effect rate (0–1)
Thyroxine Arthritis_infective 0.643 Vitamin_D_deficiency 0.628 Macrocytosis 0.626 Soft_tissue_injuries 0.625 Bupropion Appendectomy 0.638 Hypermetropia 0.637 Naproxen Arthritis_infective 0.629 Hypermetropia 0.624 Appendectomy 0.623 Blood_pressure_abnormal 0.620 Nicotinic_acid Cerebral_vascular_disorder 0.622 Dry_eye 0.618 Carcinoma_of_the_colon 0.615 Acetaminophen Fibrosing_alveolitis 0.617 Anisocoria 0.615 Bronchiolitis 0.615 Encephalitis_viral 0.613
According to Table 8, the drugs with the highest rate of side effects in use with Azithromycin are Thyroxin, Bupropion, Naproxen, Nicotinic Acid and Acetaminophen. It is also important to note that Azithromycin and Hydroxychloroquine drugs are used together in Covid 19 treatment47. Interactions between these two drugs were reported later on when we talk about Hydroxychloroquine. The most common side effects when using the other 644 drugs with Azithromycin are shown in Table 9.
According to Table 9, the most common side effects with Azithromycin are ’thrombocytopenia’ and ’neu-tropenia’. These two side effects are included in the hematopoietic system byconsidering the classification in the experiments. Based on this ressult, special attention should be paid when using Azithromycin for patients with hematopoietic system disease in Covid 19 treatment.
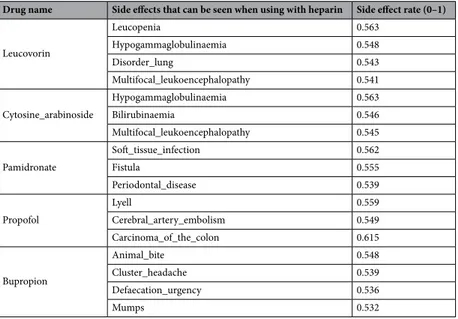
Heparin.
The drugs with the highest side effects rate when used with heparin are listed in Table 10.According to Table 10, the rates of side effects of Heparin do not reach 0.6 in any drug. Among the drugs examined within the scope of the experiments, this ratio stands out as the lowest level. Other drugs with the highest rate of ADR are Leucovorin, Cytosine Arabinoside, Pamidronate, Propofol and Bupropion. Although the rates of side effects with these drugs are low compared to other test drugs, especially the excess number of side effects shown on the cardiovascular system can be clearly seen in the bar shown in Fig. 4 and from the results reported in Table 11.
Table 9. Side effects according to average frequency and effect rate due to drug use with Azithromycin.
Most common side effects Number Side effects with the highest effect rate Side effect rate (0–1)
Thrombocytopenia 39 Appendectomy 0.630
Neutropenia 37 Macrocytosis 0.626
Lyell 30 Hypermetropia 0.625
Cardiovascular_collapse 27 Soft_tissue_injuries 0.625 Bone_marrow_failure 25 Cerebral_vascular_disorder 0.622
Table 10. Drugs with the highest rate of side effects when used with Heparin.
Drug name Side effects that can be seen when using with heparin Side effect rate (0–1)
Leucovorin Leucopenia 0.563 Hypogammaglobulinaemia 0.548 Disorder_lung 0.543 Multifocal_leukoencephalopathy 0.541 Cytosine_arabinoside Hypogammaglobulinaemia 0.563 Bilirubinaemia 0.546 Multifocal_leukoencephalopathy 0.545 Pamidronate Soft_tissue_infection 0.562 Fistula 0.555 Periodontal_disease 0.539 Propofol Lyell 0.559 Cerebral_artery_embolism 0.549 Carcinoma_of_the_colon 0.615 Bupropion Animal_bite 0.548 Cluster_headache 0.539 Defaecation_urgency 0.536 Mumps 0.532
Table 11. Side effects according to average frequency and effect rate due to drug use with heparin.
Most common side effects Number Side effects with the highest effect rate Side effect rate (0–1)
Cardiovascular_collapse 70 Cluster_headache 0.539
Heart_attack 64 Periodontal_disease 0.539
Lyell 31 Hypogammaglobulinaemia 0.537
Neutropenia 30 Dermatitis_exfoliative 0.537 Thrombocytopenia 30 Status_epilepticus-inv 0.533
According to Table 11, Heparin can cause discomfort in the cardiovascular system for one out of every 5 drugs in the test set. The effects of this drug on the cardiovascular system, and side effects such as thrombocytopenia are supported by past studies48,49. For this reason, other diseases of the patient should be considered in the process of using Heparin for individual or drug combinations in Covid 19 treatment.
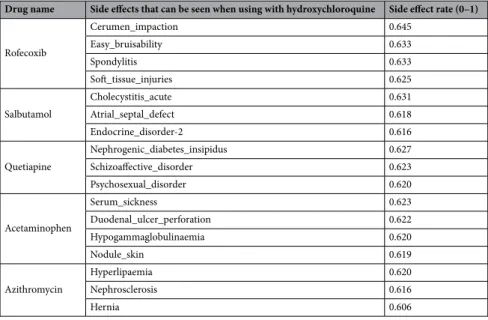
Hydroxychloroquine.
Table 12 reports five drugs with the highest rate of side effects when used together with Hydroxychloroquine.Particular attention should be paid to the use of Hydroxychloroquine with Azithromycin since both drugs may be used in Covid 19 treatment. In case of using these drugs together, side effects such as ’hyperlipidaemia’ and ’nephrosclerosis’ may occur. Previous studies showed that both side effects cause hypertension50,51. Con-comitant use of these drugs can be considered dangerous in patients at risk of hypertension. This contributes to increase the success in Covid 19 treatment in line with the main goal of the study.
Table 13 reports the most common side effects related to the use of Hydroxychloroquine. According to the experimental results shown in Table 13, one of the most common side effects related to the use of Hydroxychlo-roquine is ’Thrombocytopenia’. This result is also supported by past studies52. It may also cause dizziness due to its use with 33 different drugs.
Atazanavir.
Table 14 shares five drugs with the highest rate of side effects when used with Atazanavir. Among these drugs, Ritonavir, which is in the second place, draw attention. Because this drug is similarly used in Covid 19 treatment. For this reason, the side effects of the two drugs together should be carefully exam-ined. In addition to the side effects seen in these drugs, Table 15 presents the most common side effects related to Atazanavir use.According to the experiments, the most common side effect of Atazanavir due to multiple drug usage is ’hiv_disease’. Frequent occurrence of this side effect can be interpreted as the effect of Atazanavir is restricted by 89 different drugs. Also, Atazanavir is known as a drug used in HIV treatment53. When these results are evalu-ated, it can be concluded that many drugs can suppress the effect of Atazanavir in Corona 19 treatment. Further, ’toxic hepatitis’ is seen in the first place among the ADRs seen with the highest effect rate in Table 15. In previous studies, the increase of bilirubin value due to the use of Atazanavir singularly or with Ritonavir were attributed
Table 12. Drugs with the highest rate of side effects when used with Hydroxychoroquine.
Drug name Side effects that can be seen when using with hydroxychloroquine Side effect rate (0–1)
Rofecoxib Cerumen_impaction 0.645 Easy_bruisability 0.633 Spondylitis 0.633 Soft_tissue_injuries 0.625 Salbutamol Cholecystitis_acute 0.631 Atrial_septal_defect 0.618 Endocrine_disorder-2 0.616 Quetiapine Nephrogenic_diabetes_insipidus 0.627 Schizoaffective_disorder 0.623 Psychosexual_disorder 0.620 Acetaminophen Serum_sickness 0.623 Duodenal_ulcer_perforation 0.622 Hypogammaglobulinaemia 0.620 Nodule_skin 0.619 Azithromycin Hyperlipaemia 0.620 Nephrosclerosis 0.616 Hernia 0.606
Table 13. Side effects according to average frequency and effect rate due to drug use with
Hydroxychloroquine.
Most common side effects Number Side effects with the highest effect rate Side effect rate (0–1)
Thrombocytopenia 42 Easy_bruisability 0.633
Dizziness 33 Hyperlipaemia 0.620
Neutropenia 32 Nodule_skin 0.619
Cardiovascular_collapse 28 Erysipelas 0.615
to toxic hepatitis54. Although the other values remained constant in the serum analysis, the change of this value was observed. With the anticipation of such side effects, success is expected to increase in Covid 19 treatment.
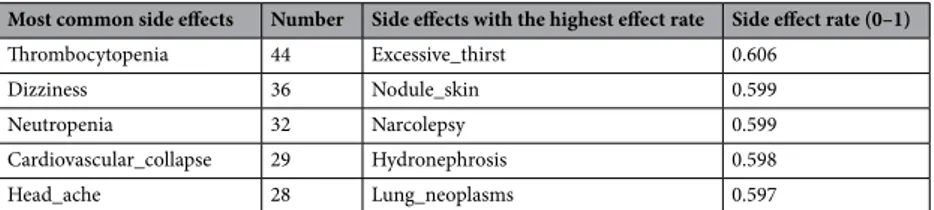
Clozapine.
As a result of the experiments, the drug estimated to produce the highest rate of side effects with Clozapine are shared in Table 16.The excessive psychological effects seen with the use of these drugs necessitate paying more attention to the usage of this drug. This is because Clozapine is used in the treatment of schizophrenia or similar psychological disorders55. Therefore, it is possible to conclude that some drugs suppress Clozapine’s treatment effect. The most common side effects and rates with other drugs are presented in Table 17.
According to Table 17, ’thrombocytopenia’ is the most common side effect associated with polypharmacy together with Clozapine. These results have been confirmed by past studies which have been reported that other side effects such as ’neutropenia’ are also common with the drug56. Within the scope of these results, the effects of Clozapine use for therapeutic purposes for Covid 19 on the psychological and hematopoietic systems should be taken into consideration. It has also been observed that the drug often causes side effects such as dizziness and headache.
Conclusion
According to the conducted experiments, DDI estimates were produced for 8 different drugs known to be used in Covid 19 treatment. In this process, the infrastructures and results of past studies have been used32,33. Within the scope of the study, in order to be able to perform drug treatment according to the patient, the systems and diseases on which each drug has the most side effects have been identified. A projection is presented to create alternative drugs or methods in the treatment of patients with these diseases or at risk. In addition, other drugs with the highest probability of side effects were calculated. As a result of the conducted research, it has been seen that the hematopoietic system is the most vulnerable organ system against DDI with the examined drugs. The second most affected system is the cardiovascular system. It has been determined that both organ systems have been exposed to serious side effects from 6 different drugs. According to the findings obtained, dizziness, headache and thrombocytopenia are the most common diseases due to multiple use of drugs. Heparin had the
Table 14. Drugs with the highest rate of side effects when used with Atazanavir.
Drug name Side effects that can be seen when using with atazanavir Side effect rate (0–1)
Lamivudine Dermatitis_medicamentosa 0.642 Hepatitis_toxic 0.641 Lymphoma 0.640 Peliosis 0.636 Ritonavir Lymphoma 0.589 Nephrotic_syndrome 0.589 Dermatitis_medicamentosa 0.588 Peliosis 0.584 Efavirenz Dermatitis_medicamentosa 0.571 Nephrotic_syndrome 0.571 Lymphoma 0.570 Disease_of_liver 0.567 Indinavir Nodule 0.570 Herpes_simplex 0.567 Hive 0.567 Didanosine Disease_of_liver 0.556 Dermatitis_medicamentosa 0.556 Nephrotic_syndrome 0.555
Table 15. Side effects according to the average frequency and effect rate of drug use associated with
Atazanavir.
Most common side effects Number Side effects with the highest effect rate Side effect rate (0–1)
HIV_disease 89 Hepatitis_toxic 0.575
Renal_tubular_acidosis 51 Cyst 0.573
Cryptococcosis 47 Nodule 0.569
Pneumocystis_carinii_pneumonia 29 Disease_of_liver 0.567
highest number of adverse reactions among the examined 8 drugs. Ritonavir, on the other hand, was the drug that had negative interactions with the fewest drugs. In addition, it is estimated that serious side effects may occur if Atazanavir and Ritonavir are used together.
With the findings of this research, it is aimed to contribute to Covid 19 treatment of patients who are in regu-lar medication use. It is very important to determine if there is a possibility that the new drug will react negatively with the drugs used regularly by the patient to treat his/her other diseases. For this reason, five different drugs that produce the highest negative interaction score with each drug and their possible side effects were shared in the study. Based on the literature, negative drug interactions of the drugs known to be used together in Covid 19 treatment were also noted. With the outputs obtained as a result of the experiments, suggestions that will con-tribute to the choices of the drug treatment of experts against Covid 19 and facilitate their choices are presented. In the study, five possible side effects were calculated for each drug to be used with the other drugs. As a result of these procedures, 25.800 possible side effects occurred for 8 drugs. Since it is not possible to share this much data within the scope of the article, only the first 5 drugs with the highest side effect rate are reported. For this reason, it is planned to transfer the study to the web environment that can show all results. Another possible study in the future will be a web-based project that will list the negative effects of the two drugs selected and indicate their rates. Similarly, a web infrastructure that controls the suitability of the drugs used for Covid 19 can be developed according to the current diseases and the drugs used by the patient. Increasing the dataset to more than 645 drugs will increase the contribution to the literature. Therefore, adding new drugs and proteins to the graph used in the current study is important in order to create an infrastructure that can be used in many DDI studies.
Received: 29 June 2020; Accepted: 27 November 2020
References
1. Wu, F. et al. A new coronavirus associated with human respiratory disease in China. Nature 579, 265–269 (2020). 2. WHO Timeline. COVID-19. https ://www.who.int/news-room/detai l/27-04-2020-who-timel ine---covid -19.
3. Sanders, J. M., Monogue, M. L., Jodlowski, T. Z. & Cutrell, J. B. Pharmacologic treatments for coronavirus disease 2019 (COVID-19): a review. JAMA 323, 1 (2020).
4. Zhou, D., Dai, S. M. & Tong, Q. COVID-19: a recommendation to examine the effect of hydroxychloroquine in preventing infec-tion and progression. J. Antimicrob. Chemother. 1, 4–7. https ://doi.org/10.1093/jac/dkaa1 14 (2020).
5. Stebbing, J. et al. COVID-19: combining antiviral and anti-inflammatory treatments. Lancet Infect. Dis. 20, 400–402 (2020). Table 16. Drugs with the highest rate of side effects when used with Clozapine.
Drug name Side effects that can be seen when using with clozapine Side effect rate (0–1)
Risperidone Psychoses 0.613 Excessive_thirst 0.611 Narcolepsy 0.599 Bupropion Birth_defect 0.606 Bleeding_gums 0.596 Thyroxine Bleeding_gums 0.605 Nodule_skin 0.601 Hydronephrosis 0.600 Lung_neoplasms 0.597 Quetiapine Excessive_thirst 0.601 Psychoses 0.595 Alcohol_consumption 0.594 Acetaminophen Hydronephrosis 0.601 Multifocal_leukoencephalopathy 0.598 Nodule_skin 0.598
Table 17. Side effects according to average frequency and effect rate due to drug use with Clozapine.
Most common side effects Number Side effects with the highest effect rate Side effect rate (0–1)
Thrombocytopenia 44 Excessive_thirst 0.606
Dizziness 36 Nodule_skin 0.599
Neutropenia 32 Narcolepsy 0.599
Cardiovascular_collapse 29 Hydronephrosis 0.598
6. Colson, P., Rolain, J. M., Lagier, J. C., Brouqui, P. & Raoult, D. Chloroquine and hydroxychloroquine as available weapons to fight COVID-19. Int. J. Antimicrob. Agents 55, 105932 (2020).
7. Guthrie, B., Makubate, B., Hernandez-Santiago, V. & Dreischulte, T. The rising tide of polypharmacy and drug-drug interactions: population database analysis 1995–2010. BMC Med. 13, 1–10 (2015).
8. Colley, C. A. & Lucas, L. M. Polypharmacy: the cure becomes the disease. J. Gen. Intern. Med. 8, 278–283 (1993).
9. Hajjar, E. R., Cafiero, A. C. & Hanlon, J. T. Polypharmacy in elderly patients. Am. J. Geriatr. Pharmacother. 5, 345–351 (2007). 10. Tatum, T., Curry, P., Dunne, B., Walsh, K. & Bennett, K. Polypharmacy Rates among Patients over 45 years. Ir. Med. J. 112, 893
(2019).
11. Lavan, A. H. & Gallagher, P. Predicting risk of adverse drug reactions in older adults. Ther. Adv. Drug Saf. 7, 11–22 (2016). 12. Pirmohamed, M., James, S., Meakin, S. & Green, C. Adverse drug reactions as cause of admission to hospital: authors’ reply. BMJ
329, 460 (2004).
13. Zhao, L., Au, J. L. S. & Wientjes, M. G. Comparison of methods for evaluating drug-drug interaction. Front. Biosci. - Elit. 2 E, 241–249 (2010).
14. Bartiromo, M. et al. Threatening drug-drug interaction in a kidney transplant patient with Coronavirus Disease 2019 (COVID-19).
Transpl. Infect. Dis. 1, 1–2. https ://doi.org/10.1111/tid.13286 (2020).
15. Roden, D. M., Harrington, R. A., Poppas, A. & Russo, A. M. Considerations for drug interactions on QTc interval in exploratory COVID-19 treatment. J. Am. Coll. Cardiol. 75, 2623–2624 (2020).
16. Elens, L. et al. Pharmacologic treatment of transplant recipients infected with SARS-CoV-2: considerations regarding therapeutic drug monitoring and drug-drug interactions. Ther. Drug Monit. 42, 360–368 (2020).
17. Drug Interactions Checker. Medscape drug reference database. https ://refer ence.medsc ape.com/drug-inter actio nchec ker. 18. Liverpool COVID-19 Interactions. https ://www.covid 19-drugi ntera ction s.org/.
19. Drug Interaction Concerns for COVID-19 Treatments | Clinical Drug Information. https ://www.wolte rsklu wercd i.com/blog/ drug-inter actio n-conce rns-covid -19-treat ments /.
20. Vilar, S., Friedman, C. & Hripcsak, G. Detection of drug-drug interactions through data mining studies using clinical sources, scientific literature and social media. Brief. Bioinform. 19, 863–877 (2018).
21. Lorberbaum, T. et al. Coupling data mining and laboratory experiments to discover drug interactions causing QT prolongation.
J. Am. Coll. Cardiol. 68, 1756–1764 (2016).
22. Iyer, S. V., Harpaz, R., LePendu, P., Bauer-Mehren, A. & Shah, N. H. Mining clinical text for signals of adverse drug-drug interac-tions. J. Am. Med. Informatics Assoc. 21, 353–362 (2014).
23. Hammann, F. & Drewe, J. Data mining for potential adverse drug-drug interactions. Expert Opin. Drug Metab. Toxicol. 10, 665–671 (2014).
24. Niepert, M., Ahmed, M. & Kutzkov Konstantinkutzkov, K. Learning Convolutional Neural Networks for Graphs. (2016). 25. Sun, X. et al. Drug-drug interaction extraction via recurrent hybrid convolutional neural networks with an improved focal loss.
Entropy 21, 1 (2019).
26. Liu, S., Tang, B., Chen, Q. & Wang, X. Drug-drug interaction extraction via convolutional neural networks. Comput. Math. Methods
Med. 2016, (2016).
27. Lim, S., Lee, K. & Kang, J. Drug drug interaction extraction from the literature using a recursive neural network. PLoS ONE 13, 1–17 (2018).
28. Preuer, K. et al. DeepSynergy: predicting anti-cancer drug synergy with deep learning. Bioinformatics 34, 1538–1546 (2018). 29. Jiang, P. et al. Deep graph embedding for prioritizing synergistic anticancer drug combinations. Comput. Struct. Biotechnol. J. 18,
427–438 (2020).
30. Bacic-Vrca, V. et al. The incidence of potential drug-drug interactions in elderly patients with arterial hypertension. Pharm. World
Sci. 32, 815–821 (2010).
31. Martha, S., Mateti, U., Neerati, V., Sivva, D. & Thiruthopu, N. Assessment of drug-drug interactions in hypertensive patients at a superspeciality hospital. Avicenna J. Med. 5, 29 (2015).
32. Zitnik, M., Agrawal, M. & Leskovec, J. Modeling polypharmacy side effects with graph convolutional networks. Bioinformatics 34, i457–i466 (2018).
33. Burkhardt, H. A., Subramanian, D., Mower, J. & Cohen, T. Predicting adverse drug-drug interactions with neural embedding of semantic predications. bioRxiv 1, 752022. https ://doi.org/10.1101/75202 2 (2019).
34. Tatonetti, N. P., Ye, P. P., Daneshjou, R. & Altman, R. B. Data-driven prediction of drug effects and interactions. Sci. Transl. Med.
4, 1 (2012).
35. Bastings, J., Titov, I., Aziz, W., Marcheggiani, D. & Sima’an, K. Graph convolutional encoders for syntax-aware neural machine translation. EMNLP 2017 - Conf. Empir. Methods Nat. Lang. Process. Proc. 1957–1967 (2017). doi:https ://doi.org/10.18653 /v1/ d17-1209.
36. Tang, N. et al. Anticoagulant treatment is associated with decreased mortality in severe coronavirus disease 2019 patients with coagulopathy. J. Thromb. Haemost. 1, 1094–1099. https ://doi.org/10.1111/jth.14817 (2020).
37. Perna, A. F. et al. COVID-19, low-molecular-weight heparin, and hemodialysis. Kidney Blood Press. Res. 45, 357–362 (2020). 38. Thachil, J. The versatile heparin in COVID-19. J. Thromb. Haemost. 1, 1020–1022. https ://doi.org/10.1111/jth.14821 (2020). 39. Leung, J. G., Wittenberger, T. S. & Schak, K. M. Clozapine treated patients and COVID-19: Ensuring continued care through
col-laboration. Schizophr. Res. https ://doi.org/10.1016/j.schre s.2020.05.030 (2020).
40. GitHub-hannahburkhardt/predicting_ddis_with_esp: predicting adverse drug-drug interactions with neural embedding of seman-tic predications. https ://githu b.com/hanna hburk hardt /predi cting _ddis_with_esp.
41. Holmboe, L., Andersen, A. M., Mørkrid, L., Slørdal, L. & Hall, K. S. High dose methotrexate chemotherapy: pharmacokinetics, folate and toxicity in osteosarcoma patients. Br. J. Clin. Pharmacol. 73, 106–114 (2012).
42. Gunn, G. B. et al. The impact of radiographic retropharyngeal adenopathy in oropharyngeal cancer. Cancer 119, 3162–3169 (2013). 43. Asamura, H. et al. A Japanese lung cancer registry study: Prognosis of 13,010 resected lung cancers. J. Thorac. Oncol. 3, 46–52
(2008).
44. Nguyen, D. L., Juran, B. D. & Lazaridis, K. N. Primary biliary cirrhosis. Best Pract. Res. Clin. Gastroenterol. 24, 647–654 (2010). 45. Luykx, J. J. et al. Safe and informed prescribing of psychotropic medication during the COVID-19 pandemic. Br. J. Psychiatry 1,
1–9. https ://doi.org/10.1192/bjp.2020.92 (2020).
46. Orrell, C. et al. Fixed-dose combination dolutegravir, abacavir, and lamivudine versus ritonavir-boosted atazanavir plus tenofovir disoproxil fumarate and emtricitabine in previously untreated women with HIV-1 infection (ARIA): week 48 results from a ran-domised, open-label, non-inferiority, phase 3b study. Lancet HIV 4, e536–e546 (2017).
47. Gautret, P. et al. Hydroxychloroquine and azithromycin as a treatment of COVID-19: results of an open-label non-randomized clinical trial. Int. J. Antimicrob. Agents 1, 105949. https ://doi.org/10.1016/j.ijant imica g.2020.10594 9 (2020).
48. Walenga, J. M. & Bick, R. L. Heparin-induced thrombocytopenia, paradoxical thromboembolism, and other side effects of heparin therapy. Med. Clin. North Am. 82, 635–658 (1998).
49. Su, H. M. et al. Heparin-induced cardiac tamponade and life-threatening hyperkalemia in a patient with chronic hemodialysis.
Kaohsiung J. Med. Sci. 21, 128–133 (2005).
51. Freedman, B. I., Iskandar, S. S. & Appel, R. G. The link between hypertension and nephrosclerosis. Am. J. Kidney Dis. 25, 207–221 (1995).
52. Demir, D., Öcal, F., Abanoz, M. & Dermenci, H. A case of thrombocytopenia associated with the use of hydroxychloroquine fol-lowing open heart surgery. Int. J. Surg. Case Rep. 5, 1282–1284 (2014).
53. Wood, R. Atazanavir: Its role in HIV treatment. Expert Rev. Anti. Infect. Ther. 6, 785–796 (2008).
54. Burger, D. et al. The effect of atazanavir and atazanavir/ritonavir on UDP-glucuronosyltransferase using lamotrigine as a phenotypic probe. Clin. Pharmacol. Ther. 84, 698–703 (2008).
55. Warnez, S. & Alessi-Severini, S. Clozapine: a review of clinical practice guidelines and prescribing trends. BMC Psychiatry 14, 102 (2014).
56. Kate, N., Grover, S., Aggarwal, M., Malhotra, P. & Sachdeva, M. S. Clozapine associated thrombocytopenia. J. Pharmacol.
Phar-macother. 4, 149–151 (2013).
Author contributions
M.K. and R.A. defined the problem and helped in developing the methodology. I.A. did the implementation, run the experiments and wrote the first draft. M.K. and R.A. edited and proofread the subsequent versions of the manuscript.
Competing interests
The authors declare no competing interests.
Additional information
Correspondence and requests for materials should be addressed to R.A. Reprints and permissions information is available at www.nature.com/reprints.
Publisher’s note Springer Nature remains neutral with regard to jurisdictional claims in published maps and
institutional affiliations.
Open Access This article is licensed under a Creative Commons Attribution 4.0 International
License, which permits use, sharing, adaptation, distribution and reproduction in any medium or format, as long as you give appropriate credit to the original author(s) and the source, provide a link to the Creative Commons licence, and indicate if changes were made. The images or other third party material in this article are included in the article’s Creative Commons licence, unless indicated otherwise in a credit line to the material. If material is not included in the article’s Creative Commons licence and your intended use is not permitted by statutory regulation or exceeds the permitted use, you will need to obtain permission directly from the copyright holder. To view a copy of this licence, visit http://creat iveco mmons .org/licen ses/by/4.0/.