THE CASE OF COMMERCIAL BANKS
BETWEEN 2002 AND 2007
HÜSNÜ METE GÜNEŞ
106621015
İSTANBUL BİLGİ ÜNİVERSİTESİ
SOSYAL BİLİMLER ENSTİTÜSÜ
SAYISAL FİNANS YÜKSEK LİSANS PROGRAMI
SİNA ERDAL
2009
2002 ve 2007 Yılları Arası
Ticari Bankaların Durumu
Hüsnü Mete Güneş
106621014
Tez Danışmanının Adı Soyadı (İMZASI) : Sina Erdal ……….
Jüri Üyelerinin Adı Soyadı (İMZASI) : Ege Yazgan ……….
Jüri Üyelerinin Adı Soyadı (İMZASI) : Engin Volkan ……….
Tezin Onaylandığı
Tarih
:
...
Toplam Sayfa Sayısı: 28
Anahtar Kelimeler (Türkçe)
Anahtar Kelimeler (İngilizce)
1) Ticari Türk Bankaları
1) Turkish commercial banks
2)
VZA
2)
DEA
The purpose of this study is to analyze the efficiency of Turkish commercial banks between the years 2002 and 2007, a period when Turkish banking sector entered a deep re-structuring process immediately after the two big financial crises in 2000 and 2001. The cost, allocative, technical, pure technical and scale efficiencies are estimated by employing a non-parametric Data Envelopment Analysis. Using these efficiency scores, the correlations of X-efficiency for Turkish commercial banks are investigated with a number of factors such as ownership, time effect and other important bank traits. The raw efficiency scores show that there is an upward trend in efficiency especially after 2004 with the help of financial stability in the sector. Moreover, the empirical model shows that the foreign banks are more X-efficient in terms of technical and pure technical efficiency than their domestic peers. For time effect, the results suggest that Turkish banks tend to improve their efficiency especially after 2005. In addition, other important bank traits such as proportion of nonperforming loans in total credit volume, capital adequacy ratio and the ratio of other operating expenses to total operating income have a statistically significant impact on various efficiency scores. This study may help to give certain insights to bank managers, policy makers and potential new entrants to the market.
Bu çalışmanın amacı ticari Türk bankalarının 2000 ve 2001 ekonomik krizlerinin hemen ardından Türk bankacılık sektörünün köklü bir yeniden yapılanma sürecine girdiği bir dönemde yani 2002-2007 yılları arasındaki etkinliğini incelemektir. Maliyet, dağıtım, teknik, saf teknik ve ölçek etkinlikleri parametrik olmayan Veri Zarflama Analizi kullanılarak elde edilmiştir. Bu değerler kullanılarak mülkiyet, zaman etkisi ve diğer önemli banka özellikleri gibi etkenlerle ticari Türk bankalarının X-etkinliğinin koralasyonu incelenmiştir. Ham etkinlik değerleri, sektördeki finansal istikrarın yardımıyla özellikle 2004’ten sonra etkinliğin artma eğiliminde olduğunu göstermektedir. Üstelik, ampirik modele göre yabancı bankalar yerlilere göre teknik ve saf teknik etkinlik açısından daha X-etkindir. Zaman etkisine bakıldığında, sonuçlar ticari Türk bankalarının 2005 yılından itibaren teknik etkinliğinin arttığını göstermektedir. Ayrıca, toplam kredi hacmi içindeki sorunlu kredilerin oranı, sermaye yeterlilik oranı ve toplam faaliyet gelirleri içinde diğer faaliyet giderlerinin oranı gibi diğer önemli özelliklerin çeşitli etkinlik değerleri üzerinde istatistiksel olarak önemli etkileri vardır. Bu çalışma, banka yöneticilerine, stratejistlere ve piyasaya yeni gireceklere sektöre dair bir anlayış geliştirmede yardımcı olabilir.
TABLE OF CONTENTS
INTRODUCTION ... 1
1. DEA METHODOLOGY ... 4
2. LITERATURE REVIEW ... 8
3. DATA AND METHODOLOGY ... 10
4. EMPIRICAL RESULTS ... 14
A. Time effect (Stability): ... 17
B. Ownership structure: ... 20
C. Other bank traits: ... 21
CONCLUSION ... 24
REFERENCES ... 26
INDEX OF TABLES AND FIGURES
Table 1.1: Banking Sector Growth in Turkey ... 2
Table 2.1: CRS Model In Input- and Output-Oriented Versions ... 7
Table 3.1: The Number of Banks in Turkey ... 10
Table 4.1: Mean Efficiency Estimates - Overall Efficiency... 14
Table 4.2: Mean Efficiency Estimates - Ownership ... 15
Figure 4.1: Interest Rate and Consumer Price Index for 2002 to 2007 ... 16
Table 4.3: Regression Analysis of Potential Correlates of Efficiency Estimates ... 18
INTRODUCTION
This study focuses on the efficiency of the banking sector in Turkey between the years 2002 and 2007. Using a non-parametric approach, namely Data Envelopment Analysis (DEA), the objective is to analyze the X-efficiency performance of Turkish banks during 2002 - 2007 to see how far Turkish banking sector has progressed in terms of legislation, competition and efficiency. X-efficiency scores calculated by DEA show how close an observed bank is to an estimated “best-practice” frontier. Non-frontier scale or scope efficiency scores are estimated using a bank’s outputs while frontier efficiency is concerned with a bank’s use of inputs. X-efficiency refers to how well a bank is utilizing its inputs relative to comparable leading banks on the efficient frontier. Recent literature has attempted to evaluate X-efficiencies in various European banking markets (Altunbas et al. 2001, Berg 1993). Berger and Humphrey (1994) state that X-efficiency is more important than scale and scope economies taking into account the managerial ability to control costs.
After the two big financial crises in 2000 and 2001, the macroeconomic environment led to important and remarkable changes in Turkish banking sector. The profitability of banks was affected by the crises as interest rates rose, the Turkish Lira depreciated immensely and the economy contracted rapidly. As a result, the number of banks, branch networks, and the number of employees were all reduced, bank capital had to be strengthened and mergers and acquisitions were promoted with tax incentives.
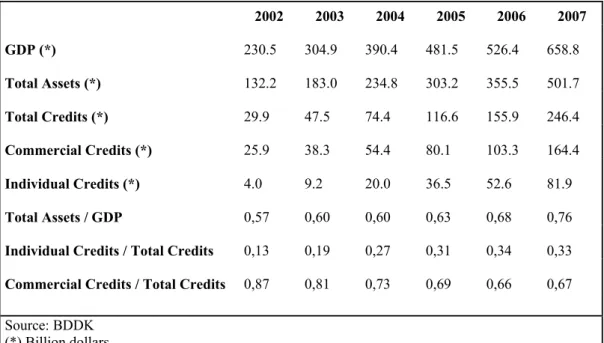
The 2001 crisis harmed the financial system significantly and caused many banks to declare bankruptcy. The balance sheets got weak and Turkish people’s confidence in the banking sector was damaged. However, the crisis created a chance in the sense that banking sector in Turkey had to be restructured. Turkish banks have improved the capital structure of their balance sheets and employed new credit evaluation and risk management techniques. The regulators (mainly the Banking Regulation and Supervision Agency, BDDK) also strengthened the prudent supervision over the financial system in line with European standards. The growth rate in the sector after the crisis is well above the overall Turkish Economy. Table 1.1 shows that the total assets increased from 132.2 billion dollars in 2002 to 501.7 billion dollars in 2007, thereby the Total Assets/GDP ratio ascended from 57% to 76%.
Table 1.1: Banking Sector Growth in Turkey 2002 2003 2004 2005 2006 2007 GDP (*) 230.5 304.9 390.4 481.5 526.4 658.8 Total Assets (*) 132.2 183.0 234.8 303.2 355.5 501.7 Total Credits (*) 29.9 47.5 74.4 116.6 155.9 246.4 Commercial Credits (*) 25.9 38.3 54.4 80.1 103.3 164.4 Individual Credits (*) 4.0 9.2 20.0 36.5 52.6 81.9 Total Assets / GDP 0,57 0,60 0,60 0,63 0,68 0,76 Individual Credits / Total Credits
0,13 0,19 0,27 0,31 0,34 0,33 Commercial Credits / Total Credits
0,87 0,81 0,73 0,69 0,66 0,67 Source: BDDK (*) Billion dollars
The striking success of the Turkish banks in this period is one of the most important reasons for foreign banks to acquire domestic banks. After all these developments Turkish banking sector has become a focal point for foreign banks and many Turkish banks were bought by foreigners either wholly or partially.
In this study, we first employ a nonparametric approach and estimate the cost (CE), allocative (AE), technical (TE), pure technical (PTE) and scale (SE) efficiency scores for Turkish banks for 2002 - 2007. Afterwards, using the estimated efficiency scores, we investigate the correlation of X-efficiency in Turkey with a number of factors including ownership and other bank traits like capital adequacy ratio, non performing loans to total credits ratio etc. As Berger and Humphrey suggest (1997), studies related to the potential correlates of efficiency can augment the efforts to identify best and worst practices associated with high and low efficiency in the banking sector. This study aims to give certain insights to bank managers, policy makers and potential new entrants to the market.
With this aim the study is organized as follows: Chapter 1 describes the DEA theory and model. Chapter 2 reviews the literature on Turkish banking sector studies using DEA techniques. Chapter 3 briefly describes the data and the methodology used to evaluate the
efficiency estimates. Chapter 4 presents the empirical results and a discussion on findings. Our
1.
DEA METHODOLOGY
Data Envelopment Analysis (DEA) is a nonparametric, multifactor, linear programming based technique for measuring the relative efficiency of decision making units (DMUs). DEA estimates an efficient frontier over the sample data and calculate the efficiencies of each DMU relative to this frontier. One of the major advantages of DEA is that, this approach does not require specification of functional form. In other words, DEA does need neither a priori information about the underlying functional form nor weights among different inputs and outputs (Ayan and Percin, 2006). However, with no allowance made for noise in other models, DEA’s weakness is that all deviations from the efficient frontier are attributed to inefficiency (Isik and Hassan, 2003).
There are two alternative approaches (input and output orientation) in DEA to estimate the efficient frontier. One is input oriented analysis which was first proposed with the term DEA by Charnes, Cooper and Rhodes (1978). The other alternative approach is the output orientation. The input oriented model minimizes the inputs while the outputs are kept at their current levels, whereas output oriented model looks for maximum output level with the given inputs.
Charnes, Cooper and Rhodes’s model assumed constant returns to scale (CRS) which only fits when all DMUs operate at on optimal scale. Later studies extended the DEA methodology with alternative set of assumptions. By controlling the returns to scale constraint which refers to increasing or decreasing efficiency based on size, it is easy to construct models like variable returns to scale (VRS), non-increasing returns to scale (NIRS) and non-decreasing returns to scale (NDRS).
Cost efficiency (CE) of a bank defines a composite measure of productive efficiency that includes allocative efficiency (AE) and technical efficiency (TE) [CE=AE*TE]. Allocative inefficiency refers to failure of banks in choosing correct input combination given their factor
prices while TE measures the ratio of inputs technically necessary to the inputs actually employed.
The CE of each observation indicates the amount by which cost of production is increased due to TE and AE. For example, a CE score of 0,85 for a bank indicates that the bank could save 15% of the costs by being fully efficient. TE simply means the maximum possible output for each combination of inputs. Banks producing on the frontier are efficient, while banks inside the frontier are inefficient. For instance, consider a banking industry which uses a single input, which can be converted into output. In this case, a bank using one unit of the input to produce one unit of output would get TE score of 1 (1/1) or 100% efficiency. Another bank using six units of input and producing three units of output would get TE score of 0,5 (3/6) or 50% efficiency. A score of 0,5 for a bank indicates that the bank could raise output by 50% by becoming efficient and moving to the frontier.
CRS assumption is suitable when all firms operate at an optimal scale while imperfect competition may cause one to be operating at an inefficient scale (Isik and Hassan, 2003). VRS assumption permits the calculation of TE devoid of the scale efficiency (SE) effects. Appling VRS assumption, TE scores calculated with CRS assumption can be decomposed into pure technical efficiency (PTE) and SE. PTE refers a proportional reduction in input usage if inputs are not wasted where SE indicates a proportional reduction in input usage if the bank can achieve the optimum production level. In this sense, SE scores are residuals since they are the difference of TE scores calculated under VRS and CRS assumptions [TE=PTE*SE]. Efficiency scores for a specific DMU are calculated by maximizing the ratio of weighted sum of outputs to weighted sum of inputs. The performance of each DMU is measured relative to the performance of all other DMUs.
Assume that there are n DMUs to be evaluated each of which consumes varying amounts of m different inputs to produce s different outputs. Let, DMU consumes amount xij of input i and
produces amount yrj of output r. Assume that xij 0 and yrj 0 and further assume that each
As introduced by Charnes, Cooper, and Rhodes (1978), the ratio of outputs to inputs is used to measure the relative efficiency of the DMU = DMU to be evaluated relative to the ratios of all of the DMUs (j= 1, 2, …, n). For a particular DMU the ratio of this single virtual output to single virtual input provides a measure of efficiency that is a function of the multipliers. This ratio, which is to be maximized, forms the objective function for the particular DMU (DMU ) being evaluated, where the variables are the ur’s and the vi’s and the yro’s and xio’s are the
observed output and input values. Since the virtual output to input ratio must be less than or equal to one, the mathematical model is stated as follows.
max ho (u,v) = ∑r ur yro / ∑i vi xio
subject to ∑r ur yrj / ∑i vi xij 1 for j = 1, 2,….., n,
ur , vi ≥ 0 for all i and r.
The above ratio form yields an infinite number of solutions; if (u*, v*) is optimal, then ( u*, v*) is also optimal for > 0. However, Charnes, Cooper, and Rhodes (1978) presented the multiplier form of the linear programming model below, where is a scalar variable measuring the level of efficiency under input oriented CRS model.
max = ∑
subject to ∑ - ∑ 0 for j = 1, 2,….., n,
∑ = 1
ur , vi ≥ 0 for all i and r.
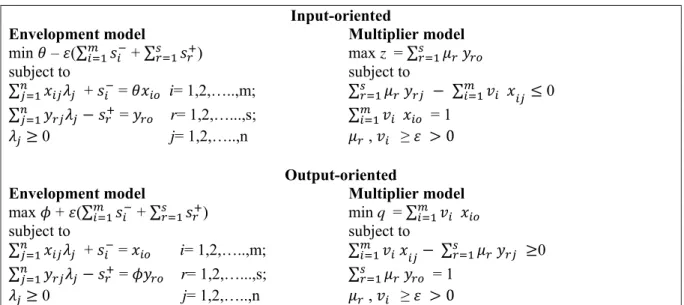
Table 2.1 presents the CRS model in input- and output-oriented versions, each in the form of a pair of dual linear programs.
Table 2.1: CRS Model In Input- and Output-Oriented Versions
Input-oriented
Envelopment model Multiplier model
min – (∑ + ∑ ) max z = ∑ subject to subject to ∑ + = i= 1,2,…..,m; ∑ ∑ 0 ∑ = r= 1,2,…...,s; ∑ = 1 0 j= 1,2,…..,n , ≥ 0 Output-oriented
Envelopment model Multiplier model
max + (∑ + ∑ ) min q = ∑
subject to subject to
∑ + = i= 1,2,…..,m; ∑ ∑ 0 ∑ = r= 1,2,…...,s; ∑ = 1
0 j= 1,2,…..,n , ≥ 0
These are known as CCR (Charnes, Cooper and Rhodes, 1978) models. If the constraint ∑ λ = 1 is adjoined, the envelopment model becomes VRS which is known as BCC (Banker, Charnes, Cooper, 1984) models.
min – (∑ + ∑ )
subject to ∑ + = i= 1,2,…..,m; 1 = ∑
2.
LITERATURE REVIEW
Zaim (1995) studies the effect of post-1980 financial liberalization policies on the economic efficiency of Turkish commercial banks using a nonparametric frontier method (DEA). He finds that the number of efficient banks have increased over time. In addition, during his analysis period banks have achieved optimal scale.
Isik and Hassan (2002) investigate five different estimates of non-stochastic efficiency scores (cost, allocative, technical, pure technical and scale efficiency) along with stochastic cost and alternative profit efficiencies for Turkish banks over 1988 - 1996. Their study indicates that the product efficiencies of the banking sector consistently fell over time because of the increase in cost of funding and growth of the banks. They also suggest that the major source of cost inefficiency is technical inefficiency rather than allocative inefficiency. Isik and Hassan (2002) suggest that the relationship between size and efficiency is strongly negative implying that competition might have induced more market discipline on small banks. For their analysis period, Isik and Hassan (2002) find that foreign banks are more efficient than their domestic peers unlike their counterparts in the US.
Yıldırım (2002) also analyzes the efficiency of the Turkish banking sector between 1988 and 1999 using DEA. He suggests that over the analysis period both pure technical and scale efficiency estimates show a great variation and the sector does not achieve sustained efficiency gains. He concludes that in the later years of the analysis foreign banks’ performance are relatively less affected by the unpromising macroeconomic environment than privately owned banks. Finally, he finds that efficient banks are more profitable and pure technical efficiency and scale inefficiency are positively related to size.
Isik and Hassan (2003) employ a non-stochastic approach to estimate the efficiency estimates of Turkish commercial banks between 1988 and 1996. They test the impact of ownership, market structure, control and governance and other bank traits like education profile of the employees, bank’s age and asset growth. Their findings suggest that public and foreign banks outperform private banks in terms of cost and technical efficiency. They conclude that the
banks of different sizes might be equally efficient. They also find that efficient banks have a greater loan portfolio and use more purchased deposits to fund riskier assets. Their study shows that the loan quality is better in efficient banks.
Şakar (2006) applies a Malmquist DEA in order to analyze the Turkish commercial banking performance for the banks publicly traded in Istanbul Stock Exchange with an output oriented DEA method between 2002 and 2005.
Ayan and Percin (2006) evaluate the efficiency of commercial banks in Turkey using a Data Envelopment Analysis (DEA) and Malmquist Productivity Index (MPI) methodologies. In their study they select two outputs, namely, total loans and non-interest income, and four inputs: the number of employees, physical capital, non-deposit funds and total deposits for 2003 and 2004. Their results suggest that state owned banks are more efficient than privately owned banks and foreign banks in the commercial banking industry in Turkey. They conclude that further research efforts using consistent data or different inputs or outputs with different time periods may be highly valuable to track the efficiency changes over a certain period of time.
3.
DATA AND METHODOLOGY
This study uses data from the detailed balance sheets and income statements of the banks that operated in the years between 2002 and 2007 in Turkey. The data is obtained from various publications of the Banks Association of Turkey (TBB) database. Throughout this period the number of banks in Turkey has been decreasing due to both merger and acquisition activities and liquidation of some insolvent banks.
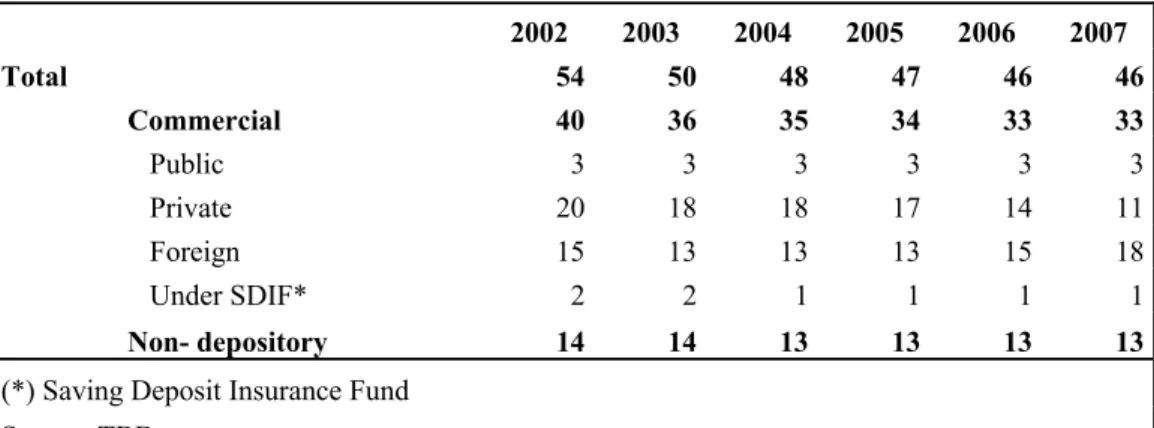
Table 3.1 shows the numbers of banks according to their types for each year. Table 3.1: The Number of Banks in Turkey
2002 2003 2004 2005 2006 2007 Total 54 50 48 47 46 46 Commercial 40 36 35 34 33 33 Public 3 3 3 3 3 3 Private 20 18 18 17 14 11 Foreign 15 13 13 13 15 18 Under SDIF* 2 2 1 1 1 1 Non- depository 14 14 13 13 13 13
(*) Saving Deposit Insurance Fund Source: TBB
There is a total of three commercial public banks in each year. Since the number of public banks did not change throughout the period, the decline in the number of banks in the sector is attributed to the decline in the number of private banks, particularly the domestic ones. The number of commercial foreign banks, however, increased to 18 in 2007. In each year commercial banks outnumber the non-depository banks.
In order to create a consistent model and elaborate on efficiency scores, our sample has been narrowed based on the following rules. First of all, only commercial bank data are included to avoid the comparison problems among different types of banks that have different objectives, technologies and strategies. For instance, after the 2000 and 2001 crises, liquidation of some insolvent banks has been carried out by the Saving Deposit Insurance Fund (TMSF). Since the balance sheets and income statements are not realistic, these banks are also excluded from the model in order not to distort the efficiency scores. Private and public banks may have different
objectives. Public banks are under political pressure and may have different managerial objectives with regard to loan approvals, branch locations and human resources strategies. Therefore, as a third rule, public banks are not included in the model. The fourth rule concerns the size of branch network. Banks with little branch presence typically carry large investment portfolios and little in loans. In order to elaborate a more robust model, banks that have less than six branches are excluded. Table 3.2 shows the banks in Turkey according to their asset, deposit and credit sizes.
There are two main approaches to the choice of inputs and outputs for financial institutions. The production approach assumes that financial institutions are thought of as primarily producing services for account holders. The best way of measuring output under this approach is calculated by the number and type of transactions or documents processed, which are not generally available, over a given time period. The intermediation approach assumes that financial institutions are thought of as primarily intermediating funds between savers and investors. The dollar values of loans and other major assets are used as banks outputs since service flow data are not usually available. Since only physical inputs are needed to perform transactions and process financial documents, production approach includes only physical inputs such as labor, capital and their costs to the analysis. However, intermediation approach includes funds and interest expenses in the analysis since, funds are the basic element intermediating between savers and investors. Neither of these approaches is superior to the other however, production approach is somewhat better for evaluating the branches since they are in micro scale and the branch managers have little influence on funding and investment decisions. The intermediation approach is better for analyzing the entire financial institution since cost of funds is the major item of total costs (Berger and Humphrey, 1997).
Based on our inclusion criteria, we are able to account for an average of approximately 63% of the total assets, 61% of the total deposits and 72% of the total credits of the Turkish banking sector. As in the widely used intermediation approach (Berger and Humphrey, 1997) our banks are defined as multi-product firms which generate two outputs (loans and other earning assets) from three inputs (labour, capital and loanable funds). Loans can be commercial, corporate or retail. To account for the quality of the loan portfolio, the non-performing loans
are removed. Other earning assets include total assets minus loans and all other illiquid assets. Labour is the total number of employees per year. Capital consists of the book value of premises and fixed assets. Loanable funds are the sum of deposit and non-deposit funds. Price of labour is calculated by dividing total expenditures on employees by total number of employees. Similarly, price of capital is calculated by dividing total expenditures on premises and fixed assets by the book value of premises and fixed assets. As the last input price, price of loanable funds is the total interest expenses divided by sum of deposits and non-deposit funds.
Although the currency of the data obtained from TBB is in Turkish Lira (TL), in order to mitigate the general price level effect throughout the study period, the TL terms have been converted to United States Dollars (USD). For in and off balance sheet items, the year-end currencies have been used since, balance sheet describes a snapshot of a bank's financial condition. However, the income statement represents a period of time. This contrasts with the balance sheet, which represents a single moment in time. So, for the income statement items, the annual average of the USD/TL currency has been used.
Table 3.2: The Size of Banks in Turkey According to Their Asset, Deposit and Credit Volume
Total Assets Total Deposits Total Credits
2002 2003 2004 2005 2006 2007 2002 2003 2004 2005 2006 2007 2002 2003 2004 2005 2006 2007 TOTAL 100% 100% 100% 100% 100% 100% 100% 100% 100% 100% 100% 100% 100% 100% 100% 100% 100% 100% Commercial 96% 96% 96% 97% 97% 97% 100% 100% 100% 100% 100% 100% 89% 91% 93% 95% 95% 96% Public 32% 33% 35% 31% 30% 29% 34% 38% 42% 38% 36% 36% 17% 18% 21% 21% 22% 23% Private 56% 57% 57% 60% 55% 52% 58% 57% 55% 57% 52% 50% 65% 67% 67% 67% 59% 55% Foreign 3% 3% 3% 5% 12% 15% 2% 2% 3% 5% 12% 14% 4% 4% 5% 7% 15% 19% Under SDIF* 4% 3% 1% 0% 0% 0% 5% 3% 0% 0% 0% 0% 3% 1% 0% 0% 0% 0% Non- depository 4% 4% 4% 3% 3% 3% 0% 0% 0% 0% 0% 0% 11% 9% 7% 5% 5% 4%
(*) Saving Deposit Insurance Fund Source: TBB
4. EMPIRICAL RESULTS
In the first iteration of our analysis, we estimate six separate annual efficiency frontiers (2002 to 2007). By doing this, we will be able to explore most of the banks more than once. This approach implicitly assumes that the deviations from the frontier due to random errors tend to average out over time in a panel dataset (Berger 1995). This also allows us to account for expansion or contraction during the period resulting from the changes in the banking sector. Thus, constructing an annual frontier specific to each year is more flexible and more appropriate than estimating a single multiyear frontier (DeYoung and Hasan, 1998; Isik and Hassan, 2002). Previous studies on testing whether efficiency estimates are identical between common and separate frontier results fail to reject the null hypothesis (Isik and Kyj, 2008). Therefore, further efficiency scores are presented on the basis of common frontier. Table 4.1 to 4.2 depicts the mean values of the estimated efficiency scores based on various forms. The numbers are calculated based on our inputs, outputs and input prices by using the Excel Solver (Microsoft© Excel DEA Add-In).
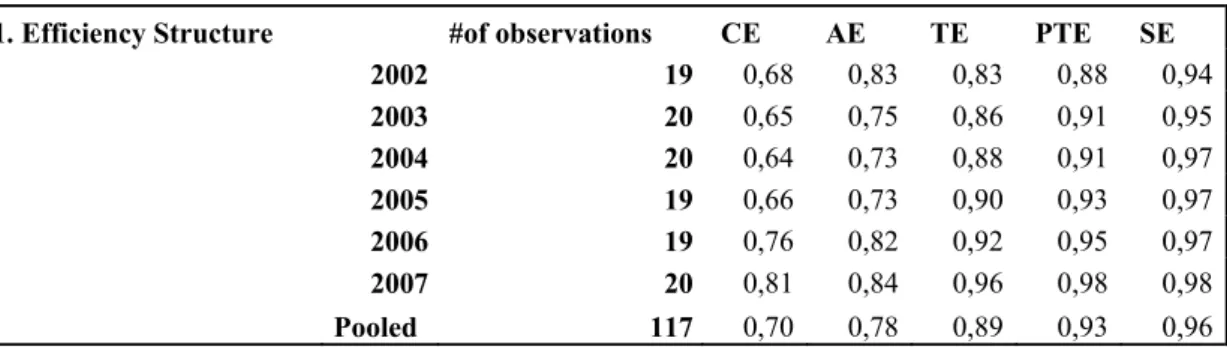
Table 4.1: Mean Efficiency Estimates - Overall Efficiency
1. Efficiency Structure #of observations CE AE TE PTE SE
2002 19 0,68 0,83 0,83 0,88 0,94 2003 20 0,65 0,75 0,86 0,91 0,95 2004 20 0,64 0,73 0,88 0,91 0,97 2005 19 0,66 0,73 0,90 0,93 0,97 2006 19 0,76 0,82 0,92 0,95 0,97 2007 20 0,81 0,84 0,96 0,98 0,98 Pooled 117 0,70 0,78 0,89 0,93 0,96
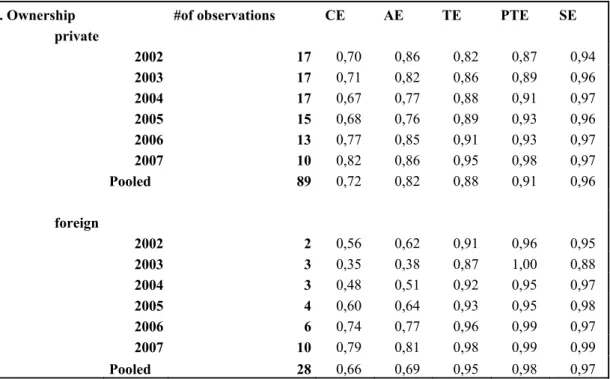
Table 4.2: Mean Efficiency Estimates - Ownership
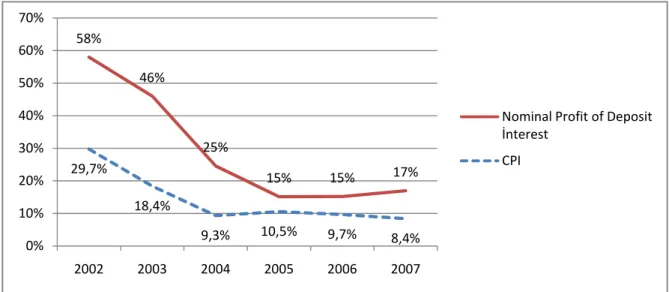
When we look at the overall efficiency scores, there is an upward trend especially after 2004, when the effect of crises began to vanish and financial stability arises along with the political stability. The downward trend in inflation decreased interest rates which also decreased cost of funds. Figure 3.1 depicts the nominal profit for deposit interest and consumer price index (CPI) for the period 2002 and 2007. The GDP of Turkey also has an upward trend throughout 2002 - 2007. GDP was 230.5 billion USD in 2002 and increased to 658.8 in 2007.1 The growth of the banking sector was even greater than the growth in GDP.2 With the help of low
interest rates, retail demand for loans (especially mortgages) increased. The share of individual loans in total credit volume was 13% in 2002 and increased to 33% in 2007.3 This development assists the banks to increase their revenues (especially the fees and commissions) and to diversify their credit risk.
1 Table 1.1: Banking Sector Growth in Turkey (source: BDDK)
2 The GDP growth between 2002 and 2007 is 186%, the asset size of Turkish banks for the same period increased 280%. Table 1.1: Banking Sector Growth in Turkey (source: BDDK).
3 Table 1.1: Banking Sector Growth in Turkey (source: BDDK)
2. Ownership #of observations CE AE TE PTE SE
private 2002 17 0,70 0,86 0,82 0,87 0,94 2003 17 0,71 0,82 0,86 0,89 0,96 2004 17 0,67 0,77 0,88 0,91 0,97 2005 15 0,68 0,76 0,89 0,93 0,96 2006 13 0,77 0,85 0,91 0,93 0,97 2007 10 0,82 0,86 0,95 0,98 0,97 Pooled 89 0,72 0,82 0,88 0,91 0,96 foreign 2002 2 0,56 0,62 0,91 0,96 0,95 2003 3 0,35 0,38 0,87 1,00 0,88 2004 3 0,48 0,51 0,92 0,95 0,97 2005 4 0,60 0,64 0,93 0,95 0,98 2006 6 0,74 0,77 0,96 0,99 0,97 2007 10 0,79 0,81 0,98 0,99 0,99 Pooled 28 0,66 0,69 0,95 0,98 0,97
Figure 4.1: Interest Rate and Consumer Price Index for 2002 to 20074
The pooled means for cost, allocative, technical, pure technical and scale efficiency scores are %70, %78, %89, %93 and %96 respectively. We may conclude that the major source of cost inefficiency is allocative inefficiency. Isik and Hassan (2003) suggests that allocative inefficiency is driven by market distortions from factors such as excessive regulation which is the case for Turkish banking sector after the two financial crises in 2000 and 2001. Some efforts taken by the regulatory bodies are; auditing the assets of the banks, strengthening the financial structure and shareholder’s equity and taking corrective measures to increase the efficiency (Ayan and Percin 2006).
Variations of efficiencies across banks may be associated with factors that affect competition or create different environments under which banks operate; therefore, in the second iteration, we examine what factors relate to the degree of bank efficiency in Turkey. The estimates of various efficiency measures (CE, AE, TEC, PTEC and SE) serve as dependent variables in our model.
To explain efficiency variations across banking firms, we group independent variables into three main categories:
4 www.tuik.gov.tr 58% 46% 25% 15% 15% 17% 29,7% 18,4% 9,3% 10,5% 9,7% 8,4% 0% 10% 20% 30% 40% 50% 60% 70% 2002 2003 2004 2005 2006 2007 Nominal Profit of Deposit İnterest CPI
A. Time effect (Stability) B. Ownership structure C. Other bank traits.
Other bank factors may play an important role in defining bank efficiency and may not remain constant. Therefore, in the fifth group we consider the following bank traits:
‐ Nonperforming loans / Total credits; ‐ Non-deposit funds / Total assets; ‐ Off balance sheet items / Total assets; ‐ Capital adequacy ratio;
‐ Other operating expenses / Total operating income.
Following Mester (1996), Isik and Hassan (2003) and Isik and Kjy (2008) we run generalized least squares (GLS) regressions. Table 4.3 presents the regression results according to our models.
A. Time effect (Stability):
Isik and Hassan (2003) suggest that the efficiency results may be affected by the stability of the regulatory environment and the marketplace. The regulations and the marketplace may have changed the underlying production technology and the associated cost or production functions, therefore static analysis may fail to capture these changes. We define dummy variables for each year (excluding 2002 as the base) in order to analyze the effect of environmental changes over time.
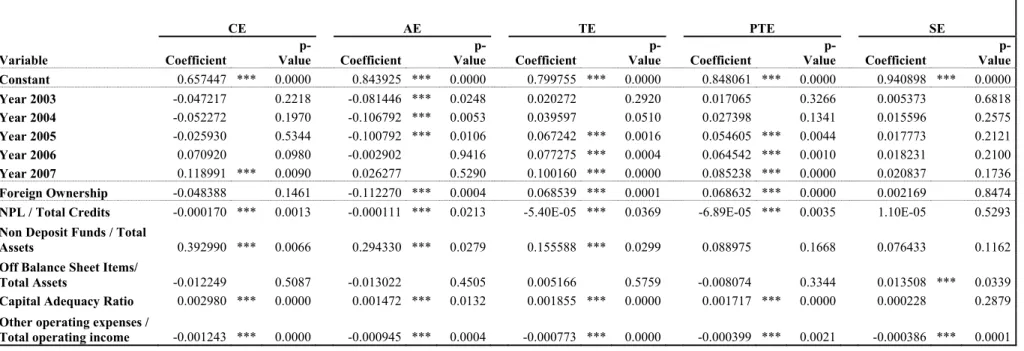
Table 4.3: Regression Analysis of Potential Correlates of Efficiency Estimates
CE AE TE PTE SE
Variable Coefficient Valuep- Coefficient Valuep- Coefficient Valuep- Coefficient Valuep- Coefficient Value
p-Constant 0.657447 *** 0.0000 0.843925 *** 0.0000 0.799755 *** 0.0000 0.848061 *** 0.0000 0.940898 *** 0.0000 Year 2003 -0.047217 0.2218 -0.081446 *** 0.0248 0.020272 0.2920 0.017065 0.3266 0.005373 0.6818 Year 2004 -0.052272 0.1970 -0.106792 *** 0.0053 0.039597 0.0510 0.027398 0.1341 0.015596 0.2575 Year 2005 -0.025930 0.5344 -0.100792 *** 0.0106 0.067242 *** 0.0016 0.054605 *** 0.0044 0.017773 0.2121 Year 2006 0.070920 0.0980 -0.002902 0.9416 0.077275 *** 0.0004 0.064542 *** 0.0010 0.018231 0.2100 Year 2007 0.118991 *** 0.0090 0.026277 0.5290 0.100160 *** 0.0000 0.085238 *** 0.0000 0.020837 0.1736 Foreign Ownership -0.048388 0.1461 -0.112270 *** 0.0004 0.068539 *** 0.0001 0.068632 *** 0.0000 0.002169 0.8474
NPL / Total Credits -0.000170 *** 0.0013 -0.000111 *** 0.0213 -5.40E-05 *** 0.0369 -6.89E-05 *** 0.0035 1.10E-05 0.5293
Non Deposit Funds / Total
Assets 0.392990 *** 0.0066 0.294330 *** 0.0279 0.155588 *** 0.0299 0.088975 0.1668 0.076433 0.1162
Off Balance Sheet Items/
Total Assets -0.012249 0.5087 -0.013022 0.4505 0.005166 0.5759 -0.008074 0.3344 0.013508 *** 0.0339
Capital Adequacy Ratio 0.002980 *** 0.0000 0.001472 *** 0.0132 0.001855 *** 0.0000 0.001717 *** 0.0000 0.000228 0.2879
Other operating expenses /
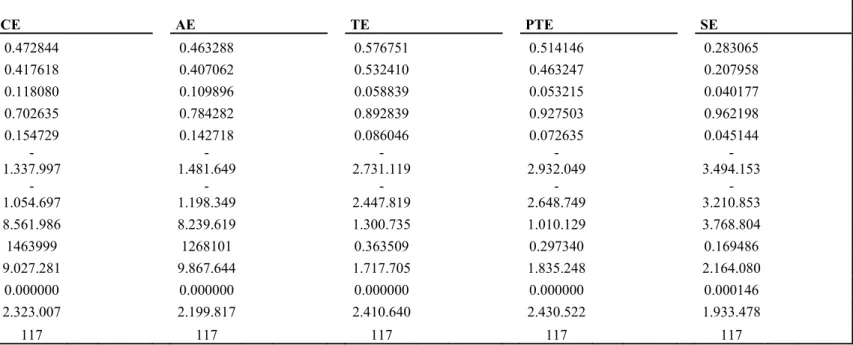
Table 4.3: Regression Analysis of Potential Correlates of Efficiency Estimates (Continued) CE AE TE PTE SE R-squared 0.472844 0.463288 0.576751 0.514146 0.283065 Adjusted R-squared 0.417618 0.407062 0.532410 0.463247 0.207958 S.E. of regression 0.118080 0.109896 0.058839 0.053215 0.040177
Mean dependent var 0.702635 0.784282 0.892839 0.927503 0.962198
S.D. dependent var 0.154729 0.142718 0.086046 0.072635 0.045144
Akaike info criterion
-1.337.997 -1.481.649 -2.731.119 -2.932.049 -3.494.153 Schwarz criterion -1.054.697 -1.198.349 -2.447.819 -2.648.749 -3.210.853 F-statistic 8.561.986 8.239.619 1.300.735 1.010.129 3.768.804
Sum squared resid 1463999 1268101 0.363509 0.297340 0.169486
Log likelihood 9.027.281 9.867.644 1.717.705 1.835.248 2.164.080
Prob(F-statistic) 0.000000 0.000000 0.000000 0.000000 0.000146
Durbin-Watson stat 2.323.007 2.199.817 2.410.640 2.430.522 1.933.478
When we look at the raw efficiency scores, there is an upward trend over time. However, our model does not suggest that these trends are statistically significant for all efficiency estimates (except for technical and pure technical efficiency). Our results indicate that Turkish banks tend to improve their technical and pure technical (managerial efficiency) efficiency especially after 2005. CE and AE results are mixed and could not command on the results.
Our results contradict with the previous study of Isik and Hassan (2003) which says that the efficiency of Turkish banking system decreased after 1990 to 1996 as a result of high cost of funding and resurrection of over-staffing and branching issues. As we have previously depicted, the banking environment has been drastically changed after 2000 and 2001 crises. The cost of funding and other issues before 2000 had been solved and the developments like foreign entry and regulations forced the banks to increase their efficiency scores in all aspects. Basically, the year variable represents the non-crisis years, during which the economy grew.
B. Ownership structure:
One may argue that foreign banks have comparative advantages in terms of better technology, low cost of funding, longer experience in banking industry, better and well-developed organizational structure. Besides, governments that need foreign direct investments support and encourage foreign banks in order to attract them. However, there are some disadvantages of foreign banks, such as lack of experience in the new cultural, legal and financial environment and managerial deficiency in communicating with the global head office and the local offices.
Previous studies in US find out that domestic banks are more efficient than foreign banks (Chang, Hassan and Hunter, 1998; DeYoung and Nolle, 1996). However, foreign Australian banks are found to be more efficient than domestic banks but not successful in converting their superior efficiency into greater profits (Sturm and Williams, 2004). Green, Murinde and Nikolov (2004) observe that foreign banks are not more efficient than the average bank in nine countries in Central and Eastern Europe for the period 1995 to 1999. For the case of Turkey,
Isik and Hassan (2003) suggest that foreign private banks are significantly more efficient than private domestic banks.
In terms of ownership, Turkish banks are divided into two main categories: private and foreign ownership. As it has been stated in previous sections we have not included public banks to our model. Since, starting from 2002, there is a significant upward trend for foreign ownership in Turkish banking sector we account for changes in the ownership variable from year to year. Private ownership variables are used as the base dummy variables.
No significant differences in cost and scale efficiency are found between private ownership and foreign ownership after controlling for other factors. However, when it comes to technical efficiency and pure technical efficiency, our results suggest that foreign banks are more X-efficient than domestic banks.
When we look at the mean efficiency scores (CE, AE, TE, PTE and SE) the pooled values are 0,72, 0,82, 0,88, 0,91 and 0,96 for private and 0,66 0,67, 0,95 ,0,98 and 0,97 for foreign banks. The mean efficiency scores are also consistent with our empirical finding. It is found that the main source of cost inefficiency in foreign banks is that they pay more to their employees. The average labour price of the foreign banks throughout our analysis period is 58% higher than the private banks.5 Since technical efficiency refers to optimal input usage per unit of output, we may conclude that foreign banks are trying to employ the most effective and productive resources but this has a consequence in the salaries.
C. Other bank traits:
In this section, we will investigate the effects of other bank traits on efficiency in Turkish banking sector.
‐ The proportion of nonperforming loans is well accepted as a sign of inefficiency. Not only the banks facing financial distress and approaching to failure have been found to carry a large proportion of nonperforming loans, but also problem loans are negatively
related to efficiency even in non-failing banks (Whalen, 1991; Kwan and Eisenbeis, 1995). The proportion of nonperforming loans in total loans may be a sign of poor management. They cannot control or monitor their loan portfolio adequately thus increase the cost of operational expenses like additional management effort, collection efforts like arrangements with law firms or establishing their own collection force. Our models suggest that there is a negative and statistically significant relation between nonperforming loans and CE, AE, TE and PTE.
‐ Our results indicate that banks, which utilize more purchased funds and less core deposits are more cost, allocative and technical efficient. This is not a surprising finding because collection of core deposits needs a large branch network, large workforce and pricing strategy which brings a higher capital investment and overhead cost. One other aspect is the mismatch of maturities of loans and deposits. The average maturity is less than 1 year in Turkey and it is hard and costly to fund the loans (like investment loans, mortgages) with deposits.
‐ Besides the traditional interest earning on balance sheet activities, it is also important to account for the off balance sheet activities like guarantees, warranties, commitments, and foreign exchange and interest rate transactions. We use the ratio of off balance sheet items to the total assets and tried to investigate whether there is a statistically significant relation between this ratio and the efficiency estimates. However, there is no evidence that this ratio has an effect on efficiency except allocative efficiency.
‐ The last but not least, we try to find a relation between efficiency and other important performance measures of the banks like capital adequacy ratio and ratio of other operating expenses to total operating income. Capital adequacy ratio reflects the stability of the banks. Our results suggest that capital adequacy ratio is positively and statistically significantly (except allocative efficiency) related with efficiency estimates. The lower the ratio of other operating expenses to total operating income the more efficient the bank. We may say that banks whose operating income grow faster
than the other operating expenses will also increase all efficiency scores all of which are negatively related and statistically significant with this ratio.
CONCLUSION
This study focuses on Turkish commercial banking sector performance between 2002 and 2007, a period when the macroeconomic environment changed and the sector experienced a significant re-structuring process after two financial crises in 2000 and 2001. A non-parametric approach, Data Envelopment Analysis, is applied to analyze the X-efficiency performance of Turkish banks’ to see how far the country has progressed in terms of reforms, competition and efficiency. First, the cost (CE), allocative (AE), technical (TE), pure technical (PTE) and scale efficiency (SE) efficiency scores are estimated according to the widely used intermediation approach by choosing the loans and other earning assets as outputs and labour, capital and loanable funds a inputs. Secondly, using the estimated efficiency scores, the correlation X-efficiency with a number of independent factors which are; stability, ownership, and other important bank traits are investigated with the help of a regression model. The outcomes of this analysis may help bank managers, policy makers and potential new entrants to the market to have certain insights.
To avoid the comparison problems among different types of banks that have different objectives, technologies and strategies only commercial banks are investigated. In addition to that, banks which are being controlled by Saving Deposit Insurance Fund are excluded, since the balance sheets and income statements of these banks may not be realistic. Although the scope had been narrowed, this study is able to account for an average of 63% of the total assets, 61% of the total deposits and 72% of the total credits in the total magnitudes of Turkish banking sector.
The raw efficiency scores suggest that major source of cost inefficiency is allocative inefficiency which is driven by excessive regulation after the two financial crises in 2000 and 2001. The results indicate that Turkish commercial banks tend to improve their technical efficiency especially after 2005. The managerial efficiency (PTE) results are also positively related but only the last three years of the analysis period are significant. In terms of ownership, no significant differences among cost efficiency and scale efficiency is found between private ownership and foreign ownership. On the other hand, it is found that for technical efficiency and pure technical efficiency, foreign banks are more X-efficient than
their private peers. Besides ownership, market share and branch network, other bank characteristics may play an important role in defining bank efficiency. Loan quality is an important trait for the banks. The model suggests that there is a negative and statistically significant relation between the proportions of nonperforming loans in total loan portfolio except for scale efficiency. The results also indicate that banks, which utilize more purchased funds and less core deposits are more cost, allocative and technical efficient. The model cannot find a statistically significant relation between the ratio of off-balance sheet items to the total assets except allocative efficiency. Capital adequacy ratio reflects the stability of the banks and it is found that capital adequacy ratio is statistically significant and positively related with cost, allocative, technical and pure technical efficiency estimates. As the last trait, the ratio of other operating expenses to total operating income is found to be statistically significant and negatively related to all efficiency estimates.
This empirical study can be improved by several ways. First, the selection of inputs and outputs are not exact. Including other factors and bank characteristics may result to give different insight to analysts. More importantly, the economic environment in this analysis period is somehow stable. However, the global financial crises started to show its effects in the middle of 2007. Since then, stock markets have fallen, people started to lose confidence in financial markets, unsuspected large financial institutions have collapsed or been bought out. In the light of the foregoing, all the governments in the world took preventive measures to recover and/or to strengthen their financial markets. Thus, expanding the analysis period which will include the 2008 and 2009 figures may be useful not only for country wise analysis but also for comparative cross country analysis to elaborate on the effects of the crisis to efficiency.
REFERENCES
Altunbas, Y., E.P.M. Gardener, P. Molyneux, B. Moore (2001). Efficiency in European banking. European Economic Review, 45, 1931-1955.
Ayan, T. Y. and Percin, S. (2006). Measuring efficiency of commercial banks in a developing economy: The case of Turkey. Investment Management and Financial Innovations, 3, 217-231.
Banker R.D., A. Charnes, W.W. Cooper (1984). Some models for estimating technical and scale inefficiencies in DEA. Management Science, 32 (12), 1613-1627.
Berg, S.A., Forsund, F.R., Hjalmarsson, L., Suominen, M. (1993). Banking efficiency in the Nordic countries. Journal of Banking and Finance, 17 (2-3), 371-388.
Berger, Allen N. (1995). The profit-structure relationship in banking: Tests of market power and efficient-structure hypotheses. Journal of Money, Credit and Banking, 27, 404-431.
Berger, Allen N. and David B. Humphrey (1994). Bank scale economies, mergers, concentration and efficiency: The U.S. experience. The Wharton Financial Institutions Center.
Berger, Allen N. and David B. Humphrey (1997). Efficiency of financial institutions: International survey and directions for future research. European Journal of Operational Research, 98, 175-212.
Chang, C. E., Hassan, I. and Hunter, W. C. (1998). Efficiency of multinational banks: An empirical investigation. Applied Financial Economics, 8, 1-8.
Charnes, A., W.W. Cooper and E. Rhodes (1978). Measuring the efficiency of Decision Making Units. European Journal of Operations Research, Vol.2, 429-444.
DeYoung, R., and Hasan, I. (1998). The performance of de novo commercial banks: A profit efficiency approach. Journal of Banking and Finance, 22, 565-587.
DeYoung, R. and Nolle, D. (1996). Foreign-owned banks in the U.S.: Earning, market share or buying it? Journal of Money, Credit and Banking, 28, 622-636.
Green, C. J., Murinde, V. and Nikolov, I. (2004). The efficiency of foreign and domestic banks in central and eastern Europe: Evidence on economies of scale and scope. Journal of Emerging Market Finance, 3, 175-205.
Isik, I. and Hassan, M. K. (2002). Technical, scale and allocative efficiencies of Turkish banking industry. Journal of Banking and Finance, 26, 719-766.
Isik, I. and Hassan, M. K. (2003). Efficiency, ownership and market structure, corporate control and governance in the Turkish banking industry. Journal of Business, Finance and Accounting, 30, 1363-1421.
Isik, I. and Kyj, L. (2008). Bank x-efficiency in Ukraine: An analysis of service characteristics and ownership. Journal of Economics and Business, 60, 369-393.
Kwan, S. H. and Eisenbeis, R. A. (1995). An analysis of inefficiencies in banking: A stochastic cost frontier approach. Proceedings. Federal Reserve Bank of Chicago, Issue May, 369-385
Mester, L. J. (1996). A study of bank efficiency taking into account risk preferences. Journal of Banking and Finance, 20, 1025-1045.
Şakar, B. (2006). A study on efficiency and productivity of Turkish banks in İstanbul Stock Exchange using Malmquist DEA. Journal of American Academy of Business, 8, 145-155.
Sturm, J. E., and Williams, B. (2004). Foreign bank entry, deregulation and bank efficiency: Lessons from the Australian experience. Journal of Banking and Finance, 28, 1775-1779.
Whalen, G. (1991). A proportional hazards model of bank failure: An examination of its usefulness as an early warning tool. Economic Review, Federal Reserve Bank of Cleveland, Q1, 21-31.
Yıldırım, C. (2002). Evolution of banking efficiency within an unstable macroeconomic environment: the case of Turkish commercial banking. Applied Economics, 34, Number 18, 2289-2301
Zaim, O. (1995). The effect of financial liberalization on the efficiency of Turkish commercial banks. Applied Financial Economics, 5, 257-264.