T.C.
ISTANBUL AYDIN UNIVERSITY
INSTITUTE OF SCIENCE AND TECHNOLOGY
WAVELET BASED IMAGE FUSION IN BIOMEDICAL
THESIS
Molham MOSHANTAT
Department of Electrical & Electronic Engineering Electrical and Electronics Engineering Program
T.C.
ISTANBUL AYDIN UNIVERSITY
INSTITUTE OF SCIENCE AND TECHNOLOGY
WAVELET BASED IMAGE FUSION IN BIOMEDICAL
THESIS
Molham MOSHANTAT (Y1513.300007)
Advisor: Assoc. Prof. Dr. Saeid KARAMZADEH
Department of Electrical & Electronic Engineering Electrical and Electronics Engineering Program
I extend my deepest gratitude to family, whose has been a constant
DECLARATION
I hereby declare that all information in this thesis document has been obtained and presented in accordance with academic rules and ethical conduct. I also declare that, as required by these rules and conduct, I have fully cited and referenced all material and results, which are not original to this thesis.
FOREWORD
I would first like to thank my thesis advisor Assoc.Prof. Dr. Saeid KARAMZADEH of the Electric and Electronic Engineering at Istanbul Aydin University. The door to Prof. KARAMZADEH office was always open whenever I ran into a trouble spot or had a question. He consistently allowed this paper to be my own work but steered me in the right the direction whenever he thought I needed it. I would like also to thank Istanbul Aydin University and its library for providing me with an access to all the books and articles that I needed to finish this work.
TABLE OF CONTENT
Pages
TABLE OF CONTENT ... xi
ABBREVIATIONS ... xiii
LIST OF TABLES ... xv
LIST OF FIGURES ... xvii
ÖZET ... xix
ABSTRACT ... xxi
1. INTRODUCTION ... 1
1.1 Computed Tomography ... 1
1.2 Magnetic Resonance Imaging ... 4
1.3 Development of magnetic resonance imaging ... 5
1.4 Magnetic resonance imaging components ... 5
1.5 The Outline of Thesis ... 7
2. WAVELET TRANSFORM... 9
2.1 Introduction ... 9
2.2 Wavelet Analysis ... 10
2.2.1 Haar wavelet ... 10
2.2.2 Daubechies wavelets ... 11
2.2.3 Mexican hat wavelet ... 12
2.2.4 Biorthogonal wavelets ... 13
2.2.5 Symlets wavelets: ... 14
2.2.6 Morlet wavelet ... 14
2.2.7 Shannon wavelet: ... 15
2.3 Wavelet Transform in Image Fusion Techniques ... 15
2.3.1 Continuous wavelet transform ... 15
2.3.2 Discrete wavelet transform ... 17
2.3.3 2-D Discrete wavelet transform ... 21
2.4 Wavelet Reconstruction ... 23
2.5 Applications of Wavelet Transform ... 23
3. IMAGE FUSION ... 25
3.1 Introduction ... 25
3.2 The Evolution of Image Fusion Research ... 26
3.2.1 Addition ... 26
3.2.2 Average ... 27
3.2.3 Subtraction ... 27
3.2.4 Multiplication ... 27
3.3 Types of Image Fusion ... 28
3.4 Image Fusion Techniques and Methods ... 29
3.4.1 Introduction ... 29
3.4.5 Principal component analysis ... 30
3.4.6 Intensity-hue-saturation (ihs) ... 31
3.4.7 Multi resolution analysis based method ... 32
3.4.8 Pyramid transformation ... 33
3.5 Application and Uses of Image Fusion ... 34
3.6 Advantages and Disadvantages of Image Fusion ... 34
4. DIGITAL REGISTRATION THEORY ... 37
4.1 Introduction ... 37
4.2 Image Registration Classification ... 38
4.2.1 Intensity-based and feature-based models ... 38
4.2.2 Transformation models ... 38
4.2.3 Spatial frequency domain models ... 39
4.2.4 Mono-multi-modality models ... 41
4.2.5 Manual, semi-automatic, and automatic models ... 41
4.2.6 Similarity models ... 41
4.2.7 Uncertainty models ... 42
4.2.8 Optimization models ... 42
4.2.9 Parametric and non-parametric models ... 43
4.2.10 Rigid and non-rigid models ... 44
5. THE PROPOSED WORK... 47
5.1 Digital Imaging and Communication in Medicine ... 47
5.2 Medical Image Fusion Based on Wavelet Transform ... 48
5.3 Algorithm ... 51
5.4 Result and Discussion Performance Analysis ... 52
5.4.1 Entropy ... 53
5.4.2 Standard deviation (sd) ... 54
5.4.3 Peak signal to noise ratio (psnr) ... 55
5.4.4 Signal-to-noise ratio (snr)... 56
5.4.5 Conclusions and future work... 60
REFERENCES ... 61
ABBREVIATIONS
ANN : Artificial Neural Networks Bior : Biorthogonal wavelets
BT : Brovey Transform
CAD : Computer Aided Diagnosis
CT : Computed Tomography
CWT : Continuous Wavelet Transform DSA : Digital subtraction angiography DWT : Discrete Wavelet Transform
DICOM : Digital Imaging and Communication in Medicine Db : Daubechies Wavelets
HPF : High Pass Filtering HIS : Intensity-Hue-Saturation
IDWT : Inverse Discrete Wavelet Transform MRA : Multi resolution Analysis Based Method MRI : Magnetic Resonance Imaging
NEMA : National Electrical Manufacturers Association NMR : Nuclear Magnetic Resonance
NSCT : Non-Sub-Par Contourlet change PCA : Principle Component Analysis PCNN : Pulse Coupled Neural Network PET : Positron Emission Tomography PSNR : Peak Signal to Noise Ratio SD : Standard Deviation
SYM : Symlets Wavelets
LIST OF TABLES
Pages
Table 5.1: The Entropy Result For Merged Image ... 54
Table 5.2: The Standard Deviation Result For Merged Image ... 55
Table 5.3: The Peak Signal to Noise Ratio Result For Merged Image ... 55
Table 5.4: The Signal-to-noise ratio Result For Merged Image ... 56
LIST OF FIGURES
Pages
Figure 1.1: Axial Image of Brain. ... 2
Figure 1.2 : External Structure of The ct ... 3
Figure 1.3: Person Was Exposed To Some X-ray Beam in the Form of a Fan And The Projected Image Can also be Shot to the Semi-Circular Digital X Ray sensor ... 4
Figure 1.4: Illustration of The Main Devices. ... 6
Figure 1.5: The Mr Imaging Process. ... 7
Figure 2.1: Haar Wavelet. ... 10
Figure 2.2: The Daubechies Family Wavelets. ... 11
Figure 2.3: First row: Father Wavelets ∅𝒓𝒙, Second row: Mother wavelets 𝝍𝒓(𝒙) 12 Figure 2.4: Mexican Hat Wavelet. ... 13
Figure 2.5: The Biorthogonal Family of Wavelets. ... 13
Figure 2.6: The Symlets Family of Wavelets ... 14
Figure 2.7: The Shannon Wavelet in Time and Frequency Domains. ... 15
Figure 2.8: Calculation of cwt. ... 16
Figure 2.9: Shifting Operation. ... 17
Figure 2.10: Scaling Operation. ... 17
Figure 2.11: One Dimensional Wavelet Analysis and Synthesis... 19
Figure 2.12A): Magnitude of dwt of black circle B): Magnitude of dwt of black circle on white back ground. ... 20
Figure 2.13: C): The Image Fusion Using the dwt and Two Registered multifocuse clock image. ... 21
Figure 2.14: B): Calculation of Approximate and Detailed Coefficients of 2d dwt. 22 Figure 3.1: Image Fusion Process. ... 26
Figure 3.2: Evolution of Image Fusion. ... 27
Figure 3.3: Block Scheme of The pca Fusion Method. ... 31
Figure 3.4 : Block Scheme of the ihs Fusion Method. ... 32
Figure 5.1: Nature of modalities, methods and organs used in medical image fusion ... 49
Figure 5. 2: Wavelet Transform on a Signal. ... 50
Figure 5.3: Block Diagram for Image Fusion ... 51
Figure 5.4:Image Fusion Using Discrete Wavelet Transform. ... 52
Figure 5.5: Mrı Image. ... 53
Figure 5.6: Ct Image. ... 53
Figure 5.7: The Result When we Apply Haar Wavelet ... 57
Figure 5.8 : The Result When we Apply Discrete Aproximation of meyer wavelet 58 Figure 5.9: The Result When we Apply Daubechies Wavelets ... 58
Figure 5.10: The Result When we Apply Dymlets Wavelets ... 59
BIYOMEDIKALDE DALGACIK ESASLI GÖRÜNTÜ FÜZYONU
ÖZET
Bu günlerde, tıbbı görüntülemeyi hastanelerde kullanmamız çok önemli. Tıbbı görüntüleme bize insan vücudu hakkında detaylı ve önemli veri ibraz etmekte. Manyetik rezonans görüntüleme bize doku verileri ibraz eder. Pozitron yayınlayıcı tomografi ve tek foton tomografi bize tüm vücudun işlevselliğini ibraz etmektedir. Fakat hastalık tanı ve tedavi planlaması için bu görüntülemeleri bize çok net verileri veremez. Bu nedenle, etkili hastalık analizi için bu farklı modeliste tamamlayıcı veriler gereklidir. Bu veri multimodality medikal görüntü füzyon algoritmaları ile geçirmekte. Bu noktada, kapsamlı araştırmalarında tıbbi görüntüler için birçok füzyon algoritması üzerinde çalışmaktadır. Tıbbi görüntü füzyonu ise, en az iki tıbbi görüntüyü bir görüntüde birleştiren yöntemdir, kaydedilen tıbbi görüntülerin her ikisinin de verilerini içermekte. Bu teknik temel olarak taşhıstan parçası olarak kullanılır. Görüntü füzyonunun ana amacı, iki görüntünün verilerini veya tek bir görüntünün her birinden istenen özellikleri birleştirmektir.
Bu tezde wavelet’I (kesikli dalgacık dönüşümü) kullanarak iki tıbbı görüntülemeleri birleştirmek için bir program tasarladık. Sonra bu görüntüdeki tüm dalgacık türlerine uygulandığında en iyi sonucu tartıştık ve dalgacık kullanan tıbbi görüntü üzerinde görüntü füzyon tekniğini kullandık db,coif,sym,dmey,bior,rbio, ve haar. Bu füzyon algoritmaları farklı performans parametreleri kullanılarak analiz edilmektedir örnek olarak “Entropy, PSNR, SD, SNR” en iyi metodu seçebilmesi için.
Anahtar Kelimeler: Görüntü füzyonu, DWT, PSNR, IDWT, CT, MRI, Entropi, Füzyon kuralları.
WAVELET BASED IMAGE FUSION IN BIOMEDICAL
ABSTRACT
In these days, using medical image is very important in hospitals. These medical images give a lot of data about human body for example Computed Tomography (CT) identifies the bone structure, Magnetic Resonance Image (MRI) image gives that the so tissue data, Positron on Emission Tomography (PET) and Single photon release computed tomography (SPECT) give human body functionality data. but these images can't give clear data image for disease diagnosis and treatment planning. So, these different modality complementary data for effective disease analysis is required. This data is gone through the multimodality medical image fusion Algorithms. To this point, comprehensive research has been conducting on a lot of fusion algorithms for medical images. Whereas Medical image fusion is the method which merge at least two medical images into one image, which contains the data of both the recorded medical image. This technique is fundamentally utilized as a part of diagnosis. The main goal of Image fusion is to combine data from two images or more the required features from each of the single image. Typically, images like MRI and CT are utilized as source image. Discrete Wavelet Transform is utilized for the medicinal image combination execution.
In this thesis we designed a program to merge two medical image (MRI and CT) using wavelet transform (Discrete Wavelet Transform) and discussed the best result when applied to all types of wavelets on this image and we used image fusion technique are performed on medical image utilizing wavelets like db, coif, sym, dmey, bior, rbio and haar. These fusion Algorithms are analyzed using different performance parameters like Entropy, PSNR, SD, SNR to choose the better methods. Keywords: Image fusion, DWT, PSNR, IDWT, CT, MRI, Entropy, Fusion rules.
1. INTRODUCTION
These days, with the accelerate advancement in high-technology and contemporary instrumentation, medical imaging is now an essential part of a high number of applications, such as diagnosis, research, and treatment, for medical examination, just one sort of image might not be enough to supply accurate clinical prerequisite for your doctors. Consequently, the combination of this multi-modal medical images is required (Hari Om Shanker Mishra and Smriti Bhatnagar, (2014)). Medical imaging provides many modes of images information for the clinical examination including. Different medical images have different features, which may provide structural knowledge of distinct organs. By way of instance, CT (Computed tomography) and MRI (Magnetic resonance image) with high spatial resolution might offer anatomical construction info of organs. Thus, Large collection of imaging to get the exact same organ, they're contradictory but interrelated and complementary. As a result, the right image fusion of distinct features becomes an urgent necessity for clinical examination (A. Soma Sekhar, Dr.M.N.Giri Prasad, (2011)). In this thesis, we will design a program to merge MRI and CT image using a discrete wavelet transform in each kind of wavelet than discuss which is the best wavelet give us the best result, and in this chapter, we are going to briefly explain about computed tomography (CT) and magnetic resonance imaging (MRI).
1.1 Computed Tomography
One of the tomographic modalities, CT is most frequently than the MRI because every modality yield images of the body in broadly similar levels of detail using diverse shades of grey, and both supply images from any place within the body. On the other hand, the fundamentals of how images are formed and also the look of particular cells in each modality are extremely different. Much like MRI and the rest of the imaging procedures, CT creates the image by sending energy (x-ray) to your system and measuring the way that energy is consumed or
altered if passing through the human body's cells. Detectors quantify how much energy moves through the body around the other hand
which then informs how far the beam was attenuated, which is, how much energy has been consumed by the cells. The x-ray ray is put at many distinct angles, and the subsequent dimensions are processed by a computer to generate a cross-sectional image. Both the displayed brightness of this tissue at each stage along with the comparison between different cells from the image reveals just how much x energy is consumed. By way of instance, bone is among the denser cells within the body, therefore it consumes more x-rays and consequently appears glowing on a CT image. Blood, cerebrospinal fluid (CSF), plus a few soft cells are of lesser density so consume less of this x-ray, causing a darker, for example, the axial image of the brain that shown in Figure 1.1 (Url-1).
Figure 1.1: Axial image of brain. Source: Url-2
The three-dimensional images taken to the internal body structures using CT are based on X-ray imaging and are performed using a computer, and that images of x ray are obtained by exposing the patient to some fan-shaped x-ray column and then discovering the projected image onto a thin semicircular, digital x-ray sensor. Each picture is an x ray projection of a somewhat thin transverse portion
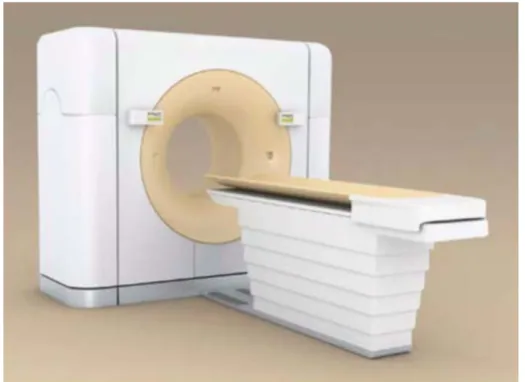
of the human body. To collect the large number of x ray projections necessary to generate a tomographic CT picture, both the x ray source and detector are rotated around a patient within a reassuring gantry(A. Soma Sekhar, Dr.M.N.Giri Prasad, (2011), Figure 1.2 shown us the external structure of the CT.
Figure 1.2 : External structure of the CT. Source: Url-1
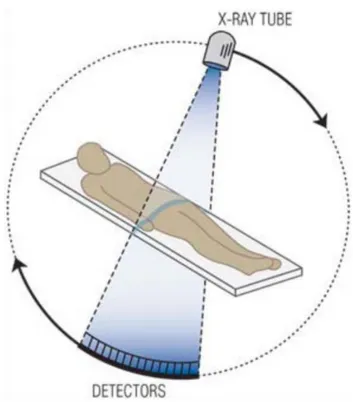
To enhance image-capture occasions and resolution, manufacturers use multi-slice CT imaging methods. Rather than a single 2 dimensions detector provide just a single image slice, multi-slice imaging employs 3 dimensions collection. The extra imaging measurement permits the system to create numerous pieces in parallel. About 1000 detectors are used in optical detector matrices in the extended measurement along the semicircular sensor arc; sixteen or even more detectors sit from the squab by measurement tangent into the arc, Figure 1.3 shown us that. The number of sensors from the short size determines the amount of available picture bits (Url-4).
Figure 1.3: person was exposed to some X-ray beam in the form of a fan and the projected image can also be shot to the semi-circular digital X Ray sensor Source: Url-1
CT imaging methods may create images in the entire body using a method known as spiral CT. At a spiral-CT system that the patient is gradually moved to the middle of this gantry whereas the x-ray source and detectors rotate around the patient (Url-1).
1.2 Magnetic Resonance Imaging
Magnetic resonance imaging (MRI) is a medical imaging technique Which capture magnetic fields as well as magnetic resonance imaging and the impact and unique images on which the pulse sequence capable of whole human body scans, but generally employed for a brain (Hongmei Zhu, (2011).). Magnetic resonance imaging (MRI) has become among the most effective and flexible diagnostic instruments available to clinicians and investigators now. There's been enormous growth in both clinical and technology use as MRI first became commercially available. The resolution, image quality, and period required for MRI examinations have enhanced considerably with the design of strong high-field magnet layouts, high-performance gradient systems, a broad selection of technical radiofrequency coils, and improvement of computer engineering.
These new capacities have yielded exquisitely detailed graphics in every area of the human body, bringing innovative technologies like functional brain imaging, whole-body diffusion imaging, fiber monitoring, and real-time neural imaging from the research laboratory and into clinical practice. Improvements in software and hardware technology also have allowed the development of consumer-friendly, advanced processing, and viewing tools to further improve the diagnostic skill of clinicians. Because of This, MRI has become routinely used to get an ever-expanding assortment of diagnostic assessments, providing better advice to clinicians, reducing danger to patients by eliminating the need for invasive and radiation processes and generating enhanced identification and therapy programs (Prince. Jerry, 2006).
1.3 Development of magnetic resonance imaging
MRI is determined by the physical principles of nuclear magnetic resonance (NMR). In 1945 in separate experiments, felix bloch in stanford university and edward purcell at harvard university found that delivering particular radio waves to substances exposed to a strong magnetic field led to the substance to absorb the power of the waves that could subsequently be discovered since the power radiated back. Further experiments discovered that the precise group of consumed frequencies supplied advice regarding the arrangement of the atomic nucleus and its chemical environment. By analyzing the spectrum of consumed frequencies, the arrangement of complex molecules can be set. This evaluation technique is called nuclear magnetic resonance (NMR) spectroscopy or magnetic resonance spectroscopy (MRS) and is still a principal means for identifying the structure of proteins and several different molecules. Back in 1952, Bloch and Purcell have been given the Nobel Prize in physics for their pioneering work in nuclear magnetic resonance experimentation (Prince. Jerry, 2006).
1.4 Magnetic resonance imaging components
MRI scanner is shown in figure 1.4 includes three major hardware elements: a major magnet, a magnetic field gradient system, and a radio-frequency (RF) system. The most important part is a permanent magnet. It creates a solid
uniform static area, known as the B0 area, for polarization of nuclear spins within an item. The magnetic field gradient system generally includes 3 Orthogonal gradient coils, Gx, Gy and also Gz, essential for signal localization. The gradient field advantage is usually significantly less than 1 G/cm.The RF system is made up of transmitter coil that's capable of creating a rotating magnetic field, known as the B1 area, for arousing a twist method, and a receiver coil which converts a processing magnetization to an electric signal. On human imaging methods, the potency of B1 is generally a tiny portion of a gauss (Url-4).
Figure 1.4: Illustration of the main devices. Source: Url-6
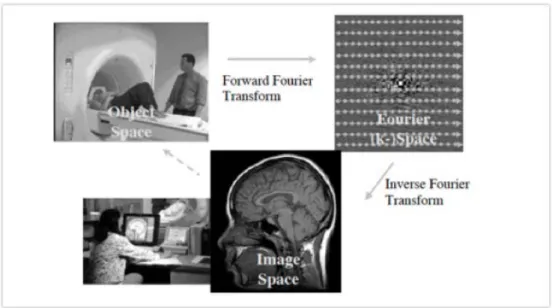
Though an MRI system is quite complicated, the inherent imaging fundamentals of such a system are somewhat simple, particularly in the signal processing perspective. The imaging procedure entails forward, and inverse Fourier transforms as shown in Figure 1.5 (Url-4
Figure 1.5: the MR imaging process. Source: Url-6
The imaging procedure doesn't entail the use of ionizing radiation and thus doesn't have the related potential damaging results.
There are two applications for MRI:
1. Diagnostic: Find unhealthy tissue in the body, locate tumors, bone injury, evaluate condition of anesthesia, tissue prep
2. Research: Neuroscience determine connections between pictures and ailments, Cancer, Understand the way the mind functions doing tasks (F. Sadjadi, 2005).
1.5 The Outline of Thesis
This thesis consists of 5 chapters, each chapter is fully overviewed and arranged as follow. The title of chapter 1 is the introduction in this chapter we briefly explained the CT and MRI imaging. The title of chapter 2 is wavelet transform in this chapter we discussed the wavelet and all type with all their figures and, we discussed the wavelet transforms and all of these transform types and some application of wavelet transform. The title of chapter 3 is image fusion in this chapter all the concepts of image fusion that how the image fusion research evolution, techniques which are very common in image fusion and what are the advantages and disadvantages of image fusion have been discussed and some
application and uses of image fusion . chapter 4 is about digital registration theory and image registration classification. in chapter 5 is the conclusion in this chapter we give a brief conclusion of work that we have done, and some propose work for researchers.
2. WAVELET TRANSFORM
2.1 Introduction
The ideal definition of wavelets in computational dictionaries that cut data into parts of frequencies differ from each other and examine each part of these data to later study each component in whether it matches the scale. They’ve rewards over conventional Fourier techniques in assessing physical conditions in the sign comprises discontinuities and sharp endings. Wavelets had been made individually by disciplines of mathematics, quantum physics, electric engineering, and seismic geology. Interchanges amongst these regions through the last ten decades have contributed to Plenty of fresh wavelet apps like film compression, turbulence, individual vision, radar, along with earthquake prediction (Url-5). In traditional Fourier transform, we utilize sinusoids for foundation purposes. It may supply the frequency info. Temporal data are missing in this transformation procedure. In certain programs, we will need to be aware of the frequency and interim info in precisely the exact same moment. It may be demonstrated which can be obtained rectal and frequency info at this sort of change using wavelets. Additionally, pictures are essentially matrices. Because of this, image processing could be considered matrix processing. visual nature of the human being is more sensitive to the low frequency signals than the high marks. Therefore, we observe that the sensitivity in the brightness and the color of the small copies is shown. This indicates that when the pressure of the high frequency is compressed in the picture, we will get a picture without distortion, (Url-5), the wavelet transforms one of the best applications in image Processing to detrain the low and high frequency area. This chapter introduces wavelets and describes all wavelet kinds, then I explain all wavelet transform techniques, and finish with Wavelet Reconstruction and some interesting applications.
2.2 Wavelet Analysis
We can characterize wavelets as a pulse-like waveform and use an amplitude that starts at zero and then increases and then returns to zero. It likely to arbitrary and unsymmetrical and contains a mean value of zero (Url-5). A wavelet is a function with zero average:
∫ 𝜑(𝑡𝑡)𝑑𝑡𝑡 = 0−∞+∞ (2.1)
Where is the wavelet function ψ(t) (i.e. the mother wavelet) and scaling function φ(t) (also called father wavelet) in the time domain. The wavelet function is essentially a band pass filter and then scaling it to every level plier its own bandwidth, these days, many sorts of wavelets are cited. Each with various personalities and can be used in various programs, we'll clarify it in this section.
2.2.1 Haar wavelet
Haar wavelet is sequential “square-shaped" functions. It's detached, also it like a measure function, figure 2.1 shown haar wavelet (F. Sadjadi,(2005)).
Figure 2.1: Haar wavelet. Source: Hongmei Zhu, (2011)
2.2.2 Daubechies wavelets
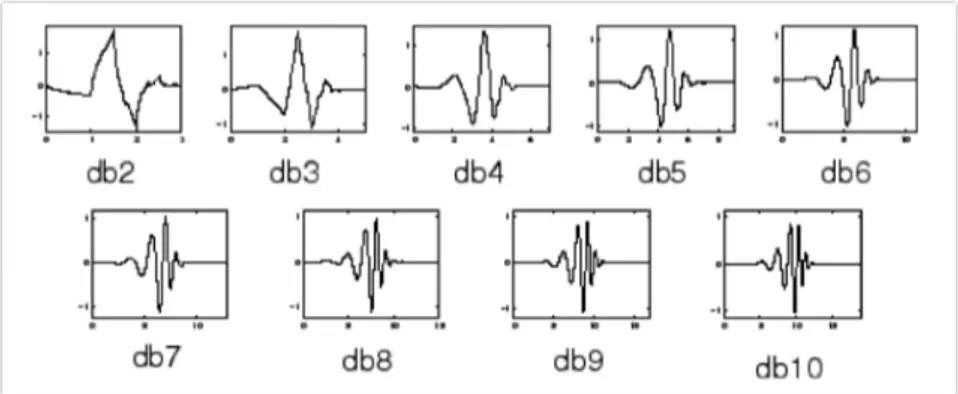
The Daubechies wavelets rely on Ingrid daubechies, which really are a maximum amount of “vanishing moments" for any given support. The titles of the daubechies family wavelets are composed dbN, where N is the arrangement and db that the “surname" of this wavelet figure 2.2 shown daubechies wavelet (Url-5).
Figure 2.2: The Daubechies family Wavelets. Source: Hongmei Zhu, (2011)
A good deal of different sorts of wavelets is made to boost the Haar wavelet transform. is defined as:
∅𝒓,𝒋,𝒌(𝒙) = 𝟐𝒋 𝟐⁄ ∅𝒓(𝟐𝒋𝒙 − 𝑲), 𝒋, 𝒌 ∈ ℤ. (𝟐. 𝟒)
where ∅𝒓(𝒙) in 𝑳𝟐(ℝ) own this characteristic {𝝓𝒓(𝒙 − 𝒌), 𝒋, 𝒌 ∈ ℤ} is an orthonormal sequence in 𝑳𝟐(ℝ) Here, j is the scaling index, k is the shifting index a function 𝒇 ∈ 𝑳𝟐(ℝ) is defined as
𝒇𝒋(𝒙) = � < 𝒇, ∅𝒓,𝒋,𝒌 𝒌
> ∅𝒓,𝒋,𝒌(𝒙). (𝟐. 𝟓)
The fluctuations are defined by:
𝒅𝒋(𝒙) = 𝒇𝒋+𝟏(𝒙) − 𝒇𝒋(𝒙) (𝟐. 𝟔)
In order to obtain an analysis of these details on a specific scale we will define 𝝍𝒓(𝒙) With similar feature of ∅𝒓(𝒙) described above (Hongmei Zhu, (2011)).
Figure 2.3: First row: father wavelets ∅𝑟(𝑥), Second row: mother Wavelets 𝝍𝒓(𝒙) Source: Hongmei Zhu, (2011)
∅𝒓(𝒙) and 𝝍𝒓(𝒙) and known as father wavelet and mother wavelet, in figure 2.3,
many shapes of the mother wavelet are shown in the equation 2.4. These equations were extracted by working on the change in time and volume of the wavelet father.
𝝍𝒓 has the compact support interval [0, 2𝒓 + 1]
𝝍𝒓 has about 𝒓/5 continuous derivatives
� 𝝍𝒓(𝒙)𝒅(𝒙) = ⋯ = � 𝒙𝟐 +∞ −∞ +∞
−∞ 𝝍𝒓(𝒙)𝒅(𝒙) = 𝟎 (𝟐. 𝟕)
Daubechies ‘wavelets deliver effects in image processing on account of the aforementioned attributes. One of the functions of this wave could be compressed readily implemented by span filters. Additionally, service empowers spatial domain localization. Considering that the mother wavelets have been utilized to describe specific properties this signal should contain zero key, so the info is saved from these transactions are the father wavelet (Hongmei Zhu, (2011))..
2.2.3 Mexican hat wavelet
This type of wavelet does not contain scaling purpose and can be derives from a purpose that's commensurate to the 2nd derivative use of the Gaussian probability density function (Hongmei Zhu, (2011)). is defined as:
𝑔𝑔(𝑡𝑡) = 1 √2𝜋𝜎𝑒 −𝑡2 2𝜎2 Which is 𝜑(𝑡𝑡) = 1 √2𝜋𝜎3�𝑒 −𝑡2 2𝜎2�𝑡𝑡2 𝜎2− 1�� It is shown in Figure 2.4
Figure 2.4: Mexican Hat Wavelet. Source :S. Mallat (1999)
2.2.4 Biorthogonal wavelets
This wavelets dissident from linear phase, which is required to get image and signal reconstruction, shown in figure 2.5
2.2.5 Symlets wavelets:
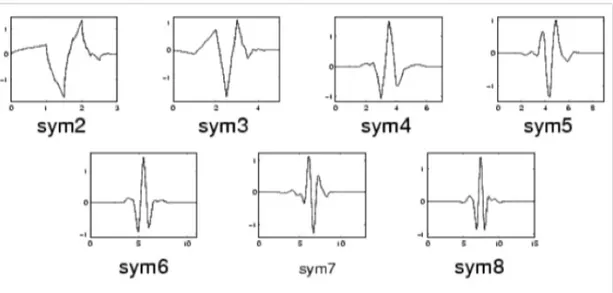
The symlets are nearly symmetric wavelets signaled by daubechies as alterations to the db family. The qualities of both wavelet families are similar (J. J. Ding and N. C. Shen, (2008)) , shown in figure 2.6
Figure 2.6: The symlets family of wavelets Source: J. J. Ding and N. C. Shen, (2008)
2.2.6 Morlet wavelet
Cwt often used morlet wavelet, it's defined as after in frequency and time domain:
𝝋(𝒕) = 𝝅−𝟏∕𝟒𝒆𝒊𝒎𝒕𝒆−𝒓𝟐∕𝟐 (2.8)
∅(𝒘) = 𝝅−𝟏 𝟒⁄ 𝓤(𝝎)𝒆−(𝝎−𝒎)𝟐∕𝟐
(2.9)
Where U measure function and is an adjustable parameter of wave number which enables a precise signal reconstruction.
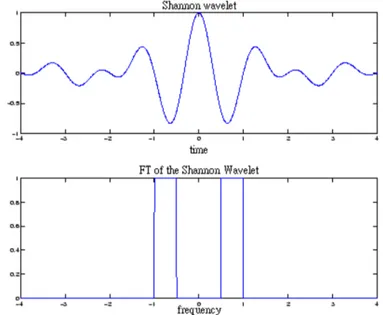
2.2.7 Shannon wavelet:
The Signal analysis by Perfect pass-band filers Specify a decomposition Called shannon wavelets (LigiaChiorean, Mircea-Florin Vaida, (2009)):
𝝋(𝒕) = 𝒔𝒊𝒏𝒄(𝒕 𝟐⁄ ) 𝐜𝐨𝐬(𝟑𝝅 𝟐⁄ ) (𝟐. 𝟏𝟎)
𝝋(𝒇) = � 𝟏 , 𝟎. 𝟓 ≤ |𝒇| ≤ 𝟏
𝟎, 𝒐𝒕𝒉𝒆𝒓𝒘𝒊𝒔𝒆 (𝟐. 𝟏𝟏)
The shannon wavelets in time and frequency domain are shown in figure 2.7.
Figure 2.7: The shannon wavelet in time and frequency domains. Source : Z. Zhang and R. S. Blum (1995)
2.3 Wavelet Transform in Image Fusion Techniques 2.3.1 Continuous wavelet transform
Continuous wavelet transform is defined as the sum of product of multiplying the reference time in a converted form (R. Johnson Suthakar, J.Monica Esther M.E, D.Annapoorani, F.Richard Singh Samuel (2005))
𝑊{𝑓(𝜇, 𝑠)} = �𝑓, 𝜑𝜇,𝑠� = ∫ 𝑓(𝑡𝑡)−∞+∞ √𝑠1 𝜑∗(𝑡−𝜇𝑠 )𝑑𝑡𝑡 (2.12)
Scale and frequency: The larger scales correspond with the numerous “extended" wavelets. The farther extended the wavelet, the greater the part of this signal by which it is being compared, and thus signal has been quantified by the wavelet coefficients. Thus, there is a correspondence between wavelet frequency and also frequency as exhibited by wavelet analysis:
Low scale s Compressed wavelet Rapidly changing details High frequency
High scale s Stretched wavelet Slowly changing, coarse features Low frequency
Steps for obtaining the continuous wavelet transform (CWT) of a function: Have a wavelet and compare it into some segment at the onset of the first sign. Compute a number, C, which reflects how closely connected the wavelet is on this particular section of this sign. The greater C is the greater the similarity. More importantly, in the event the sign power and the wavelet energy will be equal to one, C may be interpreted as a correlation coefficient. Be aware that the outcomes will be based on the form of the wavelet you decide on.
1. Shift the wavelet to the right and repeat steps 1 and 2 until you've covered the whole signal.
Figure 2.8: Calculation of CWT. Source: S. Mallat (1999)
Figure 2.9: Shifting Operation. Source: S. Mallat (1999)
2. Scale (stretch) the wavelet and repeat steps 1 through 3. 3. Figure 2.9: Scaling Operation
Figure 2. 10: Scaling Operation. Source: S. Mallat (1999)
4. Repeat steps 1 and 4 for all scales.
CWT can function at just about every scale, from this of their initial signal up to a scale. Even the CWT can also be continuous regarding changing: throughout computation, the assessing wavelet is changed smoothly across the complete realm name of this tested perform.
2.3.2 Discrete wavelet transform
The discrete wavelet transform DWT can be spatial frequency decomposition It can supply multi-phase analysis in 1 measurement the objective of the wavelet transform would be always reflect the exact signal for a superposition of both
wavelets. In case a different sign is represented by f(t) its own wavelet decomposition is subsequently:
𝑓(𝑡𝑡) = ∑𝑚,𝑛𝑐𝑚,𝑛 𝜓𝜓𝑚,𝑛(𝑡𝑡) (2.13)
Where 𝜓𝜓𝑚,𝑛(𝑡𝑡) is the translated version of the mother wavelet Wavelet supplied from the equation
𝜓𝜓𝑚,𝑛(𝑡𝑡) = 2−𝑚𝜓𝜓(2−𝑚 𝑡𝑡 − 𝑛𝑛) (2.14)
Where n and m are integers at each scale,𝑎𝑚,𝑛 and 𝑎𝑚−1,𝑛 describe the approximations of the function (f) at resolution 2𝑚−1 respectively, while the coefficients 𝑐𝑚,𝑛 describe the difference between one approximation and the other. In order to obtain the coefficients 𝑐𝑚,𝑛 and 𝑎𝑚,𝑛at the measurement function is defined in the equation 2.14 and this evidence can be used for each position and measurement. The convolution scaling function with all the hint will be executed at every scale Throughout the pragmatic Design of This signal using a low pass FIR ℎ𝑛 filter The approximation coefficients 𝑎𝑚,𝑛 at every scale is available with the following recursive relation
𝑎𝑚,𝑛 = ∑ ℎ𝑘 2𝑛−𝑘𝑎𝑚−1,𝑘 (2.15)
Where the best level 𝑎0,𝑛 is that the sampled signal. Additionally, by utilizing a connected to pass FIR filter 𝑔𝑔𝑛.
𝑐𝑚,𝑛 = � 𝑔𝑔2𝑛−𝑘𝑎𝑚−1,𝑘 𝑘
(𝟐. 𝟏𝟔)
Requires re-creation of the original signal that the study filters could also be selected from the biorthogonal set That Has the affiliated collection of filters. These synthesis filters ℎ� 𝑎𝑛𝑛𝑑 𝑔𝑔� could be utilized to absolutely rebuild the signal working with the reconstruction formulation
𝑎𝑚−1,𝚤(𝑓) = ∑ �ℎ𝑛 2𝑛−1 𝑎𝑚,𝑛(𝑓)�+ 𝑔𝑔2𝑛−1𝑐�𝑚,𝑛 (𝑓� (2.17)
down-plus another filtering. A single point wavelet synthesis and evaluation in 1 measurement is in figure 2.11 𝑎 Reconstructed Input signal f input signal c
Figure 2.11: one dimensional wavelet analysis and synthesis. Source: Dhirendra Mishra, (2016)
To expand the wavelet into just two dimensions. It's simply critical to scrub and down-sample from the flat and vertical instructions. It creates 4 sub-bands at every scale. Denoting the horizontal frequency and also the perpendicular frequency adjoining. From recursively employing the particular exact same approach in to the amount 2.12(a) At each and every scale which the sub groups are allergic to frequencies in the scale along using all the LH. HL and HH sub-rings are more vulnerable to horizontal, vertical and angled frequencies Figure 2.12(b) ℎ 𝑔𝑔 2 2 ℎ� 𝑔𝑔� 2 2 Approximation coefficients Detail coefficients
Figure 2. 12: A) magnitude of DWT of black circle B): Magnitude of DWT of black circle on white back ground.
Source: Dhirendra Mishra, (2016)
The fusion process of 2 pictures using the DWT is exhibited in figure 2.12: C. Both pictures can be used in a multi-focused groupie. two images of precisely the exact identical view every having an alternative camera attention. The figure explains the coefficients of every change have significantly distinct magnitudes inside the areas of differing attention. An easy “maximum Choice" strategy was utilized to create the combined coefficient map areas inside the image.
Figure 2.13: C): the image fusion using the DWT and Two Registered multifocuse clock image.
Source: Dhirendra Mishra, (2016)
2.3.3 2-D Discrete wavelet transform
The two-dimensional wavelet transform can be used to compute the wavelet transform of matrices. In addition, it can be used on images as an image is essentially a matrix of pixel values. The algorithm for calculating 2-D DWT is
like the one-dimensional case. This chart describes the simple decomposition measures for image Figure 2.13, Figure 2.14:
: convolve (rows or columns) with the filler X
: keep one row out of two
: keep one column out of two
Figure 2. 1 : A): Calculation of approximate and detailed coefficients of 2D DWT. Source: Yi Zhou, (2005)
Figure 2. 14: B): Calculation of approximate and detailed coefficients of 2D DWT. Source: Yi Zhou, (2005)
The decomposition of a matrix or image results in four elements: a single approximate element, (LL) and three particulars elements in 3 orientations (LH, HL, HH) (horizontal, vertical, and diagonal). so that one sign is broken down to several lower settlement parts (S. Mallat (1999)).
1 2 2 1 X I L H 2 1 2 1 H L H L 1 2 1 2 1 2 1 2 𝐼𝐼𝐿𝐿𝐿𝐿 𝐼𝐼𝐿𝐿𝐿𝐿 𝐼𝐼𝐿𝐿𝐿𝐿 𝐼𝐼𝐿𝐿𝐿𝐿
2.4 Wavelet Reconstruction
The process of getting the initial sign in the approximation and coefficients with no losing the data is known as wavelet reconstruction or inverse wavelet transform is shown in Figure 2.15. Where wavelet analysis entails filtering and down-sampling, the wavelet reconstruction procedure is composed of up filtering and sampling. Up-sampling is the procedure of directing a sign element by adding zeros between samples. (S. Mallat,1999).
Figure 2. 2: Inverse Wavelet Transform. Source :Mamta Sharma ,(2012)
2.5 Applications of Wavelet Transform
To conquer this settlement difficulty a wavelet transform can be used to rebuild the signal into a load of wavelets being added together. Wavelets are useful since they're restricted in frequency and time. Wavelets are a potent analytical app which could possibly be properly used to get a huge selection of software, specifically suggest processing, information compression, and design and picture denoising, fingerprint affirmation. Biology: for both cellular tissue recognition, to tell apart the ordinary from the bronchial membranes, for example as DNA analysis, protein analysis, blood pressure, heartrate and ECG analyses in meta outline, such as creating the job dimension and industrial oversight of gearwheel, address recognition, computer images, along with
fields of geophysical study. Orthonormal wavelets, by means of example, are employed into this test of atmospheric coating turbulence. Wavelets Also Have been utilized to examine Sea Floor bathymetry and also even the topography of the sea ground (LigiaChiorean,2009). Generally, there are two chief methods used in picture owning, the fourier transform and the wavelet transform. The manner by which the fourier transform gets from time to frequency is by devoting time signal to some formulation comprising plenty of sin () and cos () terms included together. From there a frequency chart can be assembled. The wavelet is a 'mini-wave' while sin () and cos () are boundless (they never go to zero and remain there, they continue forever). Throughout the fourier transform, the sign is, thus, being deconstructed into waves which are infinitely long. In case you've got a high resolution in the frequency domain (i.e. focusing on a single frequency, such as sin(3x) it is really hard to isolate it at time, as every frequency is present across all time. Being unsure of this time when focusing on the frequency will be your flip-side of becoming unsure of this frequency when working on time. Instead of a wavelet lasting forever and having no limit in time that’s why we used wavelet transform in this thesis, in next chapter we are going to explain what image fusion, image fusion techniques, and methods and the application and uses of image fusion.
3. IMAGE FUSION
3.1 Introduction
Image fusion is a procedure for combining two or more image to improve the data content, and the image fusion techniques are significant as it enhances the performance of object recognition methods by incorporating many resources of satellite, aerial and ground-based imaging systems along with other associated data collections. Further, in addition, it assists in sharpening the images, enhance geometric corrections, improve certain characteristics which aren't visible in both of the images, replace the faulty data, match the information collections for greater decision making. It unites the substantial data from at least two source images into one resultant image which explains the scene improved and keeps helpful information in the input images. Generally, two kinds of vision are categorized. A characteristic closely associated with image quality is attention. Sharp images provide better info than fuzzy image. Nonetheless, in some cases, it isn't feasible to obtain totally concentrated images in only a single camera photo, because some areas seem to be fuzzy because of variations in the thickness of the spectacle and also of the camera lenses focus. This suggests that if the digital camera is based at one thing, the other space of the landscape could possibly be outside of attention. An intriguing way is to shoot more pictures with the desired landscape at the specific very same location, however also with attention located in numerous parts of this spectacle. Afterward, implementing the picture mix thought, all furnish graphics are united, which makes one picture which comprises each one the best-concentrated locations. Picture blend keeps becoming unexpectedly famous in electronic picture processing. The absolute most essential aim of any picture blend algorithm is to coalesce each one the crucial visible data out of multiple enter graphics including the resulting picture comprises additional accurate and total data compared to respective origin graphics. The chapter is
2 types of image fusion, section 3 describes the image fusion techniques, section 4 application and uses of image fusion, section 5 advantages and disadvantages of image fusion.
3.2 The Evolution of Image Fusion Research
The good image fusion system has the following qualities. it may preserve the majority of the helpful information of distinct images, it doesn’t create artifacts that could distract or mislead an individual viewer or some other subsequent image processing steps, it has to be reliable and powerful. Eventually, it shouldn't discard any salient information included in any of the input images.
Figure 3.1: Image fusion process. Source: Mamta Sharma ,(2012)
The first growth of image fusion research is simple image fusion which executes the fundamental pixel by pixel associated operations such as addition, subtraction, average, and division. Normally fusion methods that rely on simple pixel operations on the input image values (Mamta Sharma ,(2012)). Now, these operations are clarified:
3.2.1 Addition
The addition is the easiest fusion operation. It operates by estimating the average intensity value of the input images on a pixel-by-pixel basis. The procedure assumes a semantic alignment and needs quite precise spatial and radiometric recovery. The method gets the advantage of curbing any noise that is existing from the input images (Mamta Sharma ,(2012).
3.2.2 Average
The pixel typical technique has the drawback that it will suppress outstanding image futures creating a very low contrast picture using a “washed-out" look. (Mamta Sharma ,(2012).
3.2.3 Subtraction
Subtraction is the match also and can be employed as an easy fusion operator in switch detection calculations.
3.2.4 Multiplication
Multiplication isn't widely utilized as image fusion operators. But, one major image fusion tool where multiplication is employed in Brovey pan sharpening.
Figure 3.2: evolution of image fusion.
Source: R.Johnson Suthakar, J.Monica Esther M.E, D.Annapoorani, F.Richard Singh Samuel (2005).
The next growth of image fusion study is reprinted decomposition-based picture blend. The crude combination schemes perform the combination directly on the origin images, which frequently have severe side effects like reducing comparison. With the debut of pyramid transform in mid80's, a few complex approaches started to emerge. More recently, along with the development of wavelet theory, Folks Began to Use wavelet decomposition to Choose the Region of Monster decomposition for image Combination figure 3.1 reveal the
Simple image fusion attempts
Pyramid decomposition-based image fusion
growth of image fusion. Truly wavelet transform could be accessed as just one particular kind of pyramid decompositions.
3.3 Types of Image Fusion
Single Sensor: The selection of graphics is fused with each other to develop a brand-new picture with best content. For example, in lighting variant and sound entire environment, a man operator like detector operator may possibly perhaps not need the capacity to discover items of their attention which can possibly be highlighted at the consequent revised picture. The shortcoming of the kind of systems lies below the constraints of the imaging detector which are used in other detection regions. Under the conditions where the machine can function, its dynamic Selection, resolution, etc., are restricted from the competency of this detector by way of instance, a visible-band detector like the digital camera is suitable for brightly lit surroundings like daylight scenes, however, isn't acceptable for badly illuminated situations discovered during night period, or below not fantastic circumstances like in rain or fog.
Multi-Sensor: Exceeds the picture of one sensor picture combination by minding the pictures from several detectors to create a composite picture an infrared camera is accompanying the television and their exclusive graphics are merged to get a revised picture. This approach overcomes the issues known previously. The digital camera Is appropriate for daytime scenes; the infrared camera is appropriate in poorly ventilated surroundings it is utilized in military place, machine vision like in thing discovery, robotics and medical imaging. It is used to tackle the unite advice of many pictures.
Multi-view Fusion: this image has different or multiple views at precisely the exact same moment.
Multimodal fusion: images from various versions such as panchromatic, multispectral, visible, infrared, remote sensing. Typical procedures of image fusion, Weighted averaging pixel-wise, mix in transform domain picture level mix. Multi-focus Fusion: pictures from 3d perspectives with its own focal length. The original picture can be divided into regions for example each and each place is responsible for a minimum of one place of the picture (R.Johnson
Suthakar, J.Monica Esther M.E, D.Annapoorani, F.Richard Singh Samuel (2005)).
3.4 Image Fusion Techniques and Methods 3.4.1 Introduction
Generally, fusion techniques may be divided into various levels:
1. Signal level mix in sign-based fusion, signals from various detectors are combined to make a new sign with a much better signal to noise ratio compared to originals signals.
2. Pixel/Data level combination is the mix information from several sources in individual resolution information, that is anticipated to be informational to either of the input or show the changes involving info sets obtained at various times.
3. Feature level fusion extracts different attributes, from various information collect sources and merge them into a single source or more attribute maps which might be used rather than the original information for additional processing. It utilized as input preprocessing for image segmentation or change detection.
4. Decision level fusion combines the results from many algorithms to create a final revised choice (J. Lanir, et al. (2007)).
A lot of image fusion methods which have been analyzed and developed but every new method based on the common characteristics on basics method so far are as follows:
3.4.2 The brovey transform image fusion
The BT relies on the chromaticity transform. It's an easy way of combining data from several detectors with the restriction that only 3 bands are included. Its goal is normalizing the 3 multispectral bands taken for RGB display also to multiply the consequence in every desired advice to create the brightness or brightness part to the image, this technique requires an experienced analyst for its pacific adaptation of parameters. The Brovey Transform was designed to avoid the downsides of this multiplicative method. It's a mix of arithmetic operations and normalizes the spectral bands until they're multiplied together with the panchromatic image.
3.4.3 High pass filtering
The high heeled multispectral images are obtained from high pass filtering. The high-frequency data in the high heeled panchromatic image is inserted into the minimum resolution multispectral picture to find the subsequent picture. It's completed by obeying the high-resolution Panchromatic picture with a high pass filter or simply by carrying the very first HRPI and subtracting LRPI out of this. The spectral information comprised at the Specific Low frequency information of this HRMI is maintained via this procedure (Z. Zhang and R. S. Blum,1995). 3.4.4 Artificial neural networks
Artificial neural networks (ANN) have found their importance of pattern recognition. Within this kind of nonlinear response, the purpose is used. It uses a pulse coupled neural network (PCNN) which is composed of a comments system. This system is separated into three parts namely the open area, the modulation area, along with the pulse generator. Each neuron corresponds to the pixel of the input picture. The pixel strength is used as an outside input to the PCNN. This process is valuable concerning hardiness against noise, liberty of geometric variations and also the capacity of bridging minor intensity variations in input routines. PCNN has biological importance and used in medical imaging since this course of action is possible and supplies real-time system performance (Z. Zhang and R. S. Blum,1995).
3.4.5 Principal component analysis
PCA transformation is a method out of data for bettering a data collection. It was created by Pearson 1901 and Hotelling 1933, although the finest modern benchmark is Jolliffe, 2002. The purpose of the technique is to decrease the dimensionality of multivariate information whilst maintaining as much of the pertinent information as you can. PCA data are frequently more interpretable than the source information. By utilizing this process, the redundancy of the image data could be diminished. The PCA involves a mathematical process that transforms many Connected factors into many uncorrelated variables called principal elements It simplifies a more streamlined and best description of this information collection. The first key element Must be along the trail with the
Figure 3.3: Block scheme of the PCA fusion method. Source: J. Lanir, et al. (200
The next principal element is bound to lie at the sub space vertical with the very original. Through this sub space, this part factors that the management of highest variance. The 3rd main part would be that the absolute most variance direction from the sub space vertical for the initial along with The PCA might even be termed Karhunen Loeve shift or also the Hotelling shift. The PCA will not need a pre-determined collection of carrier’s vectors, along with wavelet etc. From the combination process, the PCA system generates an interconnected and harmonious image (PC1, PC2.... PCn, in which n is amount of entered Multi-spectral packs. Afterward, reverse PCA transformation is employed to acquire color RGB shown in the picture is annotated in the figure3.
3.4.6 Intensity-hue-saturation (ihs)
IHS is a common way of fusing high spatial resolution, single band, pan and low spatial resolution, multispectral remote sensing image. The R, G and B rings of the multispectral image are changed into HIS parts, substituting the intensity element by the pan image, and executing the reverse transformation to acquire a high spatial resolution multispectral image (see figure 3.4). HIS can improve spatial specifics of the multispectral image and enhance the textural features of the fused, but the fusion image exists serious spectral distortion. The
PAN MS1 MS2 MS3 PC 1 PC 2 PC 3 FUS 3 FUS 1 FUS 2 Resample PCA Inverse PCA Contrast match replace 1
HIS change can be used for geologic mapping since the IHS Change could allow varied forms of spectral and spatial landscape Data to set for analysis
Figure 3.4 : Block scheme of the IHS fusion method. Source: J. Lanir, et al. (2007)
The color disfigurement of HIS technique is important. To decrease the color disfigurement that the PAN density has been matched in the picture element are extending before the reverse change. Image blend based on the non-sub-par Contourlet change (NSCT) and HIS attained increased in keeping the spectral data and spatial information and better integration impact. With HIS change, the section-based fusion was designed especially or spectral features maintaining image merge combined using a spatial domain filtering (Z. Zhang and R. S. Blum,1995).
3.4.7 Multi resolution analysis based method
The multiresolution analysis is just most promising approaches in image processing. The MRA theories were intimated by Meyer and Mallat, which gives a natural frame for the comprehension for wavelet and pyramid change foundations. The researchers categorized the multiresolution in two ways, they're low resolution and higher resolution. The vector space contains another vector space its higher resolution. Each vector space contains all vector spaces that are of low resolution
PAN MS1 MS2 MS3 I H S FUS 3 FUS 1 FUS 2 Resample RGB IHS IHS RGB Contrast match replace 1
3.4.8 Pyramid transformation
Various sorts of pyramid decomposition are utilized or designed for image combination like a ratio of non-pass pyramid, gradient pyramid, laplacian pyramid. Pictures pyramids is a multiresolution evaluation variant. The basic idea is to construct the volcano change of this revised picture in the pyramid transforms From the foundation picture after which fused picture is accessed from simply taking reverse pyramid transform. It may offer both frequency and spatial domain localization.
It may offer advice on the contrast affects and the human visual system is particularly sensitive to those sharp contrast adjustments.
The basic principle of laplacian analysis of the source image is to create composite representation and reconstruct the image by integrating these analyzes and eventually rebuild the revised image by doing an inverse pyramid Change. Schematic diagram of the laplacian pyramid fusion method is shown in figure 3.2.
pyramid image A
Majority filter Fused Intermediate result pyramid pyramid image B
Figure 3.5: Block scheme of the Laplacian Pyramid fusion method. Source: R. Johnson Suthakar, J.Monica Esther M.E, D.Annapoorani, F.Richard Singh Samuel (2005)
Laplacian Pyramid used several modes of the mix like averaging or selection. From the first one, the mixing procedure chooses the part pattern in the origin and Copies it to the combination pyramid, while discarding the routine. At the next one, the procedure averages the resources patterns (J. Lanir, et al. (2007)).
Image A Fusion Image B Final fused image
3.5 Application and Uses of Image Fusion
Basically, used in satellite or remote place for its ideal perspective of satellite eyesight it should use in medical imaging. Picture blend employed in military regions in which all of the viewpoints used to discover the dangers along with other settlement work-based performance. For devices vision, it's effortlessly utilized to envision states subsequent to a picture concludes its excellent to your eyesight. In robotics discipline falsified pictures mostly employed to inspect the frequency versions from the perspective of images (J. Lanir, et al,2007)
3.6 Advantages and Disadvantages of Image Fusion
Advantages: It's easiest to interpret. Fused picture is true in color, it's ideal for recognition and identification, it's low in price, it's a high resolution utilized in multiscale images. Through image fusion there's enhanced fused graphics in fog, Picture fusion keeps the capacity to read outward signs in most areas, Picture blend has numerous contrast benefits basically it should improve the picture along with all the views of a picture, it raises the conditional awareness. Picture blend diminished the data storage and information transmission.
Disadvantages: Images have less functionality in unfavorable climate states it often does occur when movie blend is completed with just detector mix procedure, maybe not readily visible during the nighttime its own principal for effect of digicam attributes if it's in daytime or nighttime. Added resource vitality is critical because of its exemplary conversion of mages predicated on plasma frequency,'' as a result of fog or rain visualization isn't cleared in the event that you simply click both source images within such a kind of climate states that it provides the hardest output. Through this action you'll find tremendous possibilities of info loss, it takes care. Performance of data is still very slow when images have been calibrated (J. Lanir, et al,2007).
In this thesis, we used discrete wavelet transform (DWT) based on image fusion because it provides sufficient information both for analysis and synthesis of the original signal, with a significant the computation time. the DWT is considerably easier to implement when compared to the CWT. In the next chapter, we will explain the image registration which intent is to align images
with respect to each other, The result for this step can help in further analysis processes including image fusion.
4. DIGITAL REGISTRATION THEORY
4.1 Introduction
Image registration is an essential in medical analysis that has gained in twenty decades of evolution. Even the correspondences could possibly be utilized to alter the appearance from rotating, and multiplying, extending etc., of a single picture therefore it closely looks like a somewhat different therefore the place may possibly be directly contrasted, together or examined. The absolute most instinctive use of registration is really to mend for distinct individual regions between notes. Picture registration is not a conclusion by itself adds significance to both images, e.g. by allowing structural and operational images to be witnessed and examined from the specific same unified technique, additionally alleviates fresh applications of images, e.g. to monitor and quantify illness progress together with period affected maybe to create statistically units of structural variant at people (Pelizzari CA, Chen GTY, Spelbring DR, Weichselbaum RR,1989).In some app fields picture enrollment is currently a core unit including as for instance (I) reputable examination of fMRIs with mind demand photograph registration to adjust for more compact a large number of topics matter movement throughout ; (ii) the favorite system of voxel based morphometry employs image enrollment to send brain images outside of tens of thousands of tens of thousands or even numerous themes to an average coordinate process for test (alleged “plasma screen normalization"); (iii) the test of perfusion images of this core could not be potential minus picture enrollment to pay for human respiration; also (iv) a few of the latest MR image acquisition systems include things like picture registration to adjust movement. Traditionally, image-registration has been categorized to be “rigid" (where by images should function as objects that simply must get rotated and interpreted based using just one individual to reach correspondence) or even “on-rigid" .For those apps a stiff system approximation was decent as there is relatively slight
shift at heart position or form in the skull over the relatively brief durations amongst scans. In these times inflexible registration is usually lengthy to comprise affine registration, for example scale factors and shears, and also may partially deal with for calibration openings round gross or scanners gaps in scale amongst problems. Additionally, there were several new reports that protect these areas in far greater depth (Barbara Zitova, Jan Flusser,2003).
4.2 Image Registration Classification
The classification of image registration Methods (P. A. Van Den Elsen, E. J. D. Pol and M. A. Viergever,1993), are summarized and given from the figure 4.1, these methods explained in this chapter.
4.2.1 Intensity-based and feature-based models
Image orientation calculations of both image enrollment process are all categorized to potency predicated and feature established. Inside this course of action, one of those images is named the foundation or routine, with one different man images are called the sensed or purpose or theme graphics. The photograph enrollment is Accessed by way of spatially registering for a target graphics to coordinate together using the reference Graphics From the intensity-based procedures, it's compared hardness routines in graphics throughout significance metrics, and also in feature-based procedures, locates involving graphic lineaments such as things, along with boundaries. Intensity-based systems enroll entire images or sub-images. In case sub-images are enroll, centers of sub graphics are handled as corresponding element factors. Feature-based processes set a correspondence between an assortment of different details in movies notably.
4.2.2 Transformation models
Following the attribute correspondence was shown that the mapping function is assembled. It ought to change the sensed picture into overlay it on the mention. The form of the mapping function has to be corresponded with the supposed geometric disfigurement of this perceived image, into the procedure of image acquisition (e.g. scanner reliant distortions and mistakes) as well as the essential
precision of the enrollment (the identification of mistake to get rigid-body point-based registration has been introduced. In particular circumstances if the geometric disfigurement is partly known, e.g. if a version for this disfigurement due to the apparatus or the geometry, the correction depending on the reverse of the disfigurement could be achieved (by way of instance, in Refs. (Brown Gottesfeld L,1992), The version our entire world's form and spinning the satellite orbit together side all the scanning geometry of this sensor). Examples of communication purposes might be divided to two broad categories centered around the number of image info they make use of because of their services. World wide variations use all CPs for estimating one particular among their mapping job parameters legitimate for that entire photograph. On the flip side, the neighborhood mapping works treat the image for a synthesis of spots as well as the function parameters are based on the positioning of their service from the picture. It contributes into the tessellation of the picture, normally a triangulation, as well as the specifying of parameters of the mapping work for every patch individually.
4.2.3 Spatial frequency domain models
The spatial coefficients in the image processing have a specific function as they operate on the density characteristics of the image are in the frequency field The algorithms made for feature fitting is somewhat shallow to conventional processes of picture enrollment. Following the number of deal facets surpasses the minimum needed to specify just the perfect conversion version, Consensus and random replication of this algorithm (Mauer C.R., Fitzpatrick J.M.,1993) can likewise be properly used to re-gauge the parameters register the picture.
The algorithm built to detect that the spatial conversion parameters in between source and objective pictures out of the picture registration process drops into spatial-frequency domain variations. These methods, when determining the frequencies of frequency energy, benefit from frequency conversions. The period procedure can be used into a pair of graphics whilst to create a 3rd film which comprises one particular summit from the frequency domain name. The procedure is resilient to sounds, occlusions, as well as different flaws regular of satellite or medical graphics, including a fantastic deal of plasma-domain names. What's more,
the cross-correlation amongst both movies which commonly impacts considerable performance profits.
4.2.4 Mono-multi-modality models
Another method has been classified amongst mono- modality along with multi-modality techniques. In only multi-modality variant the picture is accessed from just the distinct very same scanner, whereas at multi-modality registration procedures the graphics got by multiple sensors or in a few situations. Multi-modality registration procedures include a whole lot of apps in professional medical image evaluation.
4.2.5 Manual, semi-automatic, and automatic models
The tools meant for direct Orientation of origin and target pictures are predicted Guide variations. Semi-automatic variations require validate the correspondence of registration. Interactive technical decrease user bias by executing specific key operations mechanically direct to your registration. Semiautomatic approaches do additional of these enrollment measures automatically but certainly are based up to confirm that the correctness of picture registration treatment. Algorithms that are intended to perhaps not let any consumer together with almost any kind, additionally plays with all enrollment steps mechanically.
4.2.6 Similarity models
The similarity actions listed here will be divides in to two different classes, either the durability or also attribute-based procedures. Predicated around the traits employed, a few pruning steps can possibly be included in each classis. Usually the resemblance measure used for deformable image registration includes 2 phases: a single correlated for this specific voxel strength or structures similarity, and also the other individual into the deformation field hence, the previous similarity step, or expenditure feature, can be tradeoff between the “voxel strength or structures resemblance" along with the constraints levied about the deformation niche. The restriction expression is typically referred to as punishment or regularization time period. Notably in non-rigid registration, the alternative of this relocating and mended images may cause different enrollment outcomes. Such issues have been known as inverse inconsistency and signify that a blunder at least one of the enrollment directions.