FOREIGN CAPITAL PENETRATION AND FINANCIAL MARKET DEVELOPMENT IN DEVELOPING COUNTRIES: CASE STUDY OF TURKEY
1989-2010 Nihan BULUT
113700026
İSTANBUL BİLGİ UNIVERSITY INSTITUTE OF SOCIAL SCIENCES
FINANCIAL ECONOMICS GRADUATE PROGRAM
Thesis Advisor : Asst. Prof. Serda Selin ÖZTÜRK 2016
ABSTRACT
Do FDI and financial market development contribute to the growth of Turkey economy as it has been publicized for the last decade? There are differences in developing country examples when the growth patterns are analyzed. While some of them do favor of the increasing foreign investments and growing financial sectors, some others don’t experience the similar developments at macro level or micro level, either. Political environment of the country, financial liberalization policies,
dependency to foreign capital for debit financing, financial market and banking sector regulations are the primary sources of the differences among GDP growth levels. Improvement of the country’s competitive sectors, development of labor and capital productivity levels, working on know–how technology, preventing bribery for the entry of new entrepreneurs and supporting the invention or creation of the new products are at same level of importance to understand the differences of the industrial growth rates.
In the first part of this dissertation, the literature findings are discussed and analyzed to observe where Turkey does stand at macro level and industrial level when the increasing foreign capital income and financial market growth is taken into consideration.
In the second part, econometric models are constructed to analyze the last decades of Turkey in terms of growth to see whether the literature findings are consistent with the statistical analysis.
ÖZET
Son on yılda yabancı sermaye girişi ve finansal piyasaların gelişimi Türkiye’de propaganda yapıldığı üzere ekonomik kalkınmaya katkıda bulundu mu? Gelişme düzeyleri analiz edildiğinde gelişen ülkelerin büyüme şekilleri arasında farklılıklar bulunuyor. Bazı ülkeler yabancı sermaye girişi ve finansal piyasa gelişiminden olumlu yönde etkilenirken, bazı ülkeler ise makro ve mikroeconomik seviyelerde bu olumlu gelişmeleri göstermiyor. Ülkedeki politik atmosfer, finansal liberalleşme politikaları, borçları finance etmede yabancı sermayeye bağlılık, finans sectörü ve bankacılık sektör düzenlemeleri gayrisafi milli hasıla büyüme seviyeleri arasındaki farklılıkların birincil kaynakları. Ülkenin rekabet edebilir sektörlerinin gelişimi, insan gücü ve sermaye üretkenliğinin arttırılması, üretim yöntemleri bilgisi üzerine
çalışması, yeni girişimcileri girişi için rüşvetin önlenmesi ve yeni ürünlerin icadı veya üretiminin desteklenmesi gibi faktörler endüstriyel seviyedeki gelişimi anlamak için aynı derecede önemliler.
Tezin ilk bölümünde, literatürdeki çalışmalar incelenip, yabancı sermaye girişi ve finans sektörü gelişimi göz önünde bulundurulduğunda Türkiye’nin macroekonomi ve endüstri büyümesinde hangi noktada olduğu tartışıldı.
Tezin ikinci bölümünde oluşturulan ekonometrik modellerle Türkiyenin son yıllardaki büyümesi baz alınarak literatür araştırmaları ve istatistiksel sonuçların uyumu analiz edildi.
iv CONTENTS
SECTION I: INTRODUCTION...1
SECTION II: FDI AND FINANCIAL MARKET DEVELOPMENT AT THE MACRO LEVEL………...3
Literature Overview on FDI’s influence on Economic Performance…………...3
Financial Market History in Turkey………...7
Financial Sector Performance in Turkey………..13
SECTION III: FDI AND FINANCIAL MARKET DEVELOPMENT AT MICRO LEVEL…18 Firms Characteristics in Developing Countries …………...18
Legal System, Corruption and Tax Evasion……….21
Business Sectors in Turkey………...24
SECTION IV: DATA AND EMPIRICAL RESULTS………27
Economic Growth- LS Method……….…27
Economic Growth and VAR Model……….….33
Economic Growth and VECM Model. ……….……..….37
SECTION V: CONCLUSION ...41
v FIGURES
1. A Trade Concentration of Turkey and Chile………...…….…………... 5
1. B Stock Prices in Turkey ……….………..………….……... 9
1. C Foreign Banks Density in Turkey………...10
1. D Turkey’s Current Account Balance, Trade Balance and Long Term Government Debts………...11
1. E Bank Deposits as a Fraction of GDP……….………...13
1. F Ratio of Private Credits Issued by Deposit Banks to GDP………..14
1. G Return on Bank Assets and Equities ………..15
1. H Turkey’s Stock Market Capitalization to GDP………...16
1. I Stock Market Total Value Traded to GDP in Turkey………...16
1. J Turkey’s Stock Market Turnover Ratio………....17
1. K Various Capital Markets Relative to GDP………..18
2. A Some Indicators of Corruption in Turkey ……..……….23
3. A ICT Sector in Turkey………...24
3. B Total Number of Cargo Ships and Tankers……….25
3. C Total Length of State Highways and Provincial Roads………...25
3. D Automotive Industry Production……….26
3. E Rates of Returns Created by Financial Investment………..………27
4. A Normality Test……….……….33
vi TABLES
1. A Augmented Dickey-Fuller Test Statistics……….…………..28
1. B Regression Output- LS Method………..……29
1. C Heteroskedasticity Test: Breusch-Pagan-Godfrey………..30
1. D Breusch-Godfrey Serial Correlation LM Test……….31
1. E Correlogram……….………....32
2. A Estimation Output of VAR Model………..34
3. A Unrestricted Cointegration Rank Tests (Trace and Maximum Eigenvalue)……..…...37
3. B Estimation Output of VECM Model………39
1
INTRODUCTION
This work attempts to study the economic growth of Turkey in terms of financial market development concurrently with the increase of foreign capital inflow. While analyzing these factors, primarily this study focuses on the macro level impacts of these and later on observes their micro-level effects. This present paper follows this pattern mainly to survey whether the political expressions and public notifications on Turkey’s growth in recent years accompany with the theoretical and empirical studies. Economic growth is a shallow term to be able to define a country's development or well-being, as agreed by a majority of economists. This study takes into consideration the changes in the overall economy that affect the growth rate directly such as the capital accumulation, innovation or introduction of new technologies and change in factor productivity levels. (Solow, 1957) Further on, the observation continues with firms and their capital structure in emerging countries. It clarifies the dynamics of firms’ growth and productivity changes to check whether the financial market development has a significant impact on their access to finance. As a whole, the prime aim of this study is to detect the effect of foreign direct investment through financial markets on the economy, at macro and micro level. In the light of the previous studies and with the help of statistical analysis, an empirical study is accomplished for Turkey.
In the first section, there are three subsections; initially this study works and comments on historical findings on foreign capital penetration to emerging countries, the patterns and the consequences of this penetration. The evidence suggests significant differences among countries with different levels of trade dependency. At the second subsection, finance sector history of Turkey is viewed starting from the second Petrol Crisis in 1978 until 2010. At the end of the first section, financial market performance of Turkey is focused on reviewing the activity, size and efficiency of the banking sector, finance sector and other capital markets. (Beck, Demirgüç-Kunt, Levine and Maksimovic, 2001)
2
At the second section of this paper, firstly the firms’ characteristics in developing countries and their choices of finance, in case of financial market development, are observed. Besides, the comparison of financing choices of large corporations and SMEs is carried out to understand the dynamics of the preferences between foreign and domestic capital. Foreign investors mainly prefers business services sector (16, 7%)), following with diversified industrial products (13, 2%), automotive (12, 4%), ICT (9, 9%), financial services (9, 1%) and transport& logistics (8, 9%).(Ernst& Young's Turkey 2013) Despite the capital entry from external lenders, further productivity and growth of the business are not realized due to the unfruitful business environment. (OECD Turkey 2014) An enterprise that has the intention to develop a business in Turkey most probably faces a rigid bureaucracy in every step of its operation. Corruption in the form of bribes or gifts to officials is also another phenomenon that needs to be thought with attention. Moreover, corporate taxes and labor laws that directly influence the productivity of labors also seem in poor condition in our country. In the following subsections of the second section, the business environment of Turkey and the importance of the legal structure of a country and control of corruption is discussed. Lastly, some of the major business sectors in Turkey are reviewed with the help of conventional information on those sectors.
At the third section, at first two regression models are constructed to explain the effect of FDI and financial market development in the Turkish economy. Firstly, LS method is used to explain the impacts of independent variables. That model reveals that financial market development and trade openness have positive and significant effects on the economic growth. This method's statistical results reveal the insignificant impact of FDI on GDP growth. As a second model, since a time-series data is observed, VAR model is used to find out the correlation between GDP growth and the independent variables. Market capitalization, stock market turnover, and private credits issued by the financial sector, used as a proxy for financial development. VAR model reveals that there are no significant relations between GDP growth and the independent variables. Lastly, as it is figured out that there is cointegration between variables, VECM model is analyzed. Consistent with the
3
previous models, VECM gives the same results regarding the insignificant relationship between FDI and growth rate of Turkey.
The final section covers all sections and presents the outcome of observations done throughout the paper. The study presents that FDI and financial market development fail to contribute as significantly as it has been publicized.
1. FDI AND FINANCIAL MARKET DEVELOPMENT AT THE MACRO LEVEL
I. Literature Overview on FDI’s influence on Economic Performance
It is widely believed and pronounced that foreign capital entry into a developing economy causes an amelioration in the host country. In the short run, an increasing amount of capital for investments may accelerate the growth of some industries or some sectors of the country. But each country reflection should be handled separately as the use of the capital in a particular country strongly linked with its current political and business environment. It is estimated that financial liberalization, such as accepting foreign investors in the stock market, helps the growth of financial markets and growth of the economy. (Bekaert, Harvey, and Lundblad, 2001-2005) On the other hand, dependency theorists claim that penetration of foreign capital generates declining public revenues. On the other hand, more importantly, the profits that foreign investors acquire through their operations go back to the main country or outside the host country. Most probably, earnings from these businesses are not reinvested in the host country. (Dixon & Boswell, 1996) The last case is called as “de capitalization." (Bornschier 1980)
A different standpoint to this subject is discussed and researched by Kentor (1998) and Boswell (1996), such that they emphasize the importance of looking into the dynamics of foreign investments within a country. They review the significance of trade composition, foreign investment concentration on the target company and the outcomes of the capital entry, as well. Comparative advantage theory (Ricardo
4
1817), indicates that a country export the products that have relatively lower opportunity costs. However, due to inefficient use of raw materials, some underdeveloped or developing countries specialize in products that are in fact not the comparatively advantageous ones. Foreign capital creates detrimental impacts on its economic growth if a country stands in the global market with the products that haven't the lowest opportunity cost. The case is similar if it prefers to concentrate on a specific market for the sale of their products. (Rubinson and Holtzman, 1981) When foreign companies start to occupy a country's business environment, and when they have the upper hand there, they also have dominance in the political and social sphere. (Kentor(1998) and Boswell(1996)) While maintaining the diversification of foreign investors, these countries prevent concentration of foreign investment in a specific sector and maintain their autonomy. Inability to keep their autonomy eventually prevents the host countries from bargaining over their benefits and negotiating in a liberated atmosphere.
5
FIGURE 1.A
Source: Exporters Dynamics Database
At figure 1.A, there is a comparison of Turkey and Chile between 2003 and 2009, as two distinct developing country examples, and which are favorable destinations for foreign direct investments. When the chart is analyzed, it is seen that
0 2 4 6 8 10 12
2003 [YR2003] 2004 [YR2004] 2005 [YR2005] 2006 [YR2006] 2007 [YR2007] 2008 [YR2008] 2009 [YR2009]
Trade Concentration of Turkey and Chile
Turkey TUR Share of top 1% Exporters in TEV (Total Export Value) Turkey TUR Share of top 5% Exporters in TEV (Total Export Value) Turkey TUR Share of top 25% Exporters in TEV (Total Export Value) Turkey TUR Number of Destinations per Exporter: Mean
Turkey TUR Number of HS6 Products per Exporter: Mean Chile CHL Share of top 1% Exporters in TEV (Total Export Value) Chile CHL Share of top 5% Exporters in TEV (Total Export Value) Chile CHL Share of top 25% Exporters in TEV (Total Export Value) Chile CHL Number of Destinations per Exporter: Mean
6
they are similar in terms of the shares of exporters in total exports. Turkey demonstrates a significant difference in product diversity. Besides, Chile has fewer export destinations than Turkey. It can be said that Chile’s trade is more concentrated compared to Turkey’s.
One of the other key questions is whether there is a difference to use the foreign capital or domestic capital. Previous studies show a negative correlation between the use of foreign capital to finance local business and growth of domestic business sectors. Firebaugh demonstrated that domestic capital is three times more effective in generating growth in third world countries than foreign capital. Underlying reasons are shown as; relatively easy access of domestic business owners to the local market, being familiar with local culture and being able to establish relations with the local business partners more easily and efficiently.
Empirical findings show that foreign banks in developing countries prefer more “transparent” customers, mainly the well- known large companies or government whose financial statements are widely-known. They skip the medium or small size borrowers. This elimination of borrowers by foreign lenders is named as “cream skimming”. (Detragiache, Gupta, Tressel, 2006) Because of having a more sophisticated knowledge and technology infrastructure, foreign banks can specify the reliable and big size customers for their funds. However, domestic banks have better knowledge about the local but medium or small size companies. In the same study, while talking about the cream skimming of the country by foreign banks, the authors also point out the costs of this filtering on the banking sector. While taking the big borrowers from the pool, the remaining SMEs face with higher costs of borrowing, which in return make them prevent investing. Particularly in the economies where the SMEs control the majority of the business in the economy, their lack of funds has a deteriorating effect on the economic growth.
Another approach is that, in the developing economies, mainly "old money" rules the economy. Since these old enterprises have establishments for long years and have great dominance in their sectors, their concern is mainly preventing newcomers
7
to the sector, rather than developing new and productive projects. (Chui, Titman, Wei, 2000) An economy's growth is possible with the introduction of new technologies, products or improving the existing. In spite of growing populations and the vast income equalities, developing countries possess a high ratio of the young who is eager to develop new and productive projects for the development of the overall economy.
II. Financial Market History in Turkey
Following the 1978 crisis, like the rest of the world, Turkey had also entered a new era with the means of several liberalization policies and structural changes in the business sectors and financial markets. While the oil exporter countries were looking for borrowers for their funds, Turkey was desperately in need of credits so that she could compensate its budget deficit and pay its external debts. At this time being, IMF, World Bank, and OECD had an immense bargaining power over developing countries. Specifically, Turkey was one of the ill-conditioned that were in need of external support. These countries were dependent on major field players to maintain their export incomes and cover their lack of raw materials. (Kazgan 2012) With the pressures of the finance powers, Turkey had adopted the 24 January policies in 1980. That was a clear manifestation of Turkey’s enter to liberal markets by opening the country to foreign investors, liberalizing the exchange rate and interest rate policies. In this way, Turkey left the state intervention in finance markets and moved to a more market-oriented structure. From 1980 to 1983, due to the standby agreement between Turkey and IMF, Turkey just accepted credits from IMF, World Bank, OECD, Saudi Arabia and European Resettlement Fund. After 1984, with the permission of IMF, Turkey was able to receive credits from different sources. (Kazgan 2012)
In the beginning years of 1980s, after the liberalization of interest rates, some exploiters among the banks and bankers came into the scene. They inflated the levels of interest rates. Companies from various sectors that weakened in their operations throughout the 1970s borrowed at very high-interest rates. This period finalized with
8
the bankruptcy of many banks, harming lots of people. Coming to the end of 1980s, Turkey was not better than the beginning of the decade for solving its budget deficit problem. Foreign debts, interest rate levels, and Turkish lira devaluation continued to climb. In 1985, Istanbul Stock Exchange established and first mutual fund issued in 1987. Liberalization of foreign investment was recognized in 1989. (The Handbook of the Turkish Capital Markets, 2014)
During 1990s, all countries experienced major financial crises. Turkey was influenced by the global financial crisis, as well. 1991, 1994 and 1999 crisis deeply affected the overall economic situation. Within these crises, foreign capital continued to flow in Turkey via direct investments and stock purchases in markets. As discussed in the previous section, how to direct the foreign capital within the host country is vitally important. Throughout these years, local companies’ stocks in the market lost an enormous amount of values. Foreign investors benefited from these losses and purchased these cheap stocks while penetrating into the local market.
When the case of China is observed, it is seen that China became successful channelizing the capital into productive business areas, improving its production capabilities and increasing its exports over imports. Eventually, she made out annual growth rates over the world average whereas Turkey’s growth rates were around the world average. One of the leading reasons for this fact is that Turkey was happened to be an area where the foreign investors could find high and rapid returns for their funds. Lots of foreign flow goes into the construction of shopping malls or privatization of public enterprises, without creating a considerable employment and productivity of factors of production for the economy. (Kazgan, 2012)
At the below chart, the change in the stock prices in the Turkish market during the crisis periods of 90s until the end of 2003 is depicted. The booming Turkish lira prices of stocks were mainly because of the devaluation of Turkish lira whereas the changing of the stock prices were consistent with the world levels.
9
FIGURE 1.B
Source: http://evds.tcmb.gov.tr/.
At the edge of 2001 banking crisis, markets saw very high-interest rates for Turkish Lira. The overnight interest rate increased from 199% to 873%. Foreign direct investment declined from 138 million dollars to 112 million dollars from 1999 to 2000. Banks increased short-term credits from 3 billion dollars to 6.8 billion dollars in the aim of compensating their budget deficits. In 2000, cheapening of dollar accelerated the outflow of capital from Turkey, which was 2.7 billion dollars.
2001 banking crisis had a major place in finance market history of Turkey since the bankruptcy of banks highlighted the serious lack of legal institutions that regulate the establishment of a bank. Turkey used to offer a substantially flexible environment for the fund owners. Before the crisis, high returned Turkish Treasury bonds appealed lots of foreign investors. These found cheaper funds elsewhere and invested in Turkey, benefiting the difference between the rates. Another crucial cause of the banking crisis was the growing budget deficit and the foreign trade deficit of the country. The government used to block the capital inflows so that private enterprises couldn’t find resources for their investments. That prompted for some large enterprises to open their banks and direct the resources of the bank for their usage. Due to the insufficient audit mechanisms and absence of major banking regulations, there was uncontrolled inflow and outflow of the capital. State banks,
0.00 100.00 200.00 300.00 400.00 500.00 1990 1991 1992 1993 1994 1995 1996 1997 1998 1999 2000 2001 2002 2003
Stock Prices $
10
such as Ziraat Bankası, Halk Bank, and Emlak Bankası were in deep loss as they were supplying credits to the relatives or acquaintances of politicians and not collected most of these credits. Besides, the credits and subsidies that were promised by politicians to the farmers or small business owners used to be recorded as business losses on the balance sheets. Besides to these losses, IMF forced the government to take the responsibility of returning the debts to the creditors, especially to the foreign creditors. The burden of this crisis over the economy was 47.3 billion dollars, 20 % of GDP in that year. After the crisis, the quantity of state banks decreased to 3 from 5 and private commercial banks decreased to 18 from 36. After the issuance of the banking regulations, foreign bank entry gained speed. The foreign banks’ density increased rapidly in the following years of 2001 crisis. (Figure 1. C)
FIGURE 1.C
Source: Global Financial Development database
In that period, Turkey was one of the most attractive destinations to attain high returns in very short time. In terms of hot money- short-term speculative capital- Turkey had a premier place in the world market those days. When one invested 10$, he used to get back 15$ between 2002 and 2003. The volume of foreign direct investments had been around 800 million dollars until 2001. However, it reached 3.3
0 5 10 15 20 25 30 35 40 45 50 1995 1996 1997 1998 1999 2000 2001 2002 2003 2004 2005 2006 2007 2008 2009
11
billion dollars (2 billion of it linked to cell phones). It was due to the falling stocks prices of the domestic companies. That was a vast amount of capital loss since they used to buy the stocks much lower than their real values. G. Kazgan pointed as a result of purchases of stocks in the markets; foreigners acquired the major amount of food and tourism companies and banks. (2012) It is seen that foreign capital investment and liberalization of capital movements had negative influences on the country balance sheet. (Figure 1. D) In 2001, TSPAKB and Central Registry Agency had been established. (The Handbook of the Turkish Capital Markets, 2014)
FIGURE 1.D
Source: TCMB Elektronik Veri Dağıtım Sistemi.
Between 2002 and 2007, IMF ruled and regulated Turkey's economic and financial policies. Like the rest of the world, Turkey also experienced the positive outcomes of the growing world and country economies. IMF targeted the inflation rate decrease, and Turkey followed this policy, as well. The increasing capital inflow empowered the growth of the economy, whereas the foreign currency had caused the appreciation of Turkish Lira. While the entry of foreign capital was supported by high-interest rates, Turkish lira appreciation deteriorated the manufacturing sector,
-100,000 -50,000 0 50,000 100,000 1984 1986 1988 1990 1992 1994 1996 1998 2000 2002 2004 2006 2008 2010 2012 2014
Turkey 1984-2014, million US
$
CURRENT ACCOUNTS BALANCE TRADE BALANCE LONG TERM GOVERNMENT DEBTS
12
agricultures sector and services with export sales. Domestic business segments lost their competitiveness in the international arena. Particularly, the agriculture sector was weakened due to the abolition of the government subsidies by IMF.
Hot money entry contributed to the increasing earnings of financial markets whereas they didn't have a positive influence on the real economy. Unemployment rates and income inequality kept growing. Sufficient levels of investments couldn’t be recognized so that it could increase the productivity and support the well-being of the economy. From a foreign investor’s point of view, it was much profitable and easier to employ his funds on high return stocks rather than the fixed investments. Correspondingly, this had a detrimental effect on Turkish lira and domestic investments. As a reminder from the previous section, while the large corporations and old families in business benefited the hot money entry, SMEs proceeded to borrow at climbing interest rates.
In 2008, America and Europe experienced a severe financial market crisis. This crisis affected nearly all the world, except the ones that enjoyed the increasing import volumes of America, such as China or India. As Turkey was heavily dependent on America’s financial supports, she saw the outcomes of the crisis gradually. Turkey's export volumes decreased substantially, in automotive, textile and iron sectors. Export decreases were mainly due to the decrease in the foreign demand. The increasing cost of capital due to the devaluation of Turkish lira and growing interest rates on domestic currency were noxious for export. In 2008 and 2009, Turkey’s four major sectors; manufacturing, construction, trade and information transportation, lost strength. Eventually, that caused the increase in unemployment rates and decrease of the efficiency. The outflow of capital and decrease in foreign capital investment caused the devaluation of Turkish lira and decrease of BIST 100 indices. Through the end of 2009, when America and Europe recovered from the effects of the crisis, the appreciation of Turkish Lira and increasing values of BIST 100 indices replicated on account of the rising capital inflow. At 2010, Turkey was in a similar cyclical. Due to the high returns in financial markets, foreign capital went
13
on flowing into the country. On the other side, Turkish lira appreciated more while increasing the budget deficit and redoubling the need for external debt that was no longer as plentiful as before.
III. Financial Sector Performance in Turkey
By assessing the measures indicated by Demirguc- Kunt and Levine (1999), the performance of the financial sector in Turkey is figured out. Major components of the system; banking sector, stock markets, bond markets and other capital markets are examined. Gallego and Loayza (2000) pointed the three measures of each market; size, activity and efficiency to assign the financial system performance.
Banking Sector
The size of the sector is evaluated by the deposits of the banks’ as a fraction of GDP. These fractions among developing economies are compared in Figure 1. E. The size of the deposits of the Middle East countries are on the top whereas the Europe, and Central Asia's developing countries are at the bottom line. Turkey follows an average level in terms of its banks deposits’ share in GDP.
FIGURE 1. E
Source: Global Financial Development database
Banking sector’s activity is detected by observing the volume of private credit issuance. (Figure 1.F) After 1980 liberalization policies, there hadn't been an
0 20 40 60 80 1999 2000 2001 2002 2003 2004 2005 2006 2007 2008 2009 2010 2011
BANK DEPOSITS AS A FRACTION OF GDP
TUR Bank deposits to GDP (%) EAP Bank deposits to GDP (%) ECA Bank deposits to GDP (%) LAC Bank deposits to GDP (%) MNA Bank deposits to GDP (%)
14
important change in the proportion of private credit to GDP. However, the inflow of external debts and foreign capital penetration to the country through 2000s, created a deceptive economic amelioration. Also, the government's push of demand to increase their consumptions widened the private credit market, and private credits share within GDP.
FIGURE 1.F
Source: Global Financial Development database
Bank return on assets and equities after the deduction of taxes are used as proxies, to determine the efficiency of the banking sector. (Figure 1.G) While there isn’t volatility in the returns of assets, during the major crises, return on equities fell steeply. 0 10 20 30 40 50 1978 1979 1980 1981 1982 1983 1984 1985 1986 1987 1988 1989 1990 1991 1992 1993 1994 1995 1996 1997 1998 1999 2000 2001 2002 2003 2004 2005 2006 2007 2008 2009 2010 2011
15
FIGURE 1.G
Source: Global Financial Development database. Stock Market
The stock market capitalization as a fraction of GDP is checked to analyze the size of the stock market in Turkey. (Figure 1.H) Within 1990s, the accumulation of foreign capital inside the country had a direct impact on the growth of the stock market. As discussed previously, Turkey’s offering high return on the funds drew the attentions of the foreign investors. While being greatly weakened by the 91, 94, 98, 2001 and 2008 crisis, with the IMF help and favorable investment environment, along with the depreciated Turkish lira, the stock market kept on growing.
-40 -20 0 20 40 60 1999 2000 2001 2002 2003 2004 2005 2006 2007 2008 2009 2010 2011
Bank Efficiency
Turkey Bank return on assets (%, after tax) Turkey Bank return on equity (%, after tax)
16
FIGURE 1.H
Source: Global Financial Development database.
The stock trade volume to GDP is figured, to assign the stock market activity. (Figure 1.I) There was a steady stock market trade until 2001 banking crisis. Accompanied by the decreased stock prices, foreigners overwhelmed the majority of the domestic companies stocks traded in the market. Following this crisis, the stock market total value kept its fraction to GDP.
FIGURE 1.I
Source: Global Financial Development database.
Stock market efficiency is assessed with the turnover ratio, as graphed in figure 1. H. Another interesting outcome for the Turkish stock market is that the stock turnover ratio after ‘94 crisis is higher than the ratio after ‘01 crisis. By the end of
0 5 10 15 20 25 30 35 40
Turkey Stock market capitalization to GDP (%)
0 10 20 30 40 50 60
17
90s, probably the growing trade volume of the market slowed down the turnover ratio.
FIGURE 1.J
Source: Global Financial Development database. Other Capital Markets
As shown in the figure 1.I, capital markets volume has a very small ratio in the Turkish economy. In the chart, it is seen that insurance company assets preserve its ratio in GDP throughout the years. Mutual funds came in at the start of 2000s, later on they kept their fraction to GDP as a financial instrument. Since the establishment of the pension fund in 2003, it has been also another investment tool although it couldn’t occupy big shares in GDP.
0 50 100 150 200 250 300 350
18
FIGURE 1.K
Source: Global Financial Development database.
2. FDI AND FINANCIAL MARKET DEVELOPMENT AT MICRO LEVEL I. Firms Characteristics in Developing Countries
In developing countries, most of the large corporations are held by wealthy families. The hierarchical structure of the firms is organized such that the family members are on top of the businesses. In more developed countries, where the board of managers are separated from the owner of the corporations, one of the main concerns is the top manager’s exploiting their rights for their personal interests. In developing countries, such a case is mostly very rare since one of the family members would be controlling the business. Still, in developing countries, it is seen that minority shareholders' or employees interests are sacrificed more easily.
When the capital structure of the firms in developed and developing countries is compared, in the former, companies prefer long term borrowing for their investments. That is for various reasons; far fewer numbers of procedures to access the finance, less volatility in the debt market in the long run and transparency of the public and corporate level information. These companies have less net fixed asset to total asset ratio compared to the companies in less developed countries. Nevertheless, the small ones among these companies suggest to facilitate short-term borrowing options rather than the long term; larger firms state greater fraction of long-term debt
0 2 4 6
1995 1996 1997 1998 1999 2000 2001 2002 2003 2004 2005 2006 2007 2008 2009 2010 2011
Various Capital Market Assets relative to GDP in Turkey
Mutual fund assets to GDP (%) .. .. .. .. ..
Nonbank financial institutions’ assets to GDP (%) 1,610538 1,482328 1,471485 1,292399 1,232875 Pension fund assets to GDP (%) .. .. .. .. ..
19
related to total assets. (Demirguc- Kunt, Maksimovic, 1999) The high volatility of exchange rates and interest rates make it more difficult for the companies to decide to use long-term borrowing in developing countries, especially for the small firms. Another important finding is that large companies are happier with the underdeveloped banking system whereas the smaller firms are better off with growing size of the banking system to reach more finance.
In the previous section, some graphs for Turkey are shown, explaining the activities of the banking sector and stock market. No matter if the business sectors are financed by the markets or banks, it is discussed by Demirgunc-Kunt, Feyen and Levine (2011) that increasing level of these sectors’ activities are associated with economic development. Turkey experienced an increase in these activities. Nevertheless, as seen in the previous section, the real case for Turkey is not convenient for this discussion.
Foreign bank entry into an emerging economy is claimed to have benefits for the domestic banking sector. Increasing liquidity and competition, decreasing the costs of financing and easing the access to the finance, specifically for large companies are some of these positive outcomes. The concern here is that without the existence of a well-functioning legal system and institutions, the redundant finance can be exploited by the enterprises that raise finance through their political connections or economic power.
Firms in less developed countries have lack to generate the necessary labor productivity because of multitude reasons like insufficient financial power or managerial capacity. (Bloom, and Van Reenen, 2007, 2010) However, SMEs in these countries can create high returns for their investments since they benefit the business opportunities of their country’s growing economies.
Both industrial and output growth of the developing countries is connected with the access or availability of finance. In the countries where the distribution of finance is uneven or uncontrolled, it is seen that the industry growth is slower than more developed countries. Due to lack of regulations, managerial capacity and
20
necessary know-how technology, it is substantially expensive and inefficient to develop a business in less developed countries.
Informality is another major problem in developing countries. Bribe payments, corruption, unrecorded transfer of money inflows and outflows are some examples of the informal activities in these countries. People or companies who are in pursuit of their self-interest, obviously are not in need of generating productive businesses for the overall economy. The increase of illegal activities in business sectors has detrimental impacts on the economy growth. (Ayyagari, Demirgüç- Kunt, Maksimovic, 2008) Another widely seen application in the business sectors of developing countries is that both the small and large firms tend to demonstrate lower profitability or income to decrease their tax payment obligations.
Ayyagari, Demirgüç- Kunt and Maksimovic( 2012) claim that the presence of “ high investor protection” facilitate to direct financial funds to productive projects. And the investors are more eager to raise funds, as well. Another claim is made for conglomerates that they will prefer to use their funds for their projects rather than an outside higher productive project in a country where there is weak investor protection. If there is effective investor protection inside the financial system, high productive projects can bank up funds conveniently in public markets. When the conglomerations have greater density in the markets, the supply of finance is mostly diverted to unproductive or less productive projects. (Ayyagari, Demirguc- Kunt and Maksimovic, 2012)
Rajan and Zingales(1998) argue that the industries that are not in need of external capital can grow more evenly than the ones that look for external budgeting for their investments or working capital. The liquidity of the stock market, the size of the banking sector and "the efficiency of the legal system" are important factors that decide the use of external finance. (Demirguc- Kunt and Maksimovic, 1998) In Turkey case, after 1978 crisis, it’s examined that the industries were slow in developing new products or technologies since they were unable to finance their raw
21
material and oil supply. That was one of the main reasons for the disproportionate economic development in Turkey.
Obviously, the efficient allocation of capital and the ability to access external capital bring out capital accumulation. Nonetheless, Solow (1957) demonstrated with the American case that rather than capital accumulation, the technological advances and its utilization to increase the labor productivity are the prime drivers of economic progression. Lately, Levine, Loayza and Beck (2000) have indicated that efficient resource allocation encourage economic growth more than the augmentation of investments.
Ayyagari, Demirguc-Kunt and Maksimovic (2011) show, in their analysis of the contribution of finance to economic development that finance serves majorly to SMEs in developing countries to finance their innovative activities. It has been demonstrated that these companies mostly prefer bank financing. Besides, the firms that want to engage in investments for innovative projects suggest bank financing, even in the presence of other financial resources, such as leasing companies, trade credits.
II. Legal System, Corruption and Tax Evasion
When the country reactions to foreign capital and growing size of the financial system are investigated, it is considerably essential to take the legal environment of the country into account. One of the fundamental differences between the developed and developing countries’ financial system is their establishment and application of the legal institutions. These institutions create a healthier and transparent atmosphere for business financing. In the previous sections, the outcome of the missing banking regulations in Turkey’s banking sector during crises is represented. Lack of a trustworthy legal system makes both the investors and creditors insecure. Consequently, a solid ground for the advanced financial markets can’t exist. The investors are not able to coincide with the creditors that are candidates for value creating for the economy.
22
Concerning the law enforcement, Scandinavian countries come first, the second is German civil law family, and following is the English common law countries whereas the French civil law countries are the weakest. (La Porta, Lopez de-Silanes, Shleifer, and Vishny, 1998) The systems such as English law system are better than the systems run by French civil law at generating financial development. While the inability or less capability of protecting the investor rights cause investors to invest less than their actual potential, nonexistence of the necessary regulations and the difficulty and plentiful procedures to access the external finance avoid firms to expand their businesses.
For a stable financial environment, another crucial factor is transparent and reliable information. Audited balance sheets, cash flows and income statements are the primary sources of a sustainable growth for the markets. Supply of such a system is expensive and more probably is not favored by the traditional money holders and political elites in developing countries. That’s why taking measures to regulate the system are slower than the developed countries.
Suzan Rose-Ackerman (1978) proposed that corruption, for instance in the form of bribes, can be deduced by increasing the competition. Ades and Di Tella (2003) state that bureaucrats claim higher rents from the firms when there doesn't exist perfect competition. They promise to eliminate taxes or ease their bureaucratic procedures. Murphy, Shleifer and Vishny (1993) claim that mostly the new or the innovator companies are susceptible to bribery since they demand licenses and permits from the government. The firms that pay bribes for their permits or licenses are more vulnerable to tax evasion since they find the right in themselves for underreporting their revenues when the government bribes. When government employees request and receive bribes from the companies, companies tend not to trust government and evade from paying taxes. Nonetheless, in countries such as Turkey where the corporate taxes and income taxes are at high levels, when the companies want to use bank loans for their finance, they tend to pay bribes to escape from their tax obligations. On the other side, internally financed firms are more likely
23
to escape from tax payments and they do not need to pay bribes, either. Financial markets support the improvement of tax administration hereby asking for clear and detailed statements of income to offer credits. However, informal financing opens way to tax evasion. (Ayyagari, Demirgüc-Kunt and Maksimovic, 2010) An important indicator for detecting bribery in countries claimed by Ayyagari, Demirgüc- Kunt and Maksimovic(2010) is the waiting time achieving a service or receiving a permit or license from a government service. The more a company waits for these services or licenses, the more likely that the bureaucrats extort bribes. Here below at Figure 2. A, with the data from Enterprise Surveys, there are indications about Turkey in terms of bribery, and days that are needed to obtain a service from public officials and the gifts that are given to these officials by the companies. As can be figured out from the chart, the days for procedures are qui-te long and there is big percentage of companies that are offering bribes and gifts for their businesses.
FIGURE 2.A
Source: Enterprise Surveys, 2008.
5.80 41.90 5.20 10.50 21.20 36.00 14.00 0.30 10.70 0.00 5.00 10.00 15.00 20.00 25.00 30.00 35.00 40.00 45.00 Bribery ind. (% of gift or inf. payment requests) Days to obtain a const. permit Days to clear direct exp. at customs Days to clear imports from customs Days to obtain an imp. license Days to obtain an oper. license Percent of firms give gifts to get a constr. permit Percent of firms give gifts to get an imp. license Percent of firms give gifts to get an opert. license
24
III. BUSINESS SECTORS IN TURKEY
Ernst& Young’s report reveals that foreign direct investments in Turkey are basically flow into the automotive sector, ICT, financial services and transport& Logistics. To investigate this, some data from DPT database is analyzed.
FIGURE 3. A
Source: DPT Database
In recent years, there is a big advance in mobile phone sector, with increasing purchases by giant multinational telecommunications companies. Vodaphone, for instance, as the second largest foreign direct investment in Turkey has invested 14 billion lira since 2006. The company employs 3300 employees in Turkey. As can be seen at Figure 3. A, there is a continuous investments in ICT sector in Turkey. This is not only due to country needs but also increasing mobilization through Turkey to launch call centers and benefit from the cheap labor. Another evidence can be drawn out from Vodaphone sample. While the output per worker is around 181000$ in Vodaphone, in Turkey GDP per capita is 11.018$ in 2014. While the sector is growing in Turkey on behalf of these large corporations, there is not a significant growth for per capita income levels.
0 10000 20000 30000 40000 1995 1996 1997 1998 1999 2000 2001 2002 2003 2004 2005 2006 2007 2008 2009 2010
ICT SECTOR IN TURKEY
Capacity of Telephone Main Lines (Thousand Lines)
Telephone Subscribers (Thousand)
25
Transport & Logistics is one of the favorable sectors in Turkey. To check the sector’s last position, some data is pulled out from DPT database, and the railway length, highway length, number of planes and merchant fleets are observed. For a growing local and international trade market, it is dispensable to have more advanced transport infrastructure. Here below, there are charts presenting the conditions of main facilities for logistics in Turkey.
FIGURE 3.B
Source: DPT Database
Total number of cargo ships and tankers declined at last 10 years, from 843 to 821. (Figure 3. B) 0 200 400 600 800 1,000 2000 2001 2002 2003 2004 2005 2006 2007 2008 2009 2010
26
FIGURE 3.C
Source: DPT Database
In 10 years, the length of total state highways and provincial roads added up only 1700 km. (Figure 3.C) In Turkey, trade is mainly operated by means of highway transportation and sea transportation. However, there is visible improvement in conditions of these means in recent years.
The only development in transport& logistics sector can be seen in airline industry. While there is a significant amount of foreign entry in this industry, THY (Turkish Airlines) has become a globally successful company by generating value and improving the sector conditions on behalf of the country and employees, as well. One of the basic reasons for that is THY has adapted and developed the know-how technology rather than just imitating.
Turkey experienced the fastest growth in automotive sector. There is three times growth in last 10 years. Yet, 95% of the sector belongs to foreign capital. The strategy of this flow is to exploit the cheap labor and enlarging consumer market in emerging markets by developed countries.
60,000 60,500 61,000 61,500 62,000 62,500 63,000 2000 2001 2002 2003 2004 2005 2006 2007 2008 2009 2010
27
FIGURE 3.D
Source: DPT Database
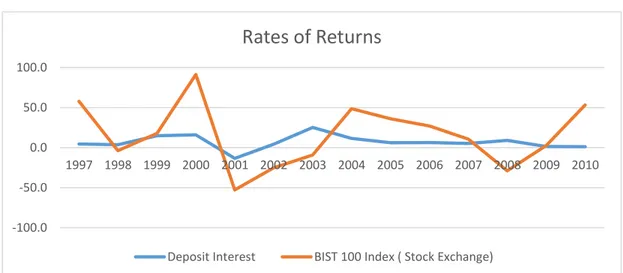
Another attractive sector for foreigners in Turkey is financial markets. As depicted in previous sections, Turkey’s financial environment offers high returns to investors. In figure 3. E, the rates of profits created by means of financial investment is demonstrated. The returns for stocks are substantially high compared to the interest income on deposits. The volatility of the stocks returns is higher than Turkish Lira deposits. The susceptibility of the market just after the crises, makes Turkey an open market for foreign entry by acquisitions of the stocks of major companies.
FIGURE 3.E Source: http://www.tuik.gov.tr/PreTablo.do?alt_id=1064 0 200,000 400,000 600,000 800,000 1,000,000 1,200,000 1,400,000 2000 2001 2002 2003 2004 2005 2006 2007 2008 2009 2010
AUTOMATIVE INDUSTRY PRODUCTION
-100.0 -50.0 0.0 50.0 100.0 1997 1998 1999 2000 2001 2002 2003 2004 2005 2006 2007 2008 2009 2010
Rates of Returns
28
3) DATA AND EMPIRICAL RESULTS I. ECONOMIC GROWTH- LS METHOD
The data covers the period for Turkey from 1989-2010 and the aim of the analysis is to observe the effect of the financial market development and foreign direct investment in GDP, as an indicator of economic growth. Parameters such as stock market capitalization, private credit to business sectors, stock turnover, and stocks trade volume in the market are used as an indicator of the financial market development. The information of stock market values is from Global Financial Statistics database and banking sector indicators are pulled from the DPT database. To proxy the trade openness, overall foreign trade volume is used. Foreign direct investment volume and foreign trade volume are also drawn from the DPT database and those are employed as macroeconomic variables of the model. The model’s dependent variable is gross domestic product and data is taken from World Bank’s database.
In this subsection, Least Squares Method is run to analyze the relation between the independent variables and dependent variable. The model’s appropriateness and the significance of the instrumental tools are checked with respect to the regression output.
Our linear regression model is: Y =β 0 + β 1X 1 + β2X2 +β3X3+ β4X4 + β5X5 + β6X6 such as;
Y is the dependent variable representing GDP, β 0 is the constant term,
X are variables stand for, foreign direct investment in a year, private credits that are issued by commercial, investment and developing banks to business sector, stock market capitalization, stock market turnover, total volume of stocks traded and trade volume.
29
Initially, to see whether the time series of the variables are stationary or not, unit root test is performed. The results of the Augmented Dickey-Fuller test is as below; TABLE 1.A AUGMENTED DICKEY-FULLER TEST STATISTICS GDP PRIVATE CREDIT FDI At Level Test Statistic -1.103.634 0.557661 1.152.782 Probability 0.9042 0,9987 0.9997 At First Difference Test Statistic -4.934.533 -4.062.357 -4.117.337 Probability 0,0042* 0,0234* 0.0245*
*denotes the rejection of Null hypothesis that there is unit root.
AUGMENTED
DICKEY-FULLER TEST STATISTICS STMCAP STOTOV TRDVOL
VOLTRAD At Level Test Statistic 1.688073 -2.957592 0.152057 1.995344 Probability 0.9990 0.0556 0.9621 0.9996 At First Difference Test Statistic -4.064685 -7.076110 -5.158606 -4.221281 Probability 0,0058* 0,0000* 0.0006* 0.0041*
Statistics output tell that the variables are non-stationary at level. As the first differenced are taken, they become stationary. While applying LS method in this section, first differenced values of the time series are used.
30
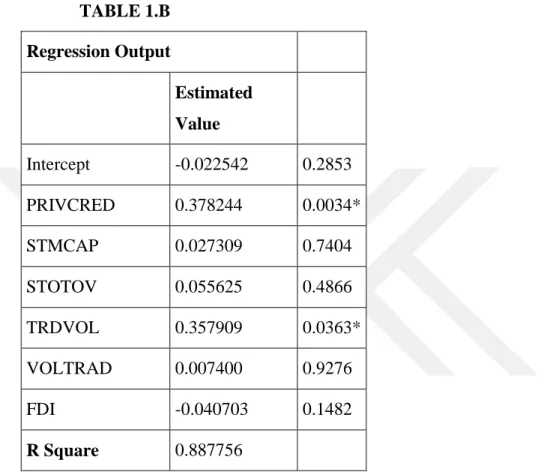
Regression output is;
TABLE 1.B Regression Output Estimated Value Intercept -0.022542 0.2853 PRIVCRED 0.378244 0.0034* STMCAP 0.027309 0.7404 STOTOV 0.055625 0.4866 TRDVOL 0.357909 0.0363* VOLTRAD 0.007400 0.9276 FDI -0.040703 0.1482 R Square 0.887756
Test statistics present that FDI has p-value, 0.1482- it doesn’t have a significant impact on country’s GDP. Stocks volume traded, TRDVOL, is significant at 5% significance level. Private credits issued (PRIVCRED) is significant too. The signs of these coefficients are compatible with the literature findings of this study. However, both of these parameters’ effects appear to be very high on GDP. Financial market is a newly developing market in Turkey and its share in the economy increases recently, as well. That’s why, the results of the estimation brings question marks about the exact amount of these effects. This result can be because of some omitted variables in the model. Foreign direct investment is not significant, besides its sign is negative. It shows a negative relation with FDI and GDP. Negative relationship is not consistent with the economic findings. It’s found out that financial
31
market development and trade volume of the country positively affect the total output. Whereas, these estimators are not significant to be taken into consideration.
Model gives us a high R-squared level and also the F statistics probability is very low. Jointly, they show that the model and the variables are good to explain the change in gross domestic product.
Finally, for this model, the residuals are checked. And the test results are; TABLE 1.C
Heteroskedasticity Test: Breusch-Pagan-Godfrey
F-statistic 0.196387 Prob. F(6,15) 0.9728
Obs*R-squared 1.602336 Prob. Chi-Square(6) 0.9524 Scaled explained SS 0.472311 Prob. Chi-Square(6) 0.9982
Null hypothesis: There is homoskedasticity,
Alternative hypothesis: There is heteroskedasticity.
With the Chi-Square(6) probability level, 0.9524, we fail to reject the null hypothesis. There is no heteroskedasticity, means that error term do not differ for different values of independent variables.
TABLE 1.D
Breusch-Godfrey Serial Correlation LM Test:
F-statistic 1.035886 Prob. F(4,11) 0.4317
Obs*R-squared 6.019595 Prob. Chi-Square(4) 0.1977
Null hypothesis: There is no serial correlation, Alternative hypothesis: There is heteroskedasticity.
32
With the Chi-Square(6) probability level, 0.1977, we fail to reject the null hypothesis. There is no serial correlation.
For another measure of serial correlation, Colleogram can be checked as below. Null hypothesis: There is no serial correlation,
Alternative hypothesis: There is serial correlation.
With all the probability levels that are higher than 0.05, the null hypothesis cannot be rejected. There is no serial correlation.
TABLE 1.E
Sample: 1989 2010 Included observations: 22
Autocorrelation Partial Correlation AC PAC Q-Stat Prob . | . | . | . | 1 -0.033 -0.033 0.0281 0.867 . *| . | . *| . | 2 -0.082 -0.083 0.2050 0.903 .**| . | .**| . | 3 -0.232 -0.240 1.7024 0.636 .**| . | .**| . | 4 -0.261 -0.310 3.7019 0.448 . |* . | . |* . | 5 0.200 0.127 4.9497 0.422 . | . | . *| . | 6 -0.039 -0.143 4.9994 0.544 . | . | . *| . | 7 0.025 -0.111 5.0212 0.657 . | . | . | . | 8 -0.020 -0.050 5.0356 0.754 . *| . | . *| . | 9 -0.128 -0.117 5.7062 0.769 . *| . | .**| . | 10 -0.118 -0.300 6.3230 0.787 . *| . | .**| . | 11 -0.085 -0.225 6.6695 0.825 . |* . | . *| . | 12 0.075 -0.140 6.9655 0.860
33
Lastly, normality of the residuals distribution is detected and as it can be seen from the graph, the residuals are normally distributed. Also, p-value, 0,764, higher than 0.05, supports that null hypothesis, the residuals are normally distributed, cannot be rejected. FIGURE 4.A 0 1 2 3 4 5 -30000 -20000 -10000 0 10000 20000 30000 Series: Residuals Sample 1989 2010 Observations 22 Mean -1.37e-11 Median 438.3495 Maximum 33012.93 Minimum -26459.35 Std. Dev. 16227.24 Skewness 0.113111 Kurtosis 2.268140 Jarque-Bera 0.537895 Probability 0.764183
II. ECONOMIC GROWTH AND VAR MODEL
Since multivariate time series is worked on, it is more efficient to use VAR model. In this part of the study, the statistics of the VAR model is observed. In this model, GDP, FDI, private credits that are issued to private sector, stocks volume traded, trade volume, stocks turnover and stock market capitalization are the variables and their causality and cointegration are checked. Since it is necessary for all variables to be stationary to use VAR model, first differences of the time series of the variables are taken.
34
When the system is established for the VAR model, ordinary least squares is applied to estimate the equation.
Estimated equation of VAR model is as;
D(LOG(GDP)) = C(1)*D(LOG(GDP(-1))) + C(2)*D(LOG(GDP(-2))) + C(3)*D(LOG(FDI(-1))) + C(4)*D(LOG(FDI(-2))) + C(5) + C(6)*D(LOG(STMCAP)) + C(7)*D(LOG(STOTOV)) + C(8)*D(LOG(TRDVOL)) + C(9)*D(LOG(VOLTRAD)) + C(10)*D(LOG(PRIVCRED))
Estimation output of the equation is as below; TABLE 2.A
Estimation Output of VAR Model
Coefficient Prob. C(1) -0.178312 0.2707 C(2) -0.039907 0.7838 C(3) 0.007848 0.7950 C(4) 0.002818 0.9079 C(5) 0.006215 0.8355 C(6) 0.086075 0.3054 C(7) 0.091494 0.4030 C(8) 0.389723 0.1064 C(9) -0.208899 0.1161 C(10) 0.418880 0.0055* R-squared 0.917636
35
VAR model estimates that there is not a significant relationship among growth rate and foreign direct investment and financial market growth indexes, except private credits. Around 3 unit increase in private credits to business sector increases growth rate 1 unit. That seems quite high when the real values are checked, this influence doesn’t appear to be reasonable since the private credits share in total GDP is still not too big to effect it that much. With R-squared 0.91, model has a high degree of verification.
To check the validity of the model, LM test is run. With chi square(4), null hypothesis cannot be rejected. That’s; there is no serial correlation among error terms. To analyze the normality of the model, normality test and autocorrelation tests are run.
Chi-square(2) probability level, 0.135, causes not to reject the null hypothesis: residuals are normally distributed.
According to the results of Residual Portmanteau Tests for Autocorrelation, null hypothesis: There is no residual autocorrelations, cannot be rejected.
Tests performed to analyze the normality of the model are successful to prove the normality of the residuals distribution.
Figure 5.A illustrate the impulse responses of output and FDI, respectively to the shocks to output and FDI. Output response to a shock in the output is decrease in the first year, following with increase in the second year and coming back to the primary position in the third year and so on. Output seems to respond to a shock in FDI with an increase between the first and second years. It stabilizes after the third year and doesn’t change later on. Foreign direct investment appears to increase with a shock in output from the first year until the third year. However it stabilizes after this time and do not give response to the shocks. Last figure shows the response of FDI to a shock in FDI. At first year, FDI tends to decrease dramatically.
In the second year there is a slight increase and it becomes stable beginning with the third year. Impulse response analysis demonstrates that except the slight
36
responses to the mutual shocks in the first two years, there is not a two-way causality between FDI and GDP. That’s consistent with the VAR system which also estimates non-significant relationship between them.
FIGURE 5.A
Impulse Response Graphs of GDP and FDI
-.04 .00 .04 .08 .12 1 2 3 4 5 6 7 8 9 10
Response of D(LOG(GDP)) to D(LOG(GDP))
-.04 .00 .04 .08 .12 1 2 3 4 5 6 7 8 9 10
Response of D(LOG(GDP)) to D(LOG(FDI))
-0.50 -0.25 0.00 0.25 0.50 0.75 1.00 1 2 3 4 5 6 7 8 9 10
Response of D(LOG(FDI)) to D(LOG(GDP))
-0.50 -0.25 0.00 0.25 0.50 0.75 1.00 1 2 3 4 5 6 7 8 9 10
Response of D(LOG(FDI)) to D(LOG(FDI))
Response to Cholesky One S.D. Innovations ± 2 S.E.
Share of foreign direct investment in Turkish economy is very low. This may be the reason of this insignificant causality between them and may explain why Turkey case is not like the other country cases that are successful to achieve an increase in their output by welcoming more foreign capital. However, this paper works contemporary data of Turkey. VAR system and impulse response functions
37
release that foreign direct investment is not powerful enough to make an important influence in country’s total output.
III. ECONOMIC GROWTH AND VECM MODEL
In the first section of the last part of this paper, Augmented Dickey Füller Test was run. According to the test results, the time series used for the analysis were all non-stationary. In this section, with the level values of the variables, VECM system will be analyzed. As in the VAR system, GDP and FDI are taken as endogenous variables and other determinants of financial development and trade volume are taken as exogenous variables.
Initially, the long run equilibrium model is brought out by Johansen cointegration test. Before that, it is necessary to select the lag length according to Akaike Information Criteria since AIC gets the lowest value at second lag.
When the Johansen Cointegration test is performed, the Trace and Eigenvalue results demonstrate that there is 1 cointegrating equation in these series.
TABLE 3.A
Unrestricted Cointegration Rank Test (Trace)
Hypothesized Trace 0.05
No. of CE(s) Eigenvalue Statistic Critical
Value Prob.* * None * 0.803114 3.129.213 1.549.471 0.0001 At most 1 0.021586 0.414628 3.841.466 0.5196
38
Trace test indicates 1 cointegrating eqn(s) at the 0.05 level
Unrestricted Cointegration Rank Test (Maximum Eigenvalue)
Hypothesized Max-Eigen 0.05
No. of CE(s) Eigenvalue Statistic Critical
Value Prob.* * None * 0.803114 3.087.750 1.426.460 0.0001 At most 1 0.021586 0.414628 3.841.466 0.5196 Max-eigenvalue test indicates 1 cointegrating eqn(s) at the
0.05 level
This shows that there is long run relationship among GDP and FDI. The test result also gives this long run relationship among these variables.
As there is cointegration among the variables, VECM can be run.
To analyse the VECM system, ordinary least squares method is used to make estimation. The short run equilibrium is drawn from the VECM output.
Estimation output is given as below;
D(LOG(GDP)) = C(1)*( LOG(GDP(-1)) + 0.0206601596582
*LOG(FDI(-1)) - 12.7913807016 ) + C(2)*D(LOG(GDP(-1))) + C(3) *D(LOG(GDP(-2))) + C(4)*D(LOG(FDI(-1))) + C(5)*D(LOG(FDI(-2))) + C(6) + C(7)*LOG(PRIVCRED) + C(8)*LOG(STMCAP) + C(9)
39
*LOG(STOTOV) + C(10)*LOG(TRDVOL) + C(11)*LOG(VOLTRAD)
D(LOG(GDP)) = C(1)*( LOG(GDP(-1)) + 0.0206601596582*LOG(FDI(-1)) - 12.7913807016 )
demonstrates the long run relationship between GDP and FDI.
C(2)*D(LOG(GDP(-1))) + C(3) *D(LOG(GDP(-2))) + C(4)*D(LOG(FDI(-1)))
+ C(5)*D(LOG(FDI(-2))) + C(6) + C(7)*LOG(PRIVCRED) + C(8)*LOG(STMCAP) + C(9) *LOG(STOTOV) + C(10)*LOG(TRDVOL) + C(11)*LOG(VOLTRAD)
demonstrates the short run relationship between GDP and FDI. The coefficients of the estmation are;
TABLE 3.B
Estimation Output of VECM Model
Coefficient Prob. C(1) -0.988169 0.0000* C(2) -0.143302 0.2095 C(3) -0.110620 0.4336 C(4) 0.018226 0.4654 C(5) -0.002671 0.9120
40 C(6) -8.085.122 0.0000* C(7) 0.254888 0.0167* C(8) 0.214620 0.1056 C(9) 0.074793 0.6036 C(10) 0.647049 0.0001* C(11) -0.368817 0.0214* R squared 0.941786
The speed of adjustment parameter, that’s c(1) should lie between 0 and -1. This is because this point estimate imply that growth converges to long run equilibrium. That’s how it can be concluded that there is a long run relationship between GDP and FDI. In addition, estimate output seems quite significant with R-squared level 0.9417. As we analyze the coefficients, it’s seen that changes in the output in the previous two years have negative effect on the current output. However, p values of C(2) and C(3) are high and these estimates are not significant. C(4) and C(5) are the coefficients of the foreign direct investment and there are not significant. To look for the short run causality of foreign direct investment, Granger Causality Test is performed Test. To see whether jointly C(4) and C(5) have influence on GDP, C(4)=C(5)=0 is tested as null hypothesis.
TABLE 3.C
Granger Causality Test
Dependent variable:
GDP
Excluded Chi-sq df Prob.
41
Table 3.C shows that FDI at lag1 and lag2 have no influence on GDP jointly. With p value=0.95, the null hypothesis cannot be rejected.
C(7) and C(10) have positive impacts on GDP in the short run and they are statistically significant. Private credits supplied for the business sectors and stocks traded in the market influence GDP in the same direction. That’s reasonable and consistent with this research findings also. Increasing trade numbers and investments redouble the country’s output. Whereas, the coefficients are quite big when the real values of these two parameters are taken into consideration. Real values are not high enough to cause the given influences by the estimation output. Lastly, C(11) as the estimator of trade volume in the economy is significant like the previous models. That’s a reasonable outcome economically since it’s expected a positive relationship and a significant causality between trade volume and output of the economy.
To search for the efficiency of this model, autocorrelation test and normality tests are given.
Normality test results reveals that residuals are normally distributed. With the Chi square(2) probability level, 0.5819, null hypothesis cannot be rejected.
To test autocorrelation between residuals Portmanteau Tests for Autocorrelation is performed. The outcome of the test probabilities with lag 12, shows that we cannot reject the null hypothesis: There is no autocorrelation between residuals.
Both tests verify the normality of the model analyzed above.
IV. CONCLUSION
From 1989, along with the measures taken for economic liberalization and opening the economy to foreign entry, the financial market of Turkey began to enlarge. The development of financial markets and the foreign capital accumulation may favor some developing economies. Literature shows that there are successful examples of this development such as Chile or China. This study investigates whether Turkey as a developing economy benefit from the new policies and liberalization