Strong Association Between Insulin-Mediated
Glucose Uptake and the 2-Hour, Not the Fasting
Plasma Glucose Concentration, in the Normal Glucose
Tolerance Range
Diedre Winnier, Luke Norton, Mustafa Kanat, Ruth Arya, Marcel Fourcaudot, Andrea Hansis-Diarte, Devjit Tripathy, Ralph A. DeFronzo, Christopher P. Jenkinson, and Muhammad Abdul-Ghani
Diabetes Division (D.W., L.N., R.A., M.F., A.H.-D., D.T., R.A.D., C.P.J., M.A.-G.), University of Texas Health Science Center at San Antonio, Texas 78229; and Division of Diabetes (M.K.), Istanbul Medipol University, 34810 Istanbul, Turkey
Aim: The aim of this study was to examine the relationship between whole-body insulin-mediated glucose disposal and the fasting plasma glucose concentration in nondiabetic individuals.
Research Design and Methods: Two hundred fifty-three nondiabetic subjects with normal glucose tolerance (NGT), impaired fasting glucose (IFG), impaired glucose tolerance, and combined glucose intolerance received a 75-g oral glucose tolerance test and euglycemic hyperinsulinemic clamp. Total glucose disposal (TGD) during the insulin clamp was compared in IFG and NGT individuals and was related to fasting and 2-hour plasma glucose concentrations in each group.
Results: TGD varied considerably between NGT and IFG individuals and displayed a strong inverse relationship with the 2-hour plasma glucose (PG; r⫽ 0.40, P ⬍ .0001) but not with the fasting PG. When IFG and NGT individuals were stratified based on their 2-hour PG concentration, the increase in 2-hour PG was associated with a progressive decrease in TGD in both groups, and the TGD was comparable among NGT and IFG individuals.
Conclusion: The present results indicate the following: 1) as in NGT, insulin-stimulated TGD varies considerably in IFG individuals; 2) the large variability in TGD in IFG and NGT individuals is related to the 2-hour PG concentration; and 3) after adjustment for the 2-hour proglucagon concentration, IFG subjects have comparable TGD with NGT individuals. (J Clin Endocrinol Metab 99: 3444 –3449, 2014)
I
solated impaired fasting glucose (IFG) [fasting plasma glucose (FPG)⫽ 100–125; 2 h plasma glucose (PG) ⬍ 140 mg/dL] and isolated impaired glucose tolerance (IGT) (2 h plasma glucose concentration ⫽ 140–199; FPG ⬍ 100 mg/dL) are intermediate states in the transition of glucose tolerance from normal to overt diabetes (1). Thus, both IFG and/or IGT are recognized as prediabetic states. Although IFG and IGT are associated with a similar in-creased future risk of type 2 diabetes mellitus (T2DM) (2, 3), we and others have shown that they represent two different clinical entities with distinct pathophysiologicabnormalities (4 –14). Subjects with IGT manifest skeletal muscle insulin resistance and a decrease in both first- and second-phase insulin secretion (4 –7, 9, 13), whereas sub-jects with IFG manifest normal muscle insulin sensitivity but impaired hepatic insulin sensitivity (4 –7) and im-paired first-phase insulin secretion with intact second-phase insulin secretion (5, 9, 13, 15, 16). Although the impairment in first-phase insulin secretion is a consistent finding in IFG individuals, controversy exists regarding muscle insulin resistance in IFG. Studies that have evalu-ated insulin resistance in IFG individuals using oral glu-ISSN Print 0021-972X ISSN Online 1945-7197
Printed in U.S.A.
Copyright © 2014 by the Endocrine Society Received July 17, 2013. Accepted April 28, 2014. First Published Online May 5, 2014
Abbreviations: BMI, body mass index; CGI, combined glucose intolerance; FPG, fasting plasma glucose; IFG, isolated impaired fasting glucose; IGT, impaired glucose tolerance; NGT, normal glucose tolerance; OGTT, oral glucose tolerance test; PG, plasma glucose; SSPI, steady-state plasma insulin concentration; T2DM, type 2 diabetes mellitus; TGD, total glucose disposal.
E n d o c r i n e R e s e a r c h
3444 jcem.endojournals.org J Clin Endocrinol Metab, September 2014, 99(9):3444 –3449 doi: 10.1210/jc.2013-2886
cose tolerance test (OGTT)-derived indices of insulin re-sistance, eg, Matsuda index and homeostasis model assessment index of insulin resistance, have reported in-creased insulin resistance in IFG individuals (8 –12). How-ever, studies that directly measured insulin-mediated glu-cose uptake with the insulin clamp technique have reported conflicting results (4 –7, 17, 18). Some studies have found similar rates of insulin-mediated glucose dis-posal in IFG to normal glucose tolerance (NGT) (4 –7), whereas others have reported a decreased insulin-medi-ated glucose disposal in IFG (17, 18). The reason for this inconsistency in whole-body insulin-mediated glucose dis-posal in IFG individuals is unclear. We previously reported that in nondiabetic individuals, the increase in 2-hour PG concentration is associated with a progressive decrease in the whole-body insulin-mediated glucose disposal and that the decrease in total glucose disposal (TGD) is present with 2-hour PG concentrations that are well within the normal range (ie,⬍ 140 mg/dL) (19). Therefore, we hy-pothesize that TGD varies in IFG individuals based on their 2-hour PG concentration. Thus, failing to match the 2-hour PG concentration between IFG vs NGT subjects could, at least in part, account for the inconsistencies in insulin-stimulated glucose disposal reported in the litera-ture. The aim of the present study is to test this hypothesis.
Subjects and Methods
Subjects
The participants included 253 nondiabetic Mexican Ameri-can subjects, who received a 75-g OGTT and had their insulin-stimulated TGD measured with the euglycemic insulin clamp. Based on the OGTT, the 253 subjects were classified according to American Diabetes Association criteria as having the follow-ing: 1) NGT (FPG⬍ 100 mg/ dL and 2 h glucose ⬍ 140 mg/dL, n⫽ 121); 2) IFG (FPG ⫽ 100–125 mg/ dL and 2 h glucose ⬍ 140 mg/dL, n⫽ 51); 3) IGT (FPG ⬍ 100 mg/ dL and 2 h PG ⫽ 140 –199 mg/dL, n⫽ 30); and 4) combined glucose intolerance (CGI; FPG⫽ 100–125 mg/ dL and 2 h PG ⫽ 140–199 mg/ dL, n⫽ 51).
All subjects had normal liver, cardiopulmonary, and kidney function as determined by medical history, physical examina-tion, screening blood tests, electrocardiogram, and urinalysis. No subject was taking any medication known to affect glucose tolerance. Body weight was stable (⫾2 kg) for at least 3 months before the study in all subjects. The study protocol was approved by the Institutional Review Board of the University of Texas Health Science Center San Antonio (San Antonio, Texas), and informed written consent was obtained from all subjects before their participation. All studies were performed at the General Clinical Research Center of the University of Texas Health Sci-ence Center at 8:00AMfollowing a 10- to 12-hour overnight fast.
Oral glucose tolerance test
Before the start of the OGTT, a small polyethylene catheter was placed into an antecubital vein and blood samples were collected at⫺30, ⫺15, and 0. Subjects then ingested 75 g of glucose, and blood samples were obtained at 30, 60, 90, and 120 minutes. Plasma glucose and insulin concentrations were measured on all blood samples. Euglycemic insulin clamp
Before the start of the insulin clamp, a primed (25 Ci)-continuous (0.25Ci/min) infusion of 3-[3H]glucose (Du-Pont NEN Life Science Products) was started and contin-ued to the end of the study. After a 2-hour basal tracer equilibration period, subjects received a prime-continuous (240 pmol/min⫺1䡠m⫺2) insulin infusion for 240 minutes. During the insulin infusion, plasma glucose concentration was measured every 5 minutes, and a variable infusion of 20% glucose was adjusted, based on the negative-feed-back principle, to maintain the plasma glucose concentra-tion at each subject’s fasting glucose level with a coefficient of variation less than 5%. Plasma samples were collected every 30 minutes from 0 to 180 minutes and every 5–10 minutes from 180 to 240 minutes for the determination of plasma glucose and insulin concentrations and tritiated glucose-specific activity.
Calculations and statistical analysis
The rate of glucose appearance during the last hour of the euglycemic clamp was calculated with Steele’s equa-tion, as previously described (4). The rate of residual en-dogenous glucose production during the insulin clamp was calculated by subtracting the rate of exogenous glu-cose infusion rate from the tracer-derived gluglu-cose appear-ance. The insulin-stimulated rate of TGD was calculated by adding the rate of residual endogenous glucose pro-duction to the exogenous glucose infusion rate.
Values are expressed as mean⫾ SEM. An ANOVA was used to compare the mean of more than two groups. Sim-ple Pearson’s correlation was used to assess the correlation between two variables. To evaluate the change in TGD associated with the change in the fasting vs 2-hour PG concentration, we created a linear regression model with the TGD as the dependent variable and the fasting or 2-hour PG concentration as the independent variable. Age, gender, body mass index (BMI), and the steady-state plasma insulin concentration during the last hour of the clamp were included as independent variables.
Results
Table 1 presents the clinical and metabolic characteristics of the study participants. Subjects with IFG had
rable TGD compared with NGT individuals, whereas the TGD was markedly reduced in the IGT and CGI groups. TGD varied considerably in both IFG and NGT individ-uals. When subjects in each group were stratified into four quartiles based on the level of TGD, the most sensitive quartile in the NGT group had 4-fold greater TGD com-pared with the most resistant quartile (10.9 vs 2.7 mg/ kg䡠min). Likewise, subjects in the most sensitive quartile in the IFG group had an approximately 3-fold greater TGD compared with subjects in the most resistant quartile (9.8 vs 3.5 mg/kg䡠min). Moreover, the level of TGD in each quartile in IFG individuals was comparable with their counterpart in the NGT group (Figure 1), despite the fact that IFG subjects in each quartile had a 12–16 mg/dL greater FPG concentration compared with their NGT counterparts. When IFG and NGT subjects were pooled into one group, the TGD did not correlate with the FPG concentration (Figure 2A). However, there was a strong inverse correlation between TGD and the 2-hour PG con-centration (r⫽ 0.40, P ⬍ .0001) (Figure 2B).
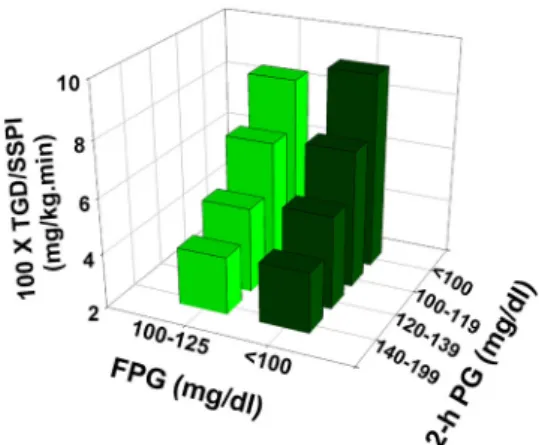
To examine the contribution of variation in the 2-hour PG concentration to the variability in insulin-stimulated TGD, we divided individuals in the NGT and IFG groups
into three subgroups based on their 2-hour-PG concen-tration (2 h PG⬍ 100, 100–119, 120–139 mg/dL) and compared the TGD in each group with that in subjects with the 2-hour PG concentration of 140 –199 mg/dL. Figure 3 demonstrates that in both IFG and NGT individ-uals, insulin-stimulated TGD progressively decreased as the 2-hour PG concentration increased. Moreover, in each subgroup, TGD was comparable in IFG and NGT indi-viduals. Furthermore, subjects with IGT and CGI had a further decrease in the insulin-stimulated TGD despite a FPG concentration that was comparable with the NGT and IFG individuals, respectively.
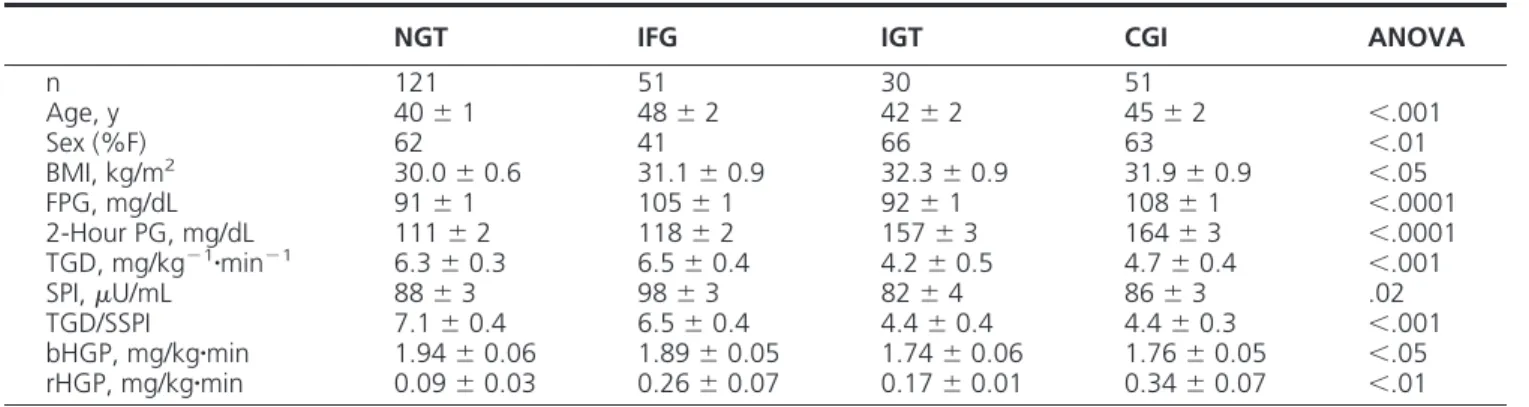
Table 1. Characteristics of the Study Participants
NGT IFG IGT CGI ANOVA
n 121 51 30 51 Age, y 40⫾ 1 48⫾ 2 42⫾ 2 45⫾ 2 ⬍.001 Sex (%F) 62 41 66 63 ⬍.01 BMI, kg/m2 30.0⫾ 0.6 31.1⫾ 0.9 32.3⫾ 0.9 31.9⫾ 0.9 ⬍.05 FPG, mg/dL 91⫾ 1 105⫾ 1 92⫾ 1 108⫾ 1 ⬍.0001 2-Hour PG, mg/dL 111⫾ 2 118⫾ 2 157⫾ 3 164⫾ 3 ⬍.0001 TGD, mg/kg⫺1䡠min⫺1 6.3⫾ 0.3 6.5⫾ 0.4 4.2⫾ 0.5 4.7⫾ 0.4 ⬍.001 SPI,U/mL 88⫾ 3 98⫾ 3 82⫾ 4 86⫾ 3 .02 TGD/SSPI 7.1⫾ 0.4 6.5⫾ 0.4 4.4⫾ 0.4 4.4⫾ 0.3 ⬍.001 bHGP, mg/kg䡠min 1.94⫾ 0.06 1.89⫾ 0.05 1.74⫾ 0.06 1.76⫾ 0.05 ⬍.05 rHGP, mg/kg䡠min 0.09⫾ 0.03 0.26⫾ 0.07 0.17⫾ 0.01 0.34⫾ 0.07 ⬍.01
Abbreviations: HGP, hepatic glucose production; rHGP, residual HGP; bHGP, basal HGP; SSPJ, steady state plasma insulin. Value represents the mean⫾ SEM.
Figure 1. Stratification of NGT and IFG individuals by quartiles (Q) based on their level of insulin-mediated glucose disposal measured with the insulin clamp. The FPG concentration in each quartile is displayed at the bottom.
Figure 2. Relationship between insulin-mediated glucose disposal measured with the insulin clamp and the fasting (A) and 2-hour plasma glucose total body (B) concentration in subjects with NGT and IFG.
To further examine the contribution of 2-hour PG vs FPG concentration to the variability in TGD, we created a multiple linear regression model with TGD as the de-pendent variable and FPG and 2-hour PG concentrations as independent variables. After adjustment for age, gen-der, BMI, and steady-state plasma insulin concentration (SSPI) during the last hour of the clamp, only SSPI, BMI, and the 2-hour PG concentration were significant inde-pendent predictors of insulin-stimulated TGD (Table 2), and this model explained 50% of the variance in TGD. Each 10 mg/dL increase in 2-hour PG concentration was associated with 0.423 mg/kg䡠min decrease in TGD. Con-versely, a 5 mg/dL increase in the FPG concentration was associated with a small (0.08 mg/kg䡠min), nonsignificant increase in TGD.
Discussion
The present results demonstrate that, in both NGT and IFG individuals, insulin-stimulated TGD, measured with the euglycemic insulin clamp, is strongly and inversely re-lated to the 2-hour PG concentration and has no signifi-cant correlation with the FPG concentration (Figure 2). Each 10 mg/dL increase in 2-hour PG concentration is associated with 0.42 mg/kg䡠min decrease in TGD. Because most glucose disposal during the euglycemic insulin clamp
takes place in skeletal muscle, this observation indicates that impaired insulin-mediated glucose disposal in skeletal muscle, ie, muscle insulin resistance, is strongly related to the increase in 2-hour PG concentration, and this rela-tionship is independent of the FPG concentration. Indeed, all studies that quantitated insulin-mediated TGD in IGT individuals consistently have documented a marked de-crease compared with NGT subjects (4 –7, 9, 13). The lack of correlation between the FPG and TGD can be explained by the fact that the fasting plasma glucose level is deter-mined by the balance between the rate of basal hepatic glucose production and the basal rate of tissue glucose uptake (20), which primarily takes place in insulin insen-sitive tissues, eg, brain and splanchnic tissue. Therefore, it is not surprising that the level of insulin-mediated glucose uptake is unrelated to the FPG concentration.
Consistent with previous studies (21, 22), the present study results demonstrate that NGT subjects have consid-erable variability in skeletal muscle insulin sensitivity. Our results also demonstrate that a similar variability in insu-lin-stimulated TGD also is present in IFG individuals (Fig-ure 1). However, when subjects with IFG and NGT are matched for their 2-hour PG concentration (Figure 3), TGD was very similar despite a 12- to 15-mg/dL difference in FPG level, indicating that the increase in FPG per se is not associated with reduced insulin sensitivity in skeletal muscle. Conversely, an increase in 2-hour PG concentra-tion that is considered to be well within the normal range (⬍140 mg/ dL) was associated with a marked and similar decrease in insulin-stimulated TGD in both NGT and IFG individuals. Thus, an NGT subject with a 2-hour PG con-centration between 100 and 119 mg/dL (which is within the range considered to represent NGT) had a 28% de-crease (from 8.53 to 6.2 mg/kg䡠min) in TGD compared with subjects with a 2-hour PG concentration less than 100 mg/ dL. Similarly, IFG individuals with a 2-hour PG concentration between 100 and 119 dL had a 24% de-crease (from 9.0 to 6.8 mg/kg䡠min) in TGD compared with IFG subjects with a 2-hour PG concentration⬍ 100 mg/dl. Thus, much of the inconsistency regarding skeletal muscle insulin sensitivity in IFG subjects can be explained by dif-ferences in the 2-hour PG concentration between the IFG and NGT groups. Indeed, the two studies that have re-ported decreased insulin-mediated TGD in IFG vs NGT individuals included IFG individuals with a significantly greater 2-hour PG concentration compared with NGT subjects (15 and 34 mg/dL) (17, 18).
The present results demonstrate that such a difference in the 2-hour-PG concentration between the two groups could account for an 11% and 25% decrease in TGD in IFG individuals independent of the FPG level. Insulin re-Figure 3. Insulin-mediated total body glucose disposal measured with
the insulin clamp in NGT, IFG, IGT, and CGI individuals stratified based on the level of the 2-hour plasma glucose concentration.
Table 2. Parameters of Multiple Linear Regression Model
Variable Standardized P Value
Age, y ⫺.099 .13
Gender, male vs female .015 .81
BMI, kg/m2 ⫺.55 ⬍.0001
SSPI,U/mL .377 ⬍.0001
FPG, mg/dL .046 .53
2-Hour PG concentration ⫺.33 ⬍.0001
sistance is a core defect in T2DM and the presence of insulin resistance is an independent predictor of future T2DM risk (23). The results of the present study demon-strate that insulin resistance in NGT and prediabetic in-dividuals (IGT and IFG) is related to the 2-hour PG con-centration and not to the FPG concon-centration. Increased future T2DM risk in IFG compared with NGT individuals is therefore most likely explained by the strong correlation between the FPG and 2-hour PG concentrations. In the present study, the correlation between the FPG and 2-hour PG concentration was 0.39 (P⬍ .0001). Consistent with this hypothesis, we previously have shown that when IFG and NGT subjects are matched for their postprandial plasma glucose concentration level, they have similar fu-ture T2DM risk (24). Moreover, NGT individuals with higher postprandial plasma glucose levels had a signifi-cantly greater T2DM risk compared with IFG individuals with a lower postprandial plasma glucose concentration (25). Collectively these results demonstrate that the in-crease in 2-hour PG concentration indicates insulin resis-tance in skeletal muscle and thus serves as a risk factor of future T2DM risk independent of the FPG concentration. In conclusion, the results of the present study demon-strate that insulin-mediated glucose uptake measured with the insulin clamp, which represent insulin sensitivity in skeletal muscle, correlates with the 2-hour plasma glucose concentration during the OGTT, not with the FPG con-centration, in the nondiabetic range, and this relationship is a continuum. Therefore, the 2-hour plasma glucose, not the FPG, represents a marker of insulin resistance in skel-etal muscle in nondiabetic individuals.
Acknowledgments
Address all correspondence and requests for reprints to: Muham-mad A. Abdul-Ghani, MD, PhD, Diabetes Division, University of Texas Health Science Center, 7703 Floyd Curl Drive, MSC 7886, San Antonio, TX 78229. E-mail:[email protected].
This work was supported in part by National Institutes of Health Grants DK097554 – 01 (to M.A.-G.), DK079195 (to C.P.J.), and DK24092 (to R.A.D.) and a Veterans Affairs merit grant (to C.P.J.).
Disclosure Summary: The authors have nothing to declare.
References
1. Expert Committee on the Diagnosis and Classification of Diabetes Mellitus. Report of the Expert Committee on the Diagnosis and Classification of Diabetes Mellitus. Diabetes Care. 1997;20:1183– 1197.
2. Unwin N, Shaw J, Zimmet P, Alberti KGMM. Impaired glucose tolerance and impaired fasting glycemia: the current status on def-inition and intervention. Diabet Med. 2002;19:708 –723.
3. Gerstein HC, Santaguida P, Raina P, et al. Annual incidence and relative risk of diabetes in people with various categories of dysgly-cemia: a systematic overview and meta-analysis of prospective stud-ies. Diabetes Res Clin Pract. 2007;78:305–312.
4. Abdul-Ghani MA, Jenkinson CP, Richardson DK, Tripathy D, De-Fronzo RA. Insulin secretion and action in subjects with impaired fasting glucose and impaired glucose tolerance: results from the Vet-erans Administration Genetic Epidemiology Study. Diabetes. 2006; 55:1430 –1435.
5. Meyer C, Pimenta W, Woerle HJ, et al. Different mechanisms for impaired fasting glucose and impaired postprandial glucose toler-ance in humans. Diabetes Care. 2006;29:1909 –1914.
6. Wasada T, Kuroki H, Katsumori K, Arii H, Sato A, Aoki K. Who are more insulin resistant people with IFG or people with IGT? Diabe-tologia. 2004;47:758 –759.
7. Faerch K, Vaag A, Holst JJ, Glümer C, Pedersen O, Borch-Johnsen K. Impaired fasting glycaemia vs impaired glucose tolerance: similar impairment of pancreatic␣ and  cell function but differential roles of incretin hormones and insulin action. Diabetologia. 2008;51: 853– 861.
8. Piche ME, Despres JP, Pascot A, et al. Impaired fasting glucose vs glucose intolerance in pre-menopausal women: distinct metabolic entities and cardiovascular disease risk? Diabet Med. 2004;21:730 – 737.
9. Festa A, D’Agostino R Jr, Hanley AJ, Karter AJ, Saad MF, Haffner SM. Differences in insulin resistance in nondiabetic subjects with isolated impaired glucose tolerance or isolated impaired fasting glu-cose. Diabetes. 2004;53:1549 –1555.
10. Hanefeld M, Koehler C, Fuecker K, Henkel E, Schaper F, Te-melkova-Kurktschiev T. Insulin secretion and insulin sensitivity pat-tern is different in isolated impaired glucose tolerance and impaired fasting glucose: the risk factor in Impaired Glucose Tolerance for Atherosclerosis and Diabetes study. Diabetes Care. 2003;26:868 – 874.
11. Carnevale Schianca GP, Rossi A, Sainaghi PP, Maduli E, Bartoli E. The significance of impaired fasting glucose versus impaired glucose tolerance: importance of insulin secretion and resistance. Diabetes Care. 2003;26:1333–1337.
12. Snehalatha C, Ramachandran A, Sivasankari S, Satyavani K, Vijay V. Insulin secretion and action show differences in impaired fasting glucose and in impaired glucose tolerance in Asian Indians. Diabetes Metab Res Rev. 2003;19:329 –332.
13. Weyer C, Bogardus C, Pratley RE. Metabolic characteristics of in-dividuals with impaired fasting glucose and/or impaired glucose tol-erance. Diabetes. 1999;48:2197–2203.
14. Davies MJ, Raymond NT, Day JL, Hales CN, Burden AC. Impaired glucose tolerance and fasting hyperglycaemia have different char-acteristics. Diabet Med. 2000;17:433– 440.
15. Kanat M, Mari A, Norton L, et al. Distinct cell defects in impaired fasting glucose and impaired glucose tolerance. Diabetes. 2012;61: 447– 453.
16. Kanat M, Norton L, Winnier D, Jenkinson C, DeFronzo RA, Abdul-Ghani MA. Impaired early- but not late-phase insulin secretion in subjects with impaired fasting glucose. Acta Diabetol. 2011;48: 209 –217.
17. Kim SH, Reaven GM. Isolated impaired fasting glucose and periph-eral insulin sensitivity: not a simple relationship. Diabetes Care. 2008;31:347–352.
18. Bock G, Chittilapilly E, Basu R, et al. Contribution of hepatic and extrahepatic insulin resistance to the pathogenesis of impaired fast-ing glucose, role of increased rates of gluconeogenesis. Diabetes. 2007;56:1703–1711.
19. Abdul-Ghani MA, DeFronzo RA. Pathophysiology of prediabetes. Curr Diab Rep. 2009;9:193–199.
20. Jani R, Molina M, Matsuda M, et al. Decreased non-insulin-depen-dent glucose clearance contributes to the rise in fasting plasma glu-cose in the nondiabetic range. Diabetes Care. 2008;31:311–315.
21. Diamond MP, Thornton K, Connolly-Diamond M, Sherwin RS, DeFronzo RA. Reciprocal variations in insulin-stimulated glucose uptake and pancreatic insulin secretion in women with normal glu-cose tolerance. J Soc Gynecol Invest. 1995;2:708 –715.
22. Yeni-Komshian H, Carantoni M, Abbasi F, Reaven GM. Relation-ship between several surrogate estimates of insulin resistance and quantification of insulin-mediated glucose disposal in 490 healthy nondiabetic volunteers. Diabetes Care. 2000;23:171–175. 23. Abdul-Ghani MA, Williams K, DeFronzo RA, Stern M. What is the
best predictor of future type 2 diabetes? Diabetes Care. 2007;30: 1544 –1548.
24. Abdul-Ghani MA, Stern MP, Lyssenko V, Tuomi T, Groop L, De-Fronzo RA. Minimal contribution of fasting hyperglycemia to the incidence of T2DM in subjects with normal 2 hour plasma glucose. Diabetes Care. 2010;33:557–561.
25. Abdul-Ghani MA, Lyssenko V, Tuomi T, DeFronzo RA, Groop L. The shape of plasma glucose concentration curve during OGTT predicts future risk of type 2 diabetes. Diab Metab Res Rev. 2010; 26:280 –286.