DELAY-BOUNDED RATE ADAPTIVE SHAPER FOR
TCP TRAFFIC IN DIFFSERV INTERNET
a thesis
submitted to the department of electrical and
electronics engineering
and the institute of engineering and sciences
of bilkent university
in partial fulfillment of the requirements
for the degree of
master of science
By
Yakup Balka¸s
September 2002
I certify that I have read this thesis and that in my opinion it is fully adequate, in scope and in quality, as a thesis for the degree of Master of Science.
Asst. Prof. Dr. Ezhan Kara¸san(Supervisor)
I certify that I have read this thesis and that in my opinion it is fully adequate, in scope and in quality, as a thesis for the degree of Master of Science.
Asst. Prof. Dr. Nail Akar
I certify that I have read this thesis and that in my opinion it is fully adequate, in scope and in quality, as a thesis for the degree of Master of Science.
Asst. Prof. Dr. ˙Ibrahim K¨orpeo˘glu
Approved for the Institute of Engineering and Sciences:
Prof. Dr. Mehmet Baray
ABSTRACT
DELAY-BOUNDED RATE ADAPTIVE SHAPER FOR
TCP TRAFFIC IN DIFFSERV INTERNET
Yakup Balka¸s
M.S. in Electrical and Electronics Engineering
Supervisor: Asst. Prof. Dr. Ezhan Kara¸san
September 2002
Applications with different quality requirements set out the need for different Qualities of Service (QoS) to be provided in Internet. Differentiated Services (DiffServ) model is an architecture proposed to provide QoS in the Internet in a scalable way. Assured Forwarding Per Hop Behavior (AF PHB) is a QoS ser-vice class which provides a loss sensitive serser-vice. The DiffServ Serser-vice Provider (SP) delivers services to customers where traffic parameters are quantified in a Service Level Agreement (SLA). The incoming traffic from customers are policed in order to make sure that they meet the specifications in the SLA. The portion of traffic that is nonconformant with the SLA is not guaranteed to receive the service quality specified in the SLA. Shapers delay nonconformant packets in order to increase the ratio of traffic that is within the bounds specified in the SLA. If nonconformant traffic is tolerated in the SP network up to some extent, increasing the ratio of traffic that is complying with specifications in the SLA may lead to unnecessary delaying of packets and may decrease throughput. In this thesis, a shaper, called Delay-Bounded Rate-Adaptive Shaper (DBRAS), is introduced which tries to increase the ratio of traffic that conforms to the SLA
to incoming packets (shaping delay). By avoiding unnecessarily large shaping delays, it is shown that throughput is increased. In order to have the shaper to adapt to changes in network topology, traffic, and different propagation de-lays, an adjustment algorithm is proposed where the shaper dynamically adjusts
its Dmax value in order to increase throughput. The resulting shaper is called
Dynamic DBRAS (D-DBRAS). The heuristic adjustment algorithm is greedy in that it adapts the maximum shaping delay in the direction where throughput increases. Results obtained from simulations show that throughput of TCP in AF PHB shaped by D-DBRAS can be increased by up to 65% compared with unshaped traffic. Simulations are performed in order to analyze effects of pa-rameters such as propagation delay, buffer threshold levels, and offered traffic on the performance of D-DBRAS. It is also shown through simulations that by
using the adjustment algorithm, the maximum shaping delay, Dmax, converges
to regimes where throughput increases in response to changes in offered traffic. Keywords: DiffServ, AF PHB, TCP, shaper, delay bound, throughput
¨
OZET
FARKLILAS¸MIS¸ H˙IZMETLER ˙INTERNET˙I’NDE TCP
TRAFF˙I ˜
G˙I ˙IC
¸ ˙IN ¨
ONER˙ILEN BEKLETME S ¨
URES˙I SINIRLI
˙ILET˙IM HIZI UYUMLU D ¨UZENLEY˙IC˙I
Yakup Balka¸s
Elektrik ve Elektronik M¨
uhendisli˘gi B¨ol¨
um¨
u Y¨
uksek Lisans
Tez Y¨oneticisi: Yrd. Do¸c. Dr. Ezhan Kara¸san
Eyl¨
ul 2002
G¨un¨um¨uz ˙Internet’inde sa˜glanan farklı yeterlilik ko¸sullarına sahip i¸slemlerin
ya¸sadı˜gı sorunlar ˙Internet’te farklı ¨ozelliklere sahip hizmetler sunulmasını gerekli kılmaktadır. Farklıla¸smı¸s Hizmetler ˙Interneti bu ihtiyacı yaygınla¸sma sırasında
sorun ya¸samayacak bir bi¸cimde kar¸sılamayı ama¸clamaktadır. Sa˜glanması
planlanan S¸artlı Y¨onlendirilmeli A˜g Y¨onlendiricisi Hizmeti (AF PHB), paket kayıplarına duyarlı bir hizmet sunar. Bu ve bunun gibi hizmetleri, Farklıla¸smı¸s
Hizmetler Sa˜glayıcıları kullanıcılarına kullanım ve hizmet ¨ozelliklerinin ¨ol¸c¨ulebilir
yeterlilik ko¸sullarıyla belirtildi˜gi Hizmet ¨Ozellikleri S¨ozle¸smesi’ni (SLA)
imza-ladıktan sonra sunmaya ba¸slarlar. Kullanıcı trafi˜ginin SLA’da belirtilen kullanım
¨ozelliklerinin dı¸sında kalan b¨ol¨um¨u hizmetin belirlenmi¸s yeterlilik ko¸sullarından
mahrum bırakılabilir. D¨uzenleyici SLA’ya uygun olmayan paketleri bekleterek
trafi˜gin SLA’da belirtilen kullanım ko¸sullarına uygun olan b¨ol¨um¨un¨u arttırmaya
¸calı¸sır. E˜ger Farklıla¸smı¸s Hizmetler Sa˜glayıcısı, a˜gında, SLA’da belirtilen kul-lanım ¨ozellikleri dı¸sı trafi˜gin y¨onlendirilmesine belli sınırlar dahilinde izin
veri-yorsa, d¨uzenleyici paketleri bekleterek trafi˜gin veri ula¸stırma hızının daha y¨uksek
Bekletme S¨uresi Sınırlı ˙Iletim Hızı Uyumlu D¨uzenleyici (DBRAS) olarak
ad-landırılmı¸stır- trafi˜gin m¨umk¨un oldu˜gunca SLA’ya uygun hale getirilmesi i¸cin
¸calı¸sırken paket bekletme s¨uresini de belli bir ¨ust sınır de˜ger -ki bu de˜ger
Dmax olarak adlandırılmı¸stır- altında tutar. Gereksiz derecede y¨uksek
bek-letme s¨urelerinden ka¸cınarak yapılan d¨uzenlemenin veri ula¸stırma hızını arttırdı˜gı
g¨ozlenmi¸stir. A˜g mimarisi, trafi˜gin kullanım ¨ozellikleri veya paketlerin a˜gda
yayılma s¨uresinde olu¸sacak de˜gi¸sikliklerin DBRAS’ın, veri ula¸stırma hızına
yapaca˜gı katkıyı engellememesi i¸cin DBRAS’ın Dmax’ı veri ula¸stırma hızının
artı¸sını hedefleyerek de˜gi¸stirebilmesini sa˜glayan bir Dmax ayarlama algoritması
¨onerilmi¸stir. Ortaya ¸cıkan yeni d¨uzenleyiciye Dinamik DBRAS (D-DBRAS)
adı verilmi¸stir. ¨Onerilen bulu¸ssal algoritma a¸cg¨ozl¨u bir yakla¸sımla Dmax’ı veri
ula¸stırma hızını arttıracak y¨onde de˜gi¸stirir. Benzetim sonu¸cları D-DBRAS’ın,
TCP trafi˜ginin veri ula¸stırma hızını, d¨uzenlenmeyen bir trafi˜ginkine oranla
%65 arttırabilece˜gini g¨ostermi¸stir. Bunun yanında, paketlerin a˜gda yayılma
s¨uresi, a˜g arabelleklerinin sınır seviyeleri ve a˜gdaki trafik y¨uk¨u gibi
parame-trelerin D-DBRAS’ın verimini nasıl etkiledi˜gini incelemek i¸cin benzetimler de
yapılmı¸stır. A˜gdaki trafik y¨uk¨un¨un zaman i¸cinde de˜gi¸sti˜gi a˜glarda yapılan
ben-zetimler, bu de˜gi¸siklikler kar¸sısında D-DBRAS’ın, TCP trafi˜ginin veri ula¸stırma hızını arttırabildi˜gi rejimlerine yakınsama becerisini g¨ostermi¸stir.
Anahtar kelimeler: Farklıla¸smı¸s Hizmetler ˙Interneti, AF PHB, TCP, d˘uzenleyici,
ACKNOWLEDGMENTS
I gratefully thank my supervisor Asst. Prof. Dr. Ezhan Kara¸san for his super-vision, enlightening guidance, motivating patience, and improving suggestions throughout my graduate study and the development of this thesis.
I would like to thank Asst. Prof. Dr. Nail Akar for his invaluable contribu-tions to the initial phases of this thesis work and also for his helpful suggescontribu-tions on my thesis.
I would also like to thank Asst. Prof. Dr. ˙Ibrahim K¨orpeo˜glu for his helpful suggestions on my thesis.
Contents
1 Introduction 1
2 Differentiated Services Architecture 7
2.1 An Overview of DiffServ Model . . . 9
2.2 Per Hop Behavior Proposals . . . 13
2.2.1 Expedited Forwarding Per Hop Behavior . . . 14
2.2.2 Assured Forwarding Per Hop Behavior . . . 14
2.3 Active Queue Management Schema . . . 15
2.3.1 RED . . . 16
2.3.2 Variants of RED for AF PHB . . . 17
2.4 Proposed Marking Mechanisms . . . 18
2.4.1 Token Bucket Marker (TBM) . . . 18
2.4.2 Other Markers in the Literature . . . 18
2.5 Traffic Shapers . . . 19
2.5.2 Green Rate Adaptive Shaper (green RAS) . . . 21
2.5.3 Other Shaper Algorithms in the Literature . . . 22
2.6 Traffic Conditioner Proposals . . . 23
3 Delay-Bounded, Rate-Adaptive Shaper (DBRAS) 25 3.1 Required Capabilities . . . 25
3.2 DBRAS Design . . . 26
3.3 DBRAS Shaping Algorithm . . . 27
3.4 Performance Analysis of DBRAS . . . 31
3.4.1 Simulation Topology . . . 31
3.4.2 Simulation Results . . . 34
4 Dynamic DBRAS (D-DBRAS) 38 4.1 Required Capabilities . . . 38
4.2 Dmax Adaptation Algorithm . . . 39
4.3 Simulation Topology . . . 41
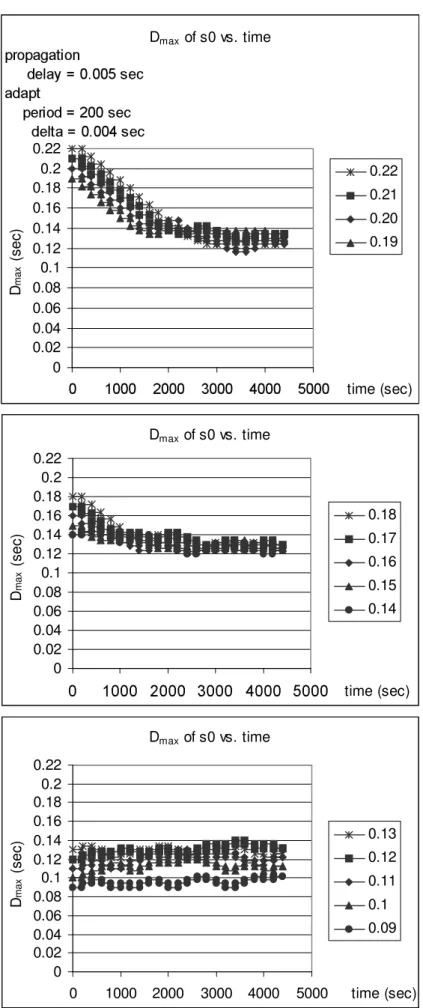
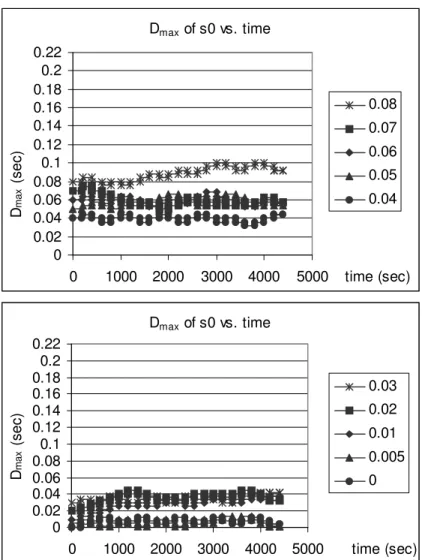
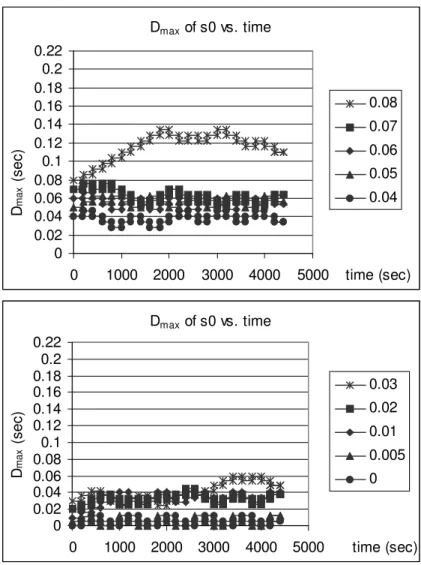
4.4 Simulation Results . . . 42
4.4.1 Selection of a Proper Value of δ . . . 43
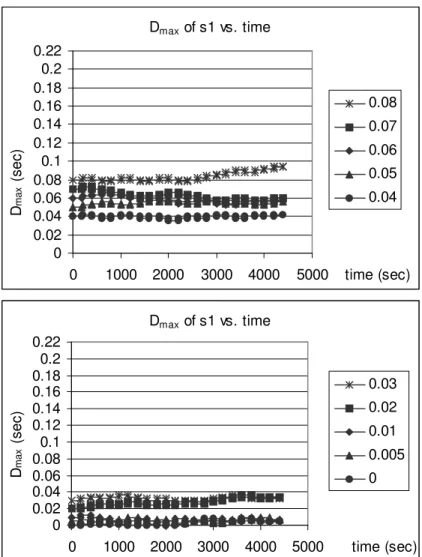
4.4.2 Effects of Some Parameters on Performance of D-DBRAS . 67 4.4.3 Dynamic Network Load Simulations . . . 83
List of Figures
2.1 A typical DiffServ SP network. . . 11
2.2 Ingress edge router internals. . . 12
2.3 Internals of a core router. . . 13
3.1 Design of the DBRAS. . . 27
3.2 Simulation Topology. . . 32
3.3 Simulations with PD = 20 msec. . . 35
3.4 Simulations with PD = 5 msec. . . 36
4.1 Simulation Topology for D-DBRAS. . . 41
4.2 Dmax of s0 vs. time with different initial Dmax values, δ = 0.8 msec. 44
4.3 Dmax of s0 vs. time with different initial Dmax values, δ = 2 msec. 45
4.4 Dmax of s0 vs. time with different initial Dmax values, δ = 4 msec. 46
4.5 Dmax of s0 vs. time with different initial Dmax values, δ = 6 msec. 47
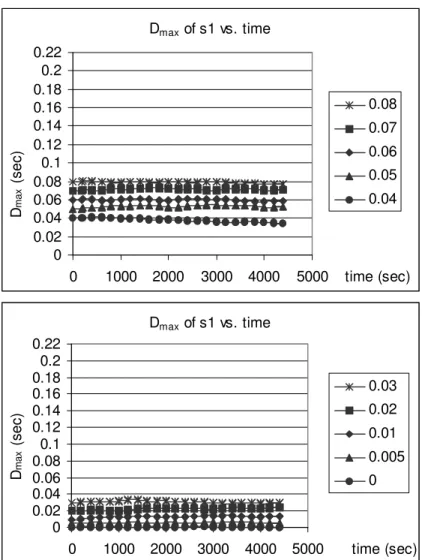
4.6 Dmax of s1 vs. time with different initial Dmax values, δ = 0.8 msec. 48
4.8 Dmax of s1 vs. time with different initial Dmax values, δ = 4 msec. 50
4.9 Dmax of s1 vs. time with different initial Dmax values, δ = 6 msec. 51
4.10 Dmax of s0 vs. time with different initial Dmax values, PD = 5
msec, δ = 0.8 msec. . . 52
4.11 Dmax of s0 vs. time with different initial Dmax values, PD = 5
msec, δ = 0.8 msec cont.’ed. . . 53
4.12 Dmax of s0 vs. time with different initial Dmax values, PD = 5
msec, δ = 2 msec. . . 54
4.13 Dmax of s0 vs. time with different initial Dmax values, PD = 5
msec, δ = 2 msec cont.’ed. . . 55
4.14 Dmax of s0 vs. time with different initial Dmax values, PD = 5
msec, δ = 4 msec. . . 56
4.15 Dmax of s0 vs. time with different initial Dmax values, PD = 5
msec, δ = 4 msec cont.’ed. . . 57
4.16 Dmax of s0 vs. time with different initial Dmax values, PD = 5
msec, δ = 6 msec. . . 58
4.17 Dmax of s0 vs. time with different initial Dmax values, PD = 5
msec, δ = 6 msec cont.’ed. . . 59
4.18 Dmax of s1 vs. time with different initial Dmax values, PD = 5
msec, δ = 0.8 msec. . . 60
4.19 Dmax of s1 vs. time with different initial Dmax values, PD = 5
4.20 Dmax of s1 vs. time with different initial Dmax values, PD = 5
msec, δ = 2 msec. . . 62
4.21 Dmax of s1 vs. time with different initial Dmax values, PD = 5 msec, δ = 2 msec cont.’ed. . . 63
4.22 Dmax of s1 vs. time with different initial Dmax values, PD = 5 msec, δ = 4 msec. . . 64
4.23 Dmax of s1 vs. time with different initial Dmax values, PD = 5 msec, δ = 4 msec cont.’ed. . . 65
4.24 Dmax of s1 vs. time with different initial Dmax values, PD = 5 msec, δ = 6 msec. . . 66
4.25 Dmax of s1 vs. time with different initial Dmax values, PD = 5 msec, δ = 6 msec cont.’ed. . . 67
4.26 Throughput vs. initial Dmax graph for PD = 20 msec case. . . 68
4.27 Throughput vs. initial Dmax graph for PD = 5 msec case. . . 69
4.28 Green ratio vs. initial Dmax for PD = 20 msec case. . . 70
4.29 Green ratio vs. time for PD = 5 msec case. . . 70
4.30 Throughput vs. initial Dmax, for the less-congested network and PD = 20 msec. . . 74
4.31 Throughput vs. initial Dmax, for the less-congested network and PD = 5 msec. . . 74
4.32 Green Ratio vs. initial Dmax, for the less-congested network and PD = 20 msec. . . 75
4.33 Green Ratio vs. initial Dmax, for less-congested network and PD
= 5 msec. . . 76
4.34 Network topology of 0s10u case. . . 77
4.35 Network topology of 10s0u case. . . 78
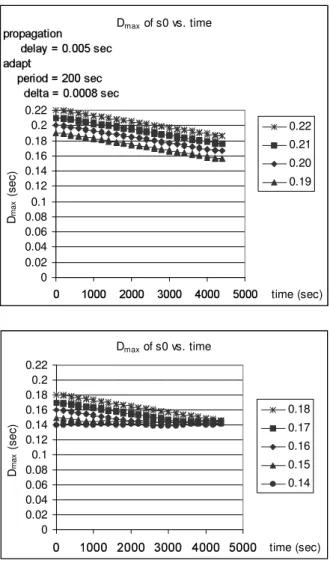
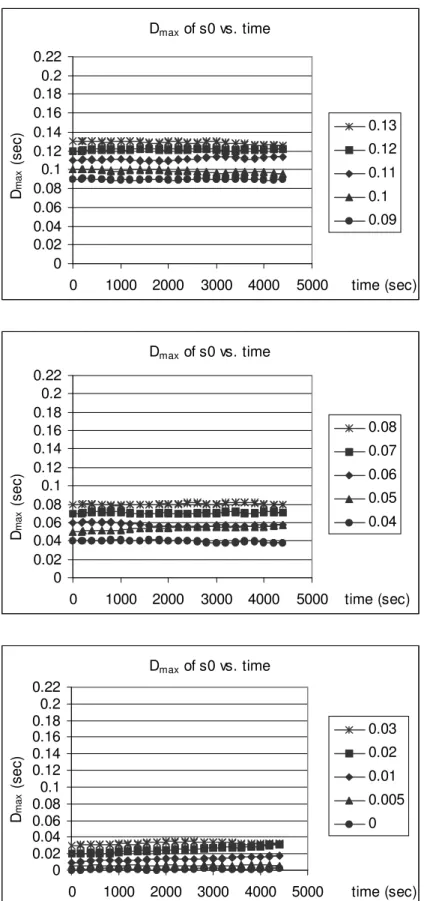
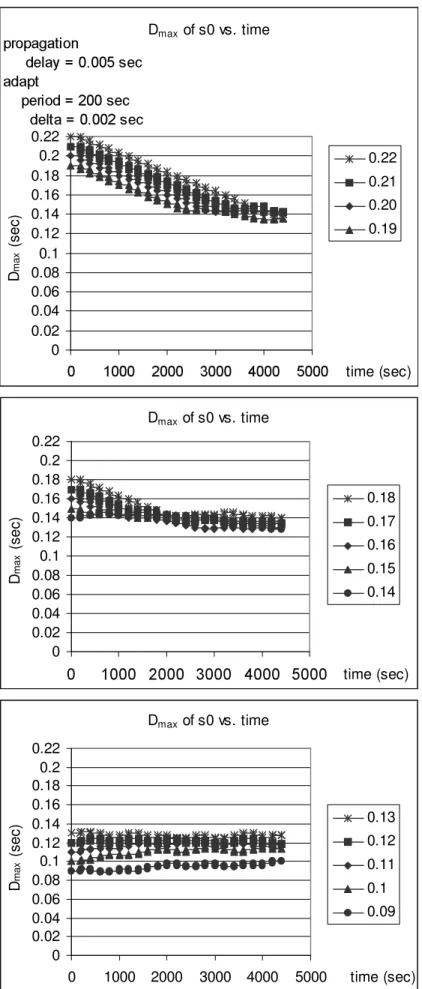
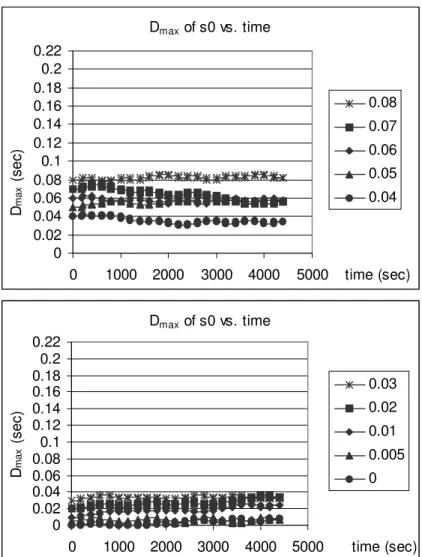
4.36 Dmax of s0 vs. time with different initial Dmax values, ap = 200 sec. 84
4.37 Throughput of s0 vs. time with different initial Dmax values, ap
= 200 sec. . . 85
4.38 Dmax of s0 vs. time with different initial Dmax values, ap = 100 sec. 86
4.39 Throughput of s0 vs. time with different initial Dmax values, ap
= 100 sec. . . 87
4.40 Dmax of s0 vs. time with different initial Dmax values, ap = 50 sec. 88
4.41 Throughput of s0 vs. time with different initial Dmax values, ap
= 50 sec. . . 89
4.42 Dmax of s0 vs. time with different initial Dmax values, ap = 25 sec. 90
4.43 Throughput of s0 vs. time with different initial Dmax values, ap
= 25 sec. . . 91
4.44 Dmax of D-DBRAS of s0 vs. time for dynamic network load Sce. 1. 93
4.45 Throughput of s0 vs. time for dynamic network load Sce. 1. . . . 94
4.46 Dmax of D-DBRAS of s0 vs. time for dynamic network load Sce. 2. 95
4.47 Throughput of s0 vs. time for dynamic network load Sce. 2. . . . 96
List of Tables
4.1 Actual TCP window size measurements. . . 71
4.2 End-to-end delay measurements (in msec). . . 71
4.3 Shaping delay measurements (in msec). . . 72
4.4 Dropping probability measurements. . . 72
4.5 Throughput levels achieved by different ratios of shaped traffic in the network (in Kbps). . . 79
4.6 Green ratios in topologies with different shaped traffic ratio in the network. . . 80
4.7 Throughput levels achieved with different RED parameter values (in Kbps). . . 81
4.8 Dropping probabilities at congested queue of networks with dif-ferent RED parameter values. . . 82
Chapter 1
Introduction
In its short history, the Internet has evolved in great scales. It was founded as a means of communication among colleagues in different universities and later more services are provided such as file transfer, remote access, e-mail, audio/video on-demand, and audio/video streaming applications. These applications have some similarities while they differ in some aspects. Differences arise from different requirements of these services. For example, file transfers typically last long and consist of a large number of packets each carrying a part that is vital for the concatenation of the file at the receiver. On the other hand, audio and video streaming applications require that packets are delivered in a timely fashion and that the variation of time interval between two consecutively received packets is bounded. If the requirements are re-stated in the Internet terms, file trans-fer applications require low packet loss rate, whereas real-time audio and video streaming applications require low delay and variation of delay (jitter).
To satisfy the needs stated above, some efforts on placing regulations regard-ing the transportation of application packets in the Internet are currently carried out. Initial efforts on this subject lead to definitions of a number of transport protocols. Transmission Control Protocol (TCP) was designed to satisfy low (or
no) packet loss. It overcomes the problem through establishing a connection between sender and receiver and making sure that receiver successfully receives packets in order and without loss. The establishment of a connection and re-liability mechanisms increase overhead. Also TCP has a mechanism to detect, respond to, and avoid congestion in the Internet. Congestion is the condition that queues of network are fed by traffic amount of which is higher than capacity and forwarding capabilities of queues. Basically, TCP decreases its packet send-ing rate when it detects a congestion. Then it increases its sendsend-ing rate until it encounters congestion again. Changes in sending rate of TCP increase delay and jitter. So, TCP is unable to satisfy the low delay and low jitter requirements. A group of transport protocols were used to answer requirements of real-time ap-plications. These protocols evolved from User Datagram Protocol (UDP) which aims to transmit packets as soon as possible, to save time. UDP does not provide any retransmission mechanism for recovering from packet losses. Instead, it is the responsibility of the application layer to support any form of reliability, if necessary.
TCP and UDP, as stated previously, have different considerations. This, how-ever, lead to some problems when they co-exist. UDP traffic affects TCP traffic adversely. While TCP aims to reduce congestion in the Internet by shaping, UDP traffic receives a larger share of network resources (queue occupancy, ratio of bandwidth used). As a result, TCP performance degrades when TCP and UDP share common network resources. This is referred to as the fairness prob-lem in the Internet. Some research has been done to avoid the unfair allocation of network resources among TCP and UDP traffic. There were two methods used for this purpose. In the first approach, UDP is proposed to have a congestion control mechanism similar to TCP. In the second approach, the architecture of Internet is proposed to be modified so that traffic with different quality require-ments, e.g. real-time audio/video streaming and data, are separated from each other. This way, Quality of Service (QoS) is introduced into the Internet. There
are two methods of embedding QoS into the Internet. In the first method, re-sources are reserved in the network in order to satisfy requirements of individual flows. This method is named the Integrated Services (IntServ) model. In the second model, the traffic using the Internet are classified according to their re-quirements into a small number of classes among which network resources are shared. This method is called the Differentiated Services (DiffServ) model. The fact that DiffServ reservations are done for a small number of aggregate traffic instead of individual flows as in the case of IntServ model makes DiffServ model superior over the IntServ model in terms of scalability.
DiffServ model classifies the network elements (nodes) into two categories: edge nodes and core nodes. In the edge, traffic is mapped to service classes and in the core, packets are served based on the service class they are assigned. In the DiffServ architecture, a service level agreement (SLA) specifies details of the service to be provided by Service Provider (SP) to the customer traffic. SLA specifies service parameters to be provided by the SP such as throughput (the amount of traffic received by receiver in unit time), burst size (the number of packets that can be sent consecutively), delay, jitter, and packet loss ratio (drop-ping probability). SLAs are typically negotiated between the customer and the SP before any service is initiated. At the node where customer traffic enters the SP network, policing of the traffic is performed by the SP to enforce SLA speci-fications. SP does not give any guarantee on the portion of traffic that does not confirm with SLA (called out-of-profile packets). For this reason, customers try to reduce the amount of nonconformant traffic using shapers which delay packets in order to decrease the number of out-of-profile packets. Delaying may require large buffer space in the shaper. Moreover, in networks where nonconformant traffic is tolerated to some extent, shaping may even decrease the throughput since excessive shaping generates unnecessarily large delays.
In this thesis, a shaper, called Delay-Bounded Rate Adaptive Shaper (DBRAS), is proposed which tries to reduce nonconformant packets while
obey-ing an upper-bound, Dmax, on the shaping delay which is defined as the time
interval between the time when all bytes of a packet are received and the time when all bytes of the the packet are sent downstream. This way, buffer space in the shaper can be limited and the decrease in the throughput due to unnec-essarily large shaping delays can be avoided. DBRAS is simulated to work in a network where resources are less than the amount of traffic using the network. Bursty traffic sources with identical distribution of packet generation and QoS requirements are used where some of the traffic streams are shaped while the remaining are unshaped. Numerical results show that average throughput of
shaped traffic can be increased up to 75% compared to unshaped traffic if Dmax
is chosen optimally. When the propagation delay in the network is changed, it
is observed that the optimum value for Dmax also changes even for the same
network topology and traffic sources. Also it is observed that the gain of shaping (ratio of average throughputs of shaped traffic and unshaped traffic with
statis-tically identical characteristics) makes two peaks as Dmax increases, i.e., there
are local maxima. Exceeding a certain Dmax value, measured throughput values
remain fixed at a value smaller than those two peaks no matter how much Dmax
is increased. This saturating value for Dmax increases when propagation delay
in the network is decreased.
The observation that the optimum value of Dmax varies for different
net-work topologies and traffic characteristics leads to Dynamic DBRAS (D-DBRAS)
where Dmax is adjusted periodically in order to increase throughput in response
to changing network conditions. D-DBRAS uses a greedy algorithm which
ad-justs Dmax in constant steps, δ, in a direction that increases the throughput of
TCP. If throughput measured in the current period is larger than the one
mea-sured in the previous period, then Dmax is applied the same change (increase or
in the opposite direction of the adjustment in the previous period. The shaper also keeps track of the ratio of nonconformant traffic and avoids the case when all packets satisfy specifications in SLA which was found to result in non-optimum
throughput. It is observed that in order to have convergence of Dmax in an
acceptable duration, the step size δ has to be determined appropriately.
With value of δ selected properly for convergence, simulations show that throughput for shaped traffic can be increased by 38-58% compared to unshaped
traffic depending on the initial value of Dmax. Hence, the cases where using
fixed nonoptimum value of Dmax that leads to loss of performance compared
to no shaping are completely eliminated by using D-DBRAS. When D-DBRAS is used, the ratio of in-profile packets are increased by 23-70% compared to unshaped traffic.
When the propagation delay in the network is changed, similar results are obtained. When the level of congestion in the network is decreased, throughput for traffic shaped by D-DBRAS is increased by 36-42% compared to unshaped traffic. This gain is lower than the more resource constrained case since in the less congested case, most of nonconformant packets can also be delivered to the destination.
It is observed that in a congested network, as the ratio of shaped traffic in the network increases, average throughput of shaped traffic decreases. Neverthe-less, when all traffic in the network is shaped by D-DBRAS, average throughput achieved is 4-45% larger than the average throughput achieved when no traffic in the network is shaped. This is the result of more efficient usage of network resources when the traffic is shaped, i.e., more packets can be marked as confor-mant at the expense of some additional delay. Furthermore, total throughput in the network increases as the ratio of shaped traffic in the network increases.
It is also observed that buffer threshold levels in the SP network that deter-mine how nonconformant packets are handled in the core network can affect the throughput. When nonconformant packets are handled in a less tolerable fashion, the throughput of a shaped traffic can be 65% better than average throughput of unshaped traffic having the same statistical characteristics. On the other hand, when nonconformant packets are treated in a relatively tolerable manner, average throughput of shaped traffic can be up to 24% less than throughput of unshaped traffic with the same traffic characteristics and QoS requirements in a congested network. Therefore, performance of the shaper is significantly affected by how SP network handles out-of-profile packets.
This thesis is organized as follows: In Chapter 2, the DiffServ Architecture is discussed. Mechanisms and devices that comprise DiffServ Architecture are described supplemented with some of their proposed forms. In Chapter 3, the shaper DBRAS is introduced. Required capabilities of DBRAS, its design, and implementation of the simulations for testing its performance are described. In Chapter 4, the shaper D-DBRAS is introduced. The motivations behind the
extension from DBRAS to D-DBRAS, algorithm used for Dmax adaptation are
presented. Simulations for performance evaluation of D-DBRAS are described and effects of some parameters on this performance are analyzed.
Chapter 2
Differentiated Services
Architecture
The Internet has grown both geographically and in content in great scales during last thirty years. The reason behind this growth is the simplicity of connecting to it. Devices that are connected to the Internet use a protocol named Internet Protocol (IP). All types of traffic using IP are handled in the same manner by the network. There is no guarantee that a packet will reach its destination, neither is there a guarantee on the amount of time it will take until the packet reaches its destination. For different types of traffic, these uncertainities have different importance. For example, a file transfer application requires no packet loss; whereas it does not consider the delay its packets face in the Internet. On the other hand, real-time traffic like audio and video streaming applications are not keenly interested in the individual packet losses, but they are very sensitive to the delay and the variation of delay (jitter) for their packets.
To satisfy the needs of traffic types with different requirements, transport protocols are used: The reliability of delivering packets is satisfied by using
Transmission Control Protocol (TCP) which provides a reliable service by estab-lishing a connection between the source and the receiver and ensuring successful transmissions of packets through the Internet. In addition to this property, TCP has a mechanism that tries to detect, avoid and respond to congestion faced by the packets in the Internet. The delay requirements are currently addressed by using transport protocols that are based on User Datagram Protocol (UDP) which makes no attempt to ensure packet delivery. UDP does not exercise any congestion control mechanism so that packets experience smaller delays with this less complicated transport protocol. Having solved two problems by using two different transport protocols, however, does not lead to a fair Internet service. In fact, TCP traffic may obtain smaller throughput (amount of traffic received as consecutive packets by its receiver in unit time) than UDP traffic especially when the network is congested.
To solve the fairness problem in the Internet, there have been different propos-als. Some researchers tried to find the solution while keeping the Internet struc-ture as it is, whereas some work which received the majority of the researcher’s support considered modifications to the structure of the Internet. Adding con-gestion detection and avoidance mechanisms to all traffic using the Internet was an idea from the first group of researchers. The second class of research, adding quality of service (QoS) support into the structure of Internet, is divided into two subclasses. The first subclass aimed to support QoS by reserving requirements of individual traffic flows in the Internet, namely the Integrated Services (IntServ) model. IntServ model requires too much processing in the network core, which makes it unscalable and disadvantageous over the second model, Differentiated Services (DiffServ) model. DiffServ model has reservation in the network core for only a small number of service classes. It assigns traffic flows to one of those service classes based on their requirements at the edges of the network. This gives the property of scalability to DiffServ model.
In Section 2.1, an overview of DiffServ model is presented. In Section 2.2, proposed forms of mechanisms at the core of the DiffServ network, Per Hop Be-haviors are described. In Section 2.3, active queue management schema used in the DiffServ architecture are discussed. Some marking mechanisms used in DiffServ networks are introduced in Section 2.4. In Section 2.5, shaping algo-rithms that have been previously proposed in the literature are presented. Traffic Conditioners proposed in the literature are discussed in Section 2.6.
2.1
An Overview of DiffServ Model
In DiffServ architecture, buffer space and bandwidth resources are distributed among a small number of service classes in every network node [1]. These service classes might satisfy different requirements such as delay and loss. The Service Provider (SP) accepts to serve a customer after making a formal agreement with the customer named as Service Level Agreement (SLA). Major parameters in the SLA specifying the traffic and service required are described below [2].
Contents of an SLA:
1. Scope: Boundaries to identify geographical/topological region in which the QoS is to be enforced uniquely.
2. Flow Id : Identification of IP datagrams of customer traffic such as Type of Service Byte in IPv4 header and Traffic Class Byte in IPv6 header [3] (it will be referred to as DS field in the remaining part).
3. Traffic Conformance Testing: The set of parameters (like sending rate, maximum number of consecutive packets (a burst) in the traffic) and their values that customer agrees to obey and also the algorithm to be used for confirmation of this obedience.
4. Excess Treatment: Method for applying to excess traffic which is the por-tion of traffic that fails traffic conformance test (also named as out-of-profile packets). Possible methods are dropping, marking, and shaping.
5. Performance Guarantees: Guarantees supplied to the in-profile packets of the customer, i.e., packets obeying parameter values for Traffic Confor-mance, in terms of
(a) delay: The maximum packet transfer delay from ingress (entrance point of the customer traffic into SP network) to egress (departure point of the customer traffic out of SP network) router.
(b) jitter: The maximum packet transfer delay variation from ingress to egress router.
(c) packet loss: The ratio of the number of in-profile packets lost between ingress and egress routers to the total number of in-profile packets injected at ingress router.
(d) Throughput: Rate measured at the destination counting all received packets.
Out-of-profile portion of traffic receives no guarantees.
6. Service Schedule: Statement of time intervals when the service is available in terms of:
(a) Time of the day range (b) Day of the week range
(c) Month of the year range
7. Reliability: Maximum allowed mean downtime per year (MDT) and the maximum allowed time to repair in case of service breakdown.
Having signed an SLA, depending on the QoS requirements of the service, SP chooses one of service classes it supports in its network as the service class to
CR 1 CR 3 CR 2 CR 4 ER 1 ER 4 ER 2 ER 3 DiffServ SP network C 1 site 1 C 1 site 2 C 2 site 1 C 2 site 2 C 2 site 3
Figure 2.1: A typical DiffServ SP network.
which the customer traffic will be assigned. Later, it configures its edge routers that are ingress routers for that particular traffic so that DS field of packets belonging to that traffic are filled with a value from the set of values specified in the SLA and packets are mapped to the assigned service class. It also places equipment at ingress router for Traffic Conformance Test and Excess Treatment. This equipment can be a group of devices: a Meter, a Marker, and a Shaper (or Dropper). Meters exercise the Traffic Conformance Test per packet; markers do excess treatment of marking packets of customer traffic as in-profile or out-of-profile, and shapers apply delay to packets in order to decrease the number of out-of-profile packets. When a shaper is used, re-marking is done after shaping if an profile packet is shaped to be in-profile. Droppers just drop out-of-profile packets. Instead of the group of devices, a single device that contains all of those devices can be used which is called Traffic Conditioner [1].
Routers of DiffServ SP network are classified into two classes: Edge routers (ER) that interact with customer sites and core routers (CR) that interact only with routers of the SP. In Figure 2.1, a typical DiffServ SP network is shown.
Meter for C 1
Classifier
Marker
for C 1 Shaper/Dropper for C 1
packets
. . .
Meter
for C m Marker for C m Shaper/Dropper for C m
Queue of SC 1 Queue of SC 2 Queue of SC n . . . Ingress ER Scheduler Meter
for C 2 Marker for C 2 Shaper/Dropper for C 2
Figure 2.2: Ingress edge router internals.
Mechanisms that work in an ingress edge router for a customer traffic can be seen in Figure 2.2. The Classifier classifies incoming packets with respect to the customer traffic they belong to. In this figure, it is assumed that each of m served traffic belong to different customers (C). Classifier directs packets to the respective Meter. Meter applies Traffic Conformance Test and sends the packet and the result of the test to Marker. Marker marks the packet with respect to the result of traffic conformance test and passes the packet to Shaper/Dropper. If a Shaper is used, Shaper delays the packet (if necessary) to make it in-profile and a re-marking mechanism is applied to modify the marking of the packet. If a Dropper is used, Dropper drops out-of-profile packets. Traffic coming from Shaper/Dropper component of every customer is directed to the queue of the service class (SC) it is assigned to. Scheduler serves queues of all service classes using a scheduling algorithm.
The internals of a core router are shown in Figure 2.3. In a core router, a Classifier, looking at the DS field of IP header of incoming packets, directs them to the queue of service class they are assigned to. And queues of service classes are served by a Scheduler which works with some scheduling algorithm.
Service classes in a SP network are called as Per Hop Behaviors (PHB) in DiffServ terminology [1]. After Internet Engineering Task Force (IETF) DiffServ
Classifier packets Queue of SC 1 Queue of SC 2 Queue of SC n . . . CR Scheduler
Figure 2.3: Internals of a core router.
WorkGroup specified properties of PHBs and the method of submission of pro-posals for PHBs in [1], there have been some PHB propro-posals. Per Hop Behaviors that have been proposed to be included in DiffServ model are discussed in the next section.
2.2
Per Hop Behavior Proposals
DiffServ architecture is aimed to contain only a small number of PHBs. This aim was set to have simplicity and scalability in the core of the network [1]. As described previously, PHBs are service classes among which DiffServ SP dis-tributes its network resources. Allocating different levels of queue space and different amount of bandwidth to PHBs, SP can offer services with varying QoS considerations. Each PHB used in DiffServ networks is standardized for both simplifying the establishment of multi-SP services and helping SPs in deciding on the way of distributing network resources among different PHBs in their net-works.
In Sections 2.2.1 and 2.2.2, ideas behind Expedited Forwarding Per Hop Be-havior (EF PHB) and Assured Forwarding Per Hop BeBe-havior (AF PHB) group are presented.
2.2.1
Expedited Forwarding Per Hop Behavior
EF PHB is specified in [4]. It supplies a low loss, low delay, low jitter, assured bandwidth service. Loss, delay, and jitter arise from queueing in network core. Queues occur in a network router when the short-term arrival rate is higher than departure rate. EF PHB aims to keep sizes of queues used by the traffic small. The bandwidth used by EF PHB in every node of SP network is configured to be at least as high as a constant value which is specified by SP. This forces queue loads seen by the traffic to be below a certain level [4].
2.2.2
Assured Forwarding Per Hop Behavior
AF PHB is specified in [5]. It is presented as a group of 4 PHBs, each supplying a delay-tolerant, loss-sensitive service. More specifically, each gives a customer the assurance that its packets will be forwarded to their destinations with a high probability as long as the subscribed information rate (in SLA) is not exceeded. Otherwise, packets exceeding subscribed information rate are forwarded with a smaller probability compared to packets that obey subscribed information rate. Packets of a customer traffic using AF PHB can be marked in 2 (green, red) or 3 (green, yellow, red) colors. Green packets are in-profile packets, and red (or yellow and red) packets are out-of-profile packets. Forwarding probability of packet colors decreases in the direction of green, yellow, and red. Each queue used by an AF PHB in DiffServ core have 3 virtual queues in it. Those virtual queues are used to apply probabilistic packet dropping to incoming packets while using different dropping probabilities for packets of different colors, so as to satisfy the
relation between forwarding probabilities of packet colors. This is achieved using an active queue management scheme on each virtual queue of AF PHB, which will be described in the next section [5].
In [6], it is reported that AF PHB may fail to supply subscribed informa-tion rate to TCP traffic in under-provisioned networks (networks that have less amount of resources than the amount of traffic SP has agreed on SLAs to serve) which carry either only TCP traffic or both TCP and UDP traffic. Nevertheless, in [3], it is stated that AF PHB can protect TCP traffic from UDP traffic by providing a minimum bandwidth.
Information on active queue management schema that can be used in AF PHB is introduced in the next section.
2.3
Active Queue Management Schema
The idea of Active Queue Management (AQM) was initially introduced for the need in routers of the current (Best-Effort) Internet to avoid the performance degradation during congestion as a supplement to the end-system-based conges-tion avoidance mechanisms used by TCP [7]. AQM drops packets probabilisti-cally and in a distributed way before the occurrence of congestion in the queue so that TCP traffic decreases its congestion window. This way, TCP saves both further traffic from being lost, which makes it more time-consuming for TCP to recover, and prevents network queues from getting congested. The first AQM introduced was Random Early Detect (RED) [7]. Later, AQMs that try to avoid some of the failing points of RED have been proposed. In Section 2.3.1, RED is briefly described. Among different AQMs that exist in the literature, only RED is extended to support AF PHB. In Section 2.3.2, RED variants for AF PHB, namely RED with In and Out- Coupled virtual Queues (RIO-C), RED with In
and Out- Decoupled virtual Queues (RIO-DC), Weighted RED (WRED), and DROP are introduced.
2.3.1
RED
RED keeps track of average queue load as Exponentially Weighted Moving Av-erage (EWMA) upon packet arrivals to the queue and behaves differently to incoming packets depending on the relation between average queue load and two
thresholds, minth (minimum threshold) and maxth (maximum threshold). If
av-erage queue load is smaller than minth, then the incoming packet is enqueued.
If average queue load is greater than maxth, the packet is dropped (hard drop).
If average queue load is between minth and maxth, the packet is dropped
prob-abilistically (early drop). The dropping probability increases both as average
queue load gets closer to maxth and as the number of packets enqueued since the
last drop increases. The dropping probability, denoted as pa, is given by
pa = pb 1 − count · pb , (2.1) where pb = maxp· qa− minth maxth− minth (2.2)
and maxp is the maximum value of pb, qa is the average queue load and count is
the number of packets enqueued since the last drop [8].
In [8], it is reported that maximum thresholds of queues in current Internet can easily be exceeded. This is due to the fact that the average queue size
increases proportional with N2/3
where N is the number of active connections served by the queue, until the maximum threshold is reached. Physical queue sizes used in the current Internet cause the average queue size to reach maximum threshold even for small N [8]. In [8] and [9], it is reported that determination of threshold values for RED is not trivial. Moreover, performance obtained
with RED may not be better than performance obtained with First-In/First-Out (FIFO) queue [9]. Stabilized RED (SRED), Dynamic RED (DRED), and BLUE offer different methods to keep the instantaneous queue load over some specified level, which helps TCP during recovery from congestion and increases performance of the queue after congestion [8]. Stochastic Fair BLUE (SFB) extends BLUE to avoid bad effects of UDP traffic on TCP traffic performance [10].
2.3.2
Variants of RED for AF PHB
Since there are at least 2 virtual queues in an AF PHB, RED has to be extended in order to support AF PHB. Variants of RED that support AF PHB differ in the number of threshold values used, the number of average queue load values computed, and the computation method used. Both RIO-C and RIO-DC keeps one average queue load value and one pair of threshold parameters for each virtual queue. Both update average queue loads of those virtual queues on arrival of each packet. They differ in the method they use in the computation of average queue loads. RIO-DC uses only packets with the color for which the computation is made, whereas RIO-C uses all packets with a color having forwarding probability higher than or equal to the color for which the computation is made [11]. This way, RIO-C makes sure that the dropping probability computed for the incoming packet will increase as the forwarding probability of the packet decreases [12]. WRED computes a single average queue load including packets of all-colors in the computation. However, it has different threshold pairs for each color. DROP AQM drops all incoming packets after queue size reaches a minimum threshold [11].
2.4
Proposed Marking Mechanisms
As a component for Excess Treatment, a marker marks packets as in-profile or out-of-profile based on traffic conformance at the ingress router. In this section different markers proposed in the literature are described. In Section 2.4.1, Token Bucket Marker is explained. In Section 2.4.2, some other markers in the literature are presented.
2.4.1
Token Bucket Marker (TBM)
TBM has two parameters: the maximum rate the customer is allowed to send its packets, called Committed Information Rate (CIR), and the maximum number of packets that a customer is allowed to send consecutively (in a burst), called Committed Burst Size (CBS) [13]. It enforces its policy through emulation of a token bucket which has size CBS and token production rate of CIR. Tokens produced after token bucket becomes full are discarded. A token can color one Byte of a packet. So, an incoming packet is marked as green when there are tokens enough to color every Byte of it. In that case, also the number of tokens in the token bucket is decreased by the number of tokens used. Otherwise, the packet is marked as red and token level in the token bucket remains unchanged.
2.4.2
Other Markers in the Literature
In [14], the Two-Rate Three Color Marker (trTCM) is described. It is based on TBM. It has 2 token buckets with parameter pairs (CBS, CIR) and (Peak Burst Size (PBS), Peak Information Rate (PIR)). If an incoming packet finds enough tokens in both of token buckets, it is marked as green. In [15], Fair Marker is in-troduced which is a TBM that aims to distribute tokens fairly among flows within the aggregate of customer. Fair Traffic Conditioner, which is proposed in [16], is
the Fair Marker extended to be based on trTCM. TCP Friendly Marker, which is presented in [17], aims to protect small-window flows from packet losses and maintain spacing between packets that are marked as out-of-profile. In achiev-ing these, it distributes tokens of an aggregate customer traffic among individual flows constituting the aggregate. Then it uses these tokens while leaving some time interval between consecutive packets that are marked as out-of-profile. Pro-portional Marking, which is proposed in [18], marks out-of-profile packets prob-abilistically as out-of-profile whose probability increases proportionally with the percentage of excess traffic. A modified form of Proportional Marking which con-siders individual flows within an aggregate, named as New Marking Algorithm, is also introduced [18].
2.5
Traffic Shapers
In addition to the findings stated in Section 2.2.2, there are studies that show the existence of a relation between assured rate (subscribed information rate in SLA), packet size, Round Trip Time (RTT) of TCP, dropping probability for out-of-profile packets, and capability of TCP to achieve its assured rate [19]. In fact, for some values of assured rate, packet size, RTT, and dropping probability, TCP flow can be unable to achieve its assured rate [19]. Moreover, in [20], for a TCP traffic marked by a TBM in AF PHB, it is reported that the service rate obtained by TCP in an AF PHB cannot be specified using only SLA parameters. On the other hand, there are studies on dynamic pricing of Internet usage based on QoS and rate of service. From customers’ viewpoint, this arouses the need to adapt to price changes and to control the rate of their usage [21]. These observations set out the specification of a mechanism to shape the TCP traffic that uses AF PHB so as to achieve (or go beyond in the case of over-provisioned network) either its assured rate or the rate which has the affordable price. The second one might be the topic of future, since there exists no deployed example
of Internet Service pricing based on the content or usage profile. But the first mechanism, to shape the TCP traffic that uses AF PHB so as to achieve or go beyond its assured rate, is the starting point of research on shapers.
In Section 2.5.1, Rate Adaptive Shaper (RAS) and in Section 2.5.2, Green Rate Adaptive Shaper (g-RAS) are explained. In fact, ideas of these two shapers gave rise to the shaper proposed in this thesis. It should be noted that both of these shapers are designed to work upstream from marker, which is different from placement seen in Figure 2.2. In terms of this figure, these shapers are placed before Meter. In Section 2.5.3, some other traffic shapers that have been presented in the literature are described.
2.5.1
Rate Adaptive Shaper (RAS)
Rate Adaptive Shaper (RAS) works upstream from a TCM. In fact, RAS that works upstream from a trTCM is named as trRAS. trRAS consists of a Drop-Tail First-In/First-Out (FIFO) queue served by a varying rate server. The rate of server is determined by two factors: queue load and estimated rate of incoming traffic. trRAS has three threshold values on the queue load: Committed
In-formation Rate Threshold (CIRth), Peak Information Rate Threshold (P IRth),
and Maximum Information Rate Threshold (M IRth). Usually, these
parame-ters are assigned values of CBS and PBS parameparame-ters of the downstream trTCM, and the size of the queue, respectively. There are three parameters related with the rate of the server: Committed Information Rate (CIR) which is the average transmission rate of customer, Peak Information Rate (PIR) which is the maxi-mum transmission rate of the customer, and Maximaxi-mum Information Rate (MIR) which is the maximum transmission rate allocated by the SP to the customer. Normally, these parameters are assigned CIR and PIR values of the downstream trTCM, and the rate of the downstream link, respectively. The effect of queue
length (b o) on the rate of server is determined by a function f(b o) which is expressed by f(b o) = CIR, if b o ≤ CIR th b o−CIR th
P IR th−CIR th ∗ (P IR − CIR) + CIR, if CIR th < b o ≤ P IR th b o−P IR th
M IR th−P IR th∗ (M IR − P IR) + P IR, if P IR th < b o ≤ M IR th
M IR, if b o > M IR th
(2.3)
trRAS can estimate the rate of incoming customer traffic using any form of
EWMA calculation. For example, it can use EARnew = [(1 − e−T /K) × L/T ] +
e−T /K×EAR
old, where EARnewis the new value of estimated arrival rate, EARold
is the previous value of estimated arrival rate, T is the amount of time elapsed since the arrival of the previous packet, L is the size of the incoming packet, and K
is a constant. The rate of server for trRAS is calculated as max(f (b o), EARnew)
[22].
2.5.2
Green Rate Adaptive Shaper (green RAS)
As an extension to RAS, green RAS considers the status of the downstream marker in shaping. This way, it avoids unnecessary delaying of the packets that can be marked as green by the downstream marker. Green RAS working upstream from a trTCM (g-trRAS) is described below.
g-trRAS computes a time value T1 as the time to send the currently received
packet using the server rate computed as max(f (b o), EARnew). Additionally,
it computes a time value T2 which is the earliest possible time instant when
the current packet can be marked as green by the downstream marker. The calculation method is max(t, t + (B − T c(t))/CIR, t + (B − T p(t))/P IR), where t is the current time, B is the size of the packet (in Bytes), Tc(t) is the number of tokens at time t in the token bucket of trTCM with parameters (CBS, CIR),
and Tp(t) is the number of tokens at time t in the token bucket of trTCM with parameters (PBS, PIR). PIR and CIR are respective parameters of trTCM. If B
is greater than any of PBS or CBS, T2 is set to infinity. The time to send the
current packet is determined as min(T1, T2) [22].
Unnecessary delaying of packets can degrade performance of TCP [23]. This lowering effect of delay on the throughput of TCP traffic (the amount of data received as consecutive packets in unit time), which results from increased RTT, can be observed from the approximation of steady-state TCP Reno throughput, B(p), which is stated as [23] B(p) ≈ min Wmax RT T , 1 RT Tq23bp+ TOmin µ 1, 3q3bp8 ¶ p(1 + 32p2 ) (2.4)
where Wmax is the maximum window size of TCP, b is the number of packets
that are acknowledged by a received acknowledgement. The value of b is usually 2, p is the probability that a packet is dropped, given that it is not a member
(other than first) of consecutive drops, and TO is the initial timeout duration.
2.5.3
Other Shaper Algorithms in the Literature
In [24], a shaper is introduced to work in ATM networks. It uses the distribution of a random process as a reference to shape the distribution of the incoming traffic. In [25], a traffic shaper is introduced for Best-Effort Internet to avoid congestion occurring in video stream clients. It can determine minimum and maximum rates that customer can use, and the size of each burst. A traffic shaper is used for Best-Effort Internet to shape the customer traffic into the currently available rate in the network in [26]. In [27], a traffic shaper mechanism is introduced to work in Best-Effort Internet and make TCP flows uncorrelated to favor delay-sensitive flows. A traffic shaper for Guaranteed Service of IntServ model is proposed in [28]. This shaper has two rate values to work with. During
a small interval since the beginning of a burst of traffic, it uses the high rate and later it uses the low rate to send MPEG-compressed video.
2.6
Traffic Conditioner Proposals
As stated previously, Traffic Conditioners include a group of devices: a Meter, a Marker, and a Shaper/Dropper. So, a traffic conditioner both applies Traffic Conformance Test and handles Excess Treatment.
In [29], three traffic conditioners are introduced. RTT-Aware Traffic Condi-tioning aims to distribute excess bandwidth in over-provisioned networks favoring TCP connections with long RTT. Similarly, Target-Aware Traffic Conditioner with 2 Drop Precedences (TATC-2DP) and TATC-3DP aim to distribute excess bandwidth in over-provisioned networks favoring TCP connections with larger subscribed rate.
In this thesis, a shaper is proposed, which determines the sending time of an arriving packet considering the status of the downstream marker and the total shaping delay. The shaping delay is defined as the time interval between the time when all Bytes of a packet are received and the time when all Bytes of the the packet are sent downstream to the marker. The proposed shaper considers an upper bound on the shaping delay it can apply to an arriving packet. By limiting the maximum shaping delay, the proposed shaper tries to prevent un-necessarily large shaping delays resulting in large RTTs which in turn decrease the throughput as predicted by (2.4). Obeying the upper bound on the shaping delay, it tries to increase the number of packets that are marked as green by the downstream marker. By adjusting shaping delay in a controlled manner and decreasing dropping probability that segments face in the DiffServ core, it aims to increase the throughput achieved by TCP. In the next chapter, architecture and the algorithm of the proposed shaper and results of simulations performed
using NS [30] are presented. In Chapter 4, an extension to the shaper is intro-duced where the shaper periodically modifies the upper-bound on the shaping delay to increase the throughput achieved based on information from the sender TCP. Algorithms used are described in detail. Simulation results that reflect the improvement of this extension are presented.
Chapter 3
Delay-Bounded, Rate-Adaptive
Shaper (DBRAS)
In this chapter, we are going to present a description of the shaper proposed in this thesis, DBRAS, in a sequence of steps: In Section 3.1, required capabilities of DBRAS are specified. In Section 3.2, design of DBRAS is presented. In Section 3.3, shaping algorithm of DBRAS is presented. In Section 3.4, simulations for performance evaluation are introduced.
3.1
Required Capabilities
The throughput level achieved by TCP traffic when it is shaped by any shaper should not be less than the level of throughput achieved when the TCP traffic is not shaped. DBRAS aims to delay a packet it received, as long as the shaping
delay of the packet is at most equal to an upper bound, Dmax. Otherwise, it just
aims to put the packet out as soon as possible. The upper bound on shaping delay is placed for the following observation. Packets of the traffic can be made all in-profile using an infinite-length queue as long as the mean packet arrival
rate is less than the mean drain rate of the policer, CIR. But depending on the relation between CIR and actual traffic sending rate, this may lead to long queuing delays in the shaper which, in turn, may lead to decrease in the achieved level of throughput. Furthermore, the physical constraints on the queue size in the shaper makes this idea unapplicable. Moreover, it is possible that SP network is lightly loaded at the time of TCP traffic and packets of the traffic can pass through the network irrespective of their color. In that case, shaping the traffic to make a larger ratio of packets marked as green can lead to lower level of achieved throughput than the level that could be achieved when the traffic is not shaped.
3.2
DBRAS Design
The design of DBRAS is shown in Figure 3.1. Packets arrive to DBRAS from
the source via a link with a transmission rate of RU L. DBRAS consists of three
components: Scheduler, which determines the amount of shaping delay to apply to an incoming packet. Then Scheduler sends the packet to the Buffer, which is the place where the packet waits until it is ready for transmission. It is actually a queue whose activity- putting the packet at the head of the queue onto the outgoing link- is controlled by the Transmitter. Scheduler maintains a list of shaping delay values assigned to each packet. As Scheduler sends the packet to the Buffer, it simultaneously appends a delay value for that packet to the end of the delay list. After a packet becomes the head-of-the-queue packet (first one to go out) in the Buffer, Transmitter releases the packet after a delay equal to the waiting time assigned for this packet which is given in the delay list.
It should be noted that we need to supply the shaper with a downstream link to Marker having a rate at least equal to the transmission rate of the upstream
link of the shaper, RU L. Otherwise, inevitably, whatever it does for shaping,
BufferSize CBS Token Bucket Marker RUL RUL Scheduler Transmitter Buffer CIR RUL
Figure 3.1: Design of the DBRAS.
DBRAS receives data will be larger than the rate with which it can send packets to the downstream Marker. For simplicity, the downstream marker is assumed to be of type TBM.
Scheduler determines the delay for a packet of size LiBytes received at time ai,
using the following algorithm which is a modification of the algorithm proposed for the green RAS [22]. Green RAS calculates the delay using the state of the marker at the time when the packet comes to the head of the queue whereas DBRAS shaping algorithm determines the delay using the state of the marker at
the time when the packet will reach the marker while also considering Dmax as
an upper-bound on the shaping delay. We assume that the propagation delay of the link between shaper and marker is negligible and only the transmission delay for that link is considered. DBRAS shaping algorithm is described in detail in the following section.
3.3
DBRAS Shaping Algorithm
The shaping algorithm for DBRAS is described below. A packet arriving at DBRAS can find it in either of 2 states: there is no packet in the queue, or there
is at least one packet in the queue. When a packet is received,
If there is no packet in the queue
If there are enough tokens to mark the packet as green send it immediately after you receive it
Else
calculate a delay value in which tokens enough for the packet to be marked as green can be produced
If shaping delay is greater than Dmax
send the packet immediately after you receive it (let it be marked as red)
Else
send the packet so as to satisfy its shaping delay (it will be marked as green)
Else
After sending the last packet currently in the queue, if there will be enough tokens to mark the packet as green,
send the packet immediately after sending the last packet currently in the queue
Else
calculate a delay value in which tokens enough for the packet to be marked as green can be produced
If shaping delay is greater than Dmax,
send the packet immediately after sending the last packet currently in the queue
Else
send the packet so as to satisfy its shaping delay (it will be marked as green)
an: arrival time of the last bit of packet n, in sec,
Ln: size of the packet n, in Bytes,
RU L: transmission rate of the downstream link (link between shaper and TBM),
in Bytes/sec,
CIR: Committed Information Rate of TBM, in Bytes/sec, CBS: Committed Burst Size of TBM, in Bytes,
Dmax: the maximum value of shaping delay, in sec,
Sn: sending time of the first bit of packet n (start of transmission), in sec,
S0
n: sending time of the last bit of packet n (end of transmission), in sec,
S0
lastuse: the last time TBM marked a packet as green, i.e., the last time a token
is used, in sec,
t a l u: the number of tokens remaining in the token bucket after the latest packet that is marked as green is transmitted,
t p: the number of tokens produced in the time interval from the last token usage up to the earliest possible arrival of the currently considered packet to TBM. The shaping algorithm of DBRAS can be stated in a more programming-based approach in the following way:
if (an> Sn−10 ) /* There is no packet in the queue*/
t p ← min(CBS − t a l u, (an− Slastuse0 + (Ln/RU L)) ∗ CIR)
if (Ln<= t a l u + t p) /*enough tokens to mark as green*/
Sn ← an S0 n ← Sn+ (Ln/RU L) S0 lastuse ← S 0 n t a l u ← t a l u + t p − Ln else
d ← (Ln− (t a l u + t p))/CIR /*when it can be marked as green*/
if ((d + (Ln/RU L)) > Dmax)
S0 n← Sn+ (Ln/RU L) else Sn← an+ d S0 n← Sn+ (Ln/RU L) S0 lastuse ← S 0 n t a l u ← (t a l u + t p + d ∗ CIR) − Ln
else /* There is at least one packet in the queue*/
t p ← min(CBS − t a l u, (S0
n−1− S 0
lastuse+ (Ln/RU L)) ∗ CIR)
if (Ln<= t a l u + t p) /*there will be enough tokens to mark as green*/
Sn ← Sn−10 S0 n ← Sn+ (Ln/RU L) S0 lastuse ← S 0 n t a l u ← t a l u+ t p − Ln else d ← (Ln− (t a l u + t p))/CIR if ((S0
n−1− an+ (Ln/RU L) + d) > Dmax) /*let it be marked as red*/
Sn← Sn−10
S0
n← Sn+ (Ln/RU L)
else /* introduce delay d to mark as green*/
Sn← Sn−10 + d S0 n← Sn+ (Ln/RU L) S0 lastuse ← S 0 n t a l u ← (t a l u + t p + d ∗ CIR) − Ln S0 n−1← S 0 n
In order to evaluate the performance of DBRAS, we implemented DBRAS in NS [30] (version 2.1b7a, using DiffServ Module that is contributed by Nor-tel Networks and included in NS starting from version 2.1b8), and performed simulations. In Section 3.4, performance analysis of DBRAS is presented.
3.4
Performance Analysis of DBRAS
In the beginning of the chapter, required capabilities for DBRAS were stated. To test whether DBRAS is successful in answering those requirements, a group of simulations are performed. The topology to be used in the simulations should be chosen so as to observe the performance of DBRAS objectively. The topology used in simulations is discussed in Section 3.4.1. In Section 3.4.2, results of simulations are presented and reasoned.
3.4.1
Simulation Topology
The performance of DBRAS is evaluated for a bursty TCP traffic in a congested network, where advantage of using the shaper will be more significant. In simu-lations, we used 10 TCP connections, 5 of which are shaped by DBRAS, whereas the other 5 are unshaped. We compare the average throughput values achieved by shaped and unshaped traffic as a measure of performance of DBRAS.
Simula-tions are obtained for different values of Dmax, CBS, and total propagation delay
of the traffic from its source to its destination (called as PD in the remaining of
thesis) to observe the effects of these parameters on the performance of DBRAS. Before analyzing the results obtained from simulations, we are going to study the simulation network in 3 parts: Network design, DiffServ configuration, and traffic details.
Network Design
We built the topology shown in Figure 3.2. In this network, nodes (e1, core, e2) represent the network of DiffServ SP. Nodes e1 and e2 are DiffServ edge routers and core node is a DiffServ core router, as their names imply, respectively. Nodes labelled as s# denote nodes of customers which send data into SP network. Node
s8 s3 e1 core e2 s9 10 Mbps, 5 msec s2 s1 DBRAS1 DBRAS0 10 Mbps, 0 msec s4 s7 s6 s5 s0 10 Mbps, 5 msec 10 Mbps, 5 msec 10 Mbps, 5 msec 10 Mbps, 5 msec dest DBRAS2 DBRAS3 DBRAS4
Figure 3.2: Simulation Topology.
dest is the destination of all the traffic through DiffServ core. Nodes labelled as DBRAS# are the nodes where DBRAS is working. Each link in this topology has 10 Mbps rate. Except the links between nodes DBRAS# and e1, all links have 5 msec propagation delays. The links between nodes DBRAS# and e1 are assigned to have 0 msec propagation delay to satisfy the requirement of DBRAS shaping algorithm stated previously. There are queues of Drop Tail type at the entrance of links (si, e1) and (e1, si) for all i, 5 ≤ i ≤ 9, links (si, DBRASi), (DBRASi, si), and (e1, DBRASi) for all i, 0 ≤ i ≤ 4, and links (e2, dest) and (dest, e2). There are queues of DBRASQueue type (our implementation of DBRAS in NS [30]) at the beginning of each of the links (DBRASi, e1) for all i, 0 ≤ i ≤ 4. There are queues of dsred/edge (NS implementation of DiffServ edge router) type at the beginning of simplex links (e1, core) and (e2, core). There are queues of dsred/core (NS implementation of DiffServ core router) type at the beginning of simplex links (core, e1) and (core, e2).
DiffServ Configuration
The DiffServ SP network bandwidth is divided evenly between those 10 TCP connections. In fact, each is configured to have CIR of 1 Mbps and the same CBS value which will be specified in particular simulations. Each of 10 traf-fic streams uses the same AF PHB and a TBM of its own. In a particular simulation, all TBMs in the network have identical CIR and CBS values. Sim-ilarly, in a particular simulation, all DBRASs in the network have the same
Dmax value. In the DiffServ core, RIO-C AQM scheme is used. The parameters
(minth, maxth, maxp) of the green and red virtual queues are (20, 40, 0.02) and
(10, 20, 0.1), respectively. These values are as specified in example simulation files of DiffServ in NS.
Traffic Details
In order to generate bursty traffic, Exponential type traffic generators in NS are used. These traffic generators have exponentially distributed burst occurrence times and burst durations. The rate of traffic production during a burst is set to 10 Mbps. Average burst duration is set to be 20 msec and idle time (time between consecutive bursts) average is set to be 113.3 msec, so that each traffic has a mean rate of 1.5 Mbps. Packet size is 1000 Bytes. In our simulations TCP has a MSS of 1000 Bytes and a congestion window limit of 20 segments.
Traffic is sent using TCP Reno implementation. This implementation uses 3 duplicate acknowledgements (ACKs) as a signal for packet loss (fast retransmis-sion). Fast recovery is executed after fast retransmission by dropping slow-start threshold by half, assigning that value of slow-start threshold as congestion win-dow, increasing congestion window by one for each duplicate ACK received, and assigning slow-start threshold value to congestion window by the reception of a new ACK (ACK acknowledging previously unacknowledged data) [30].
We measure the throughput of a TCP traffic by using EWMA. The formula
used in calculation of TCP throughput in kth measurement period, T(k), is
T (k) = (1 − α) × T (k − 1) + α × ((l s − f s)/p d) (3.1)
where α is the EWMA constant with value 0.2, l s is the sequence number of the last segment that was ACKed by the receiver in the current measurement period (in NS, ACKs are in terms of segments, not Bytes). Similarly, f s is the sequence number of the first segment that was ACKed by the receiver in the current measurement period, and p d denotes the duration of measurement period in seconds, which is chosen to be 200 sec. The traffic generators work for 5000.0 sec and measurements are made until time 4400.0 sec.
Having studied the simulation network in detail, we are going to observe and analyze the results obtained from simulations. Simulations of this chapter can
be classified into 2 sets in terms of PD. In the first set of simulations, PD is
20 msec. In the second set of simulations, the PD is 5 msec. Within each set,
measurements are taken for different values of the pair (CBS, Dmax).
3.4.2
Simulation Results
In the first set of simulations, propagation delay for each
non-zero-propagation-delay link is chosen to be 5 msec so that PD is 20 msec. For this set, 3 CBS
values are used: 3, 5, and 8 KBytes. For each CBS value, Dmax value range is
defined so that the throughput values reach a constant, which results from the
fact that with this particular Dmax value, all packets of the traffic can be shaped
to be marked as green.
Results of the first set of simulations are shown in Figure 3.3. In this figure, there are 3 pairs of plots for average throughput values of shaped and unshaped sources, one for each CBS value. When we focus on the upper-most and lower-most plots, average throughput for shaped and unshaped traffic with CBS = 3
Throughput vs. Dmax 500 600 700 800 900 1000 1100 0 0.02 0.04 0.06 0.08 0.1 0.12 0.14 Dmax (sec) Throughput (Kbps) CBS3K_s CBS5K_s CBS8K_s CBS8K_u CBS5K_u CBS3K_u propagation delay = 0.02 sec
-5 sources are shaped and the other 5 sources are unshaped -Dmax is fixed
Figure 3.3: Simulations with PD = 20 msec.
KBytes respectively, we observe that as Dmax increases, the average throughput
of shaped traffic goes through consecutive periods of increase, decrease, increase, decrease and finally a constant value. This behavior is consistent with the fact
that packet drop probability of TCP traffic is inversely proportional with Dmax
(as Dmaxincreases, the number of green packets increases and green packets have
lower dropping probability compared to red packets in DiffServ core), and RTT
is directly proportional to Dmax (as Dmax increases, shaping delay that can be
assigned to a packet increases which can lead to an increase in RTT); both of which are inversely proportional to the throughput of TCP as given by equation (2.4). The behavior of average throughput for unshaped traffic is mainly due to changes in the average throughput for shaped traffic, since the amount of total network resources used by all traffic is fixed. If we consider the effect of CBS value on DBRAS, as CBS increases, the average throughput achieved by shaped traffic and the gain of using DBRAS (difference between average throughput for shaped and unshaped traffic) decreases. This is mainly due to the fact that as CBS increases, TBMs for unshaped traffic generate larger number of green