BUSINESS & MANAGEMENT STUDIES:
AN INTERNATIONAL JOURNAL
Vol.:8 Issue:2 Year:2020, 1424-1454
Business & Management Studies: An International Journal Vol.:8 Issue:2 Year:2020, 1424-1454 ISSN: 2148-2586
Citation: Bayrak Meydanoğlu E. S. & Çilingirtürk A. M. & Öztürk R. & Klein M., An Empirical Cross-Country Study On Consumers’ Attitude Towards Augmented Reality Advertising, BMIJ, (2020), 8(2): 1424-1454 pg doi: http://dx.doi.org/10.15295/bmij.v8i2.1467
AN EMPIRICAL CROSS-COUNTRY STUDY ON CONSUMERS’
ATTITUDE TOWARDS AUGMENTED REALITY ADVERTISING
Ela Sibel BAYRAK MEYDANOĞLU 1 Received Date (Başvuru Tarihi): 6/04/2020Ahmet Mete ÇİLİNGİRTÜRK 2 Accepted Date (Kabul Tarihi): 17/05/2020
Rıza ÖZTÜRK 3 Published Date (Yayın Tarihi): 25/06/2020
Müge KLEIN 4
ABSTRACT Keywords:
Augmented Reality (AR) Augmented Reality Advertising
Advertising Value Consumer Attitude Structural Equation Modeling
(SEM)
JEL Codes:
M31, M37
The use of AR technology for advertising is becoming more and more popular. For the efficacy of AR ad campaigns, consumers' attitudes towards AR ads are decisive. One of the major elements that determines consumers’ attitudes towards advertising is the perceived value of the ad. The aim of this study is to analyze the relationship between AR ad value and consumer attitude and to investigate the factors that affect the perceived value of AR ads among the youth both in Turkey and Germany. The mentioned relations were represented in a research model developed in the study. It was proposed that informativeness, entertainment, novelty, interactivity and self-efficacy have a positive effect on advertising value while irritation and deceptiveness have a negative effect. It was also proposed that ad value affects consumers’ attitudes positively. To test the proposed hypotheses, online surveys were conducted among a group of 365 respondents in Germany and a group of 391 respondents in Turkey. The survey results were then tested by Structural Equation Modeling (SEM). Contrary to expectations, the proposed research model as a whole did not fit and the hypotheses were not supported for Turkish consumers. For German consumers the model was fitted and the hypotheses were supported.
1Prof. Dr., Turkish-German University, [email protected], http://orcid.org/0000-0003-3357-592X 2Prof. Dr., Marmara University, [email protected], http://orcid.org/0000-0001-8677-7969 3Prof. Dr., Bielefeld University of Applied Sciences, [email protected], http://orcid.org/0000-0003-3639-4163 4Assoc. Prof. Dr., Turkish-German University, [email protected], http://orcid.org/0000-0003-2341-2975
ARTIRILMIŞ GERÇEKLİK REKLAMLARINA KARŞI TÜKETİCİ TUTUMU ÜZERİNE ÜLKELER ARASI AMPİRİK BİR İNCELEME
ÖZ
Anahtar Kelimeler:
Artırılmış Gerçeklik Artırılmış Gerçeklik Reklamları
Reklam Değeri Tüketici Tutumu Yapısal Eşitlik Modeli (SEM)
JEL Kodları:
M31, M37
Reklamlar için artırılmış gerçeklik (AR) teknolojisi giderek daha popüler hale geldi. Artırılmış gerçeklik reklam kampanyalarının etkinliği için, tüketicilerin artırılmış gerçeklik reklamlarına karşı tutumları belirleyicidir. Tüketicilerin reklama karşı tutumlarını belirleyen temel unsurlardan biri reklamın algılanan değeridir. Bu çalışmanın amacı, bir artırılmış gerçeklik reklamının değeri ile tüketici tutumu arasındaki ilişkiyi analiz etmek ve Türkiye ve Almanya'daki gençler arasında artırılmış gerçeklik reklamlarının algılanan değerini etkileyen faktörleri araştırmaktır. Söz konusu ilişkiler, çalışmada geliştirilen bir araştırma modelinde temsil edilmiştir. Çalışmada bilgilendiricilik, eğlence, yenilik, etkileşim, öz-yeterliliğin reklam değeri üzerinde olumlu bir etkisi olduğu ileri sürülürken rahatsız edicilik ve aldatıcılığın olumsuz etkisi olduğu ileri sürülmüştür. Reklam değerinin tüketicilerin tutumlarını olumlu etkilediği de önerilmiştir. Önerilen hipotezleri test etmek için, Almanya'da 365 katılımcıya, Türkiye'de 391 katılımcıya çevrimiçi anket uygulanmıştır. Anket sonuçları daha sonra Yapısal Eşitlik Modeli (SEM) ile test edilmiştir. Beklentilerin aksine, bir bütün olarak önerilen araştırma modeli Türk tüketicilere uymamış ve hipotezler Türk tüketiciler için desteklenmemiştir. Alman tüketiciler için model sağlanmış ve hipotezler desteklenmiştir.
1. INTRODUCTION
Methods and business models used in the advertising industry are changing as a result of rapid developments in digital technologies. One of these technologies, which is believed to be a great step in the evolution of advertising media, is Augmented Reality technology (Baratalı, Bin Abd. Rahim, Parhizkar and Gebril, 2016). Augmented Reality can be defined briefly as an interactive technology combining real and virtual objects (Carmigniani and Furht, 2011). AR technology, which has been actually developing since the 60s and has been applied in military, industrial and medical applications (Van Krevelen and Poelman, 2010), found today a wide-spread simplified use thanks to the vehement development of network technologies and mobile devices. It is estimated that AR technology will generate a revenue of $120 billion by 2020 (Gaudiosi, 2015). One of the possible application areas for AR technology is advertising. AR technology supports advertising in an interactive manner, so it gives consumers the possibility to experience products using their smart devices (Singh and Pandey, 2014). It would not be wrong to expect that more and more marketing campaigns will incorporate AR technology. In this sense, it is essential for companies to know how AR ads are perceived by consumers, whether they have a value for them, which factors have an effect on consumers’ perceptions related to advertising value and how these factors as well as ad value affect consumers’ attitudes towards AR ads. This study deals with these issues and proposes from a theoretical perspective a hypothetical research model that can be used to identify the factors, which affect the perceived value of AR ads and the attitudes of Turkish and German consumers towards AR ads. The findings of the study can also provide marketers in Turkey and Germany practical suggestions on how to design effective AR advertising campaigns and to better strategize their AR advertising campaigns. This cross-country study aims also to investigate how AR technology is perceived and evaluated in a developed country (Germany) and in a developing country (Turkey).
The paper comprises of seven sections. In the following section the AR technology and its application in advertising are briefly introduced. The third section deals with the results of the literature review. In the fourth section the proposed research model and the hypotheses to evaluate consumers’ attitude towards
augmented reality advertising are introduced. This section is followed by the sections describing the research method and the results of empirical tests. In the last section the findings of the study are discussed, managerial implications and the limitations of the study as well as future research areas are introduced.
2. AR ADVERTISING
AR technology is an interactive technology that integrates physical and virtual objects (Azuma, Behringer, Julier and Macintyre, 2001). It inserts virtual objects such as images, videos, etc. into physical surroundings in real-time and enables users to see them superimposed (Javornik, 2016). Unlike virtual reality, where users immerse into a virtual environment, AR is applied in the real world (De Paolis and Aloisio, 2010). Augmentation generated by superimposed virtual objects is the unique characteristic of AR technology. According to the types of the augmented objects, AR apps can be categorized in three groups (Javornik, 2016):
AR apps augmenting surroundings: Such apps enable for instance to
superimpose a virtual element (e.g., virtual furniture) on a physical room base on a smart device (Javornik, 2016).
AR apps augmenting products: Such apps enable to obtain an additional digital
content (video, reviews etc.) by scanning a related image via AR apps (Javornik, 2016).
AR apps enabling self-augmentation: These apps enable to convey a reflection
of a person’s body or a body part (e.g., head and face) on a smart device and then to make trials on the reflection with virtual add-ons, such as glasses, make-up, or clothes (Javornik, 2016).
AR technology is applied in various areas such as medicine, education, architecture, tourism, gaming etc. One of its application areas is advertising (Schart and Tschanz, 2015). Some of big brands have already used this technology for their advertising campaigns. Below, some AR ad campaigns are cited to explain how this technology can be applied for advertising.
Absolut ran a campaign based on AR technology. Consumers could scan the AR
scanning they had the opportunity to experience some interesting things like a 3D tour to Åhus where the Absolut vodka comes from or a guide about vodka production process or free drink recipes with Absolut (Catchoom, 2017; Russell, 2012).
Pepsi Co. UK conducted an AR ad campaign in London that enabled people to
see on the glass billboard wall of a bus stop an augmented live stream of exaggerated events (a crashing meteor, an alien attack, a racing tiger etc.) which appeared to take place on the street ahead of the glass billboard wall (Caula, 2014; Göçmen, 2018). People waiting at the bus stop were surprised by unusual events which they saw from inside so they had to look outside the glass wall where then they saw Pepsi Max’s advertisement.
The fragrance brand Lynx Excite (a brand also known by the name AXE in some countries) conducted a campaign by putting markers on the floors of the Victoria Railway Station in London and telling travelers standing on them to look up a big video screen. Travelers standing on markers saw then their own images and the images of virtual angels on the video screen (Catchoom, 2017; Russell, 2012). As travelers walked onto the markers the Excite angels fell to the earth in the video screen, and then interacted with travelers standing on the markers (DigitalBuzz, 2011). So travelers could interact with virtual angels (Catchoom, 2017; Russell, 2012). The aim of the campaign was to illustrate that the attraction of the Excite spray is so strong that it let the angels fall to the ground (McCabe, 2011). The reactions for the ad ranged from surprised to somewhat lewd (Wassermann, 2011).
One of the successful AR ad campaigns is the Coca-Cola’s “drinkable” advertising. Coca-Cola conducted an advertising campaign called “drinkable” during
the N.C.A.A. Men's Final Four (Basketball Tournament) in 2015 within the Coke Zero’s “You Don’t Know Zero 'Till You’ve Tried It” campaign (Sorrels, 2015)”. It was a multichannel advertising that enabled fans to receive either samples of Coke Zero or a coupon for a free bottle. The campaign included various advertising elements: a billboard, commercials, HD video boards, stunts, flyers, interactive mall kiosks, vending machine mascots and tweets (Condon, 2015; The Marketing Society, 2019). Among those elements some used AR technology as follows:
Drinkable Commercial: Coca-Cola used drinkable commercials for the fans who
were at home. Fans with the music identification app Shazam on their smart phones interacted with the Coke Zero that was poured from a bottle on their TVs into a glass on their mobile devices followed by a prompt to Shazam. When the glass on the mobile device was full, fans got a mobile coupon that could be redeemed at participating retailers (Tuned Global, 2019; The Marketing Society, 2019).
Drinkable Stadium HD Video Boards: Coca-Cola used a similar
Shazam-activated video on video boards in Lucas Oil Stadium. Fans in the stadium received a coupon on their mobile devices, where they used these coupons to get a free Coke Zero at participating retailers (Condon, 2015).
Drinkable Challenge at Coke Zero Countdown Concert: Coca-Cola let play also
a Shazam-activated video on boards at the Coke Zero Countdown Concert in White River State Park. A competition was arranged there between the fans. Fans were chosen from opposing Final Four teams to compete to finish a virtual bottle of Coke
Zero from the two digital video boards. The fans used the microphones on their
smartphones as a straw to drink Coke Zero. The one that finished the virtual bottle first was the winner of the game. As prize, the winner earned free Coke Zero for his team's fans in the audience (Sorrels, 2015)
Drinkable Interactive Mall Kiosks: Similar Shazam-activated ads were also
used in kiosks at a shopping mall in Indianapolis. Shazaming the ad made the phones of the people look like a straw and enabled them to drink the liquid on screen. When the bottle on screen was empty, the user received a code that he could use to get a free Coke Zero at an exclusive vending machine in the mall (Condon, 2015; Sorrels, 2015).
3. LITERATURE REVIEW
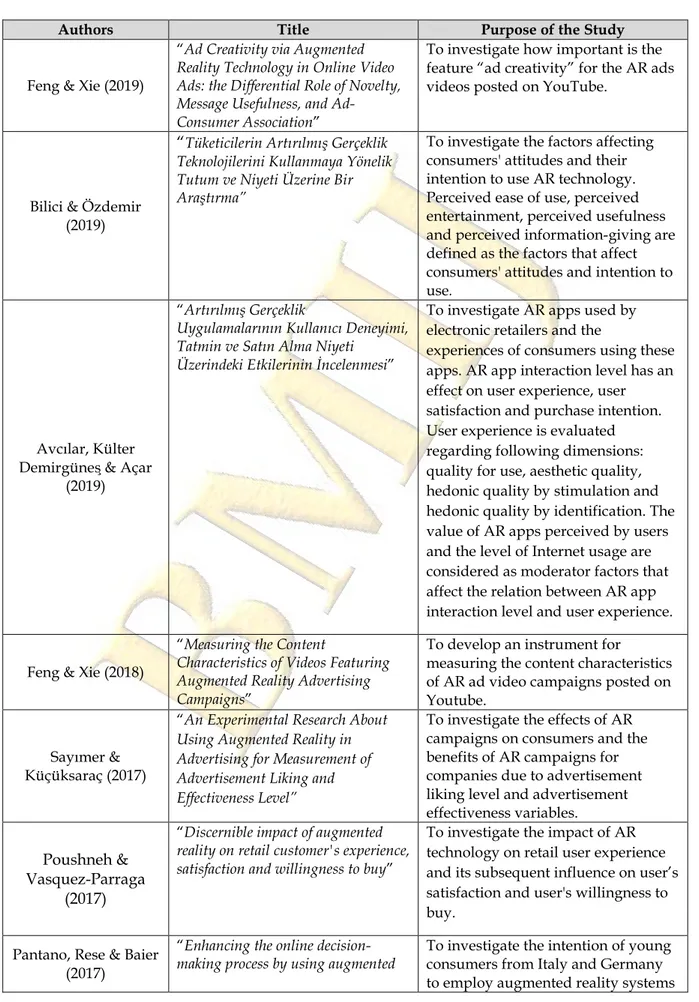
Table 1 includes the list of some prior studies conducted to investigate consumers’ attitudes towards AR advertising and the factors that can have an impact on these attitudes. As is seen in Table 1, some studies of the relevant literature deal with the comparison of AR ads with other ad formats (Sung and Cho, 2012; Yaoyuneyong, Foster, Johnson and Johnson, 2016) and in some studies it is aimed to develop an instrument to evaluate the effect of different content features
(informativeness, novelty, entertainment and complexity) of AR advertising campaign videos uploaded on YouTube on the outcome of successful advertising execution (Feng and Xie, 2018). There are also some studies that discuss the effect of creativity of AR ads (with its subdimensions usefulness, novelty and ad-consumer association) (Feng and Xie, 2019) or the effect of novelty, technological self-efficacy, exposure-time on brand-related issues (e.g. brand attitude, brand message recall) (Hopp and Gangadharbatla, 2016). In the study of Uğur and Apaydın (2014), it is discussed that using AR technology in advertising increases the liking level of ads. Such ads are also defined remarkable, impressive, interesting, enjoyable, unusual and informative. In the study of Avcılar, Külter Demirgüneş and Açar (2019), quality for use, aesthetic quality, hedonic quality by stimulation, and hedonic quality by identification are defined as the factors that affect experiences of consumers that use AR apps. Among these factors the perceived quality for use is determined as the factor which affects the user experience the most. In addition, the perceived aesthetic quality is another important factor for the experience with AR apps. The perceived hedonic quality by stimulation affects users' AR experiences in the third place. The factor which affects users' AR app experiences at least is the perceived hedonic quality by identification. There is a positive effect between experiences gained from AR apps and users’ satisfaction which has a statistically significant and positive effect on consumers’ purchase intention of the product introduced by the AR app. In the study it is expressed that the interaction level with AR apps should be high for a more positive user experience. It is also indicated that users think positively about the experience gained from AR apps, if perceived value of AR apps by users are high. Another result of the study is that users with a high level of Internet use have more positive experiences with AR apps. In their study Bilici and Özdemir (2019) define perceived ease of use, perceived entertainment, perceived usefulness and perceived information-giving as the factors that affect consumers' attitudes and intention to use. In their study Sayımer and Küçüksaraç (2017) indicate that using AR apps in ads have positive impact on likeability and effectiveness of ads. In their study Poushneh and Vasquez-Parraga (2017) discuss that AR influences user experience significantly and positively and that AR-enriched user experience leads to higher user satisfaction and user
willingness to buy. Drawing upon the TAM, Pantano, Rese and Baier (2017) develop a conceptual model which includes besides the traditional constructs of the TAM (e.g. perceived usefulness, perceived ease of use) also new constructs related to the technological characteristics “quality of information”, “aesthetic quality”, “interactivity”, and “response time” of AR systems. The new construct illustrates the intention of young consumers to employ AR systems for supporting their online purchase decision.
Table 1. Studies Concerning AR Technology and Its Impact
on Consumers’ Attitudes
Authors Title Purpose of the Study
Feng & Xie (2019)
“Ad Creativity via Augmented
Reality Technology in Online Video Ads: the Differential Role of Novelty, Message Usefulness, and Ad-Consumer Association”
To investigate how important is the feature “ad creativity” for the AR ads videos posted on YouTube.
Bilici & Özdemir (2019)
“Tüketicilerin Artırılmış Gerçeklik Teknolojilerini Kullanmaya Yönelik Tutum ve Niyeti Üzerine Bir Araştırma”
To investigate the factors affecting consumers' attitudes and their intention to use AR technology. Perceived ease of use, perceived entertainment, perceived usefulness and perceived information-giving are defined as the factors that affect consumers' attitudes and intention to use.
Avcılar, Külter Demirgüneş & Açar
(2019)
“Artırılmış Gerçeklik
Uygulamalarının Kullanıcı Deneyimi, Tatmin ve Satın Alma Niyeti
Üzerindeki Etkilerinin İncelenmesi”
To investigate AR apps used by electronic retailers and the
experiences of consumers using these apps. AR app interaction level has an effect on user experience, user satisfaction and purchase intention. User experience is evaluated regarding following dimensions: quality for use, aesthetic quality, hedonic quality by stimulation and hedonic quality by identification. The value of AR apps perceived by users and the level of Internet usage are considered as moderator factors that affect the relation between AR app interaction level and user experience. Feng & Xie (2018)
“Measuring the Content
Characteristics of Videos Featuring Augmented Reality Advertising Campaigns”
To develop an instrument for
measuring the content characteristics of AR ad video campaigns posted on Youtube.
Sayımer & Küçüksaraç (2017)
“An Experimental Research About
Using Augmented Reality in Advertising for Measurement of Advertisement Liking and Effectiveness Level”
To investigate the effects of AR campaigns on consumers and the benefits of AR campaigns for companies due to advertisement liking level and advertisement effectiveness variables.
Poushneh & Vasquez-Parraga
(2017)
“Discernible impact of augmented
reality on retail customer's experience, satisfaction and willingness to buy”
To investigate the impact of AR technology on retail user experience and its subsequent influence on user’s satisfaction and user's willingness to buy.
Pantano, Rese & Baier (2017)
“Enhancing the online
decision-making process by using augmented To investigate the intention of young consumers from Italy and Germany to employ augmented reality systems
Authors Title Purpose of the Study
reality: A two country comparison of
youth markets” for supporting their online purchase decision.
Hopp & Gangadharbatla
(2016)
“Novelty Effects in Augmented
Reality Advertising Environments: The Influence of Exposure Time and Self-Efficacy”
To better understand AR
Advertising’s uses and limitations by assessing the relation among ad exposure time, novelty effects, technological self-efficacy and brand-based outcomes.
Yaoyuneyong et al. (2016)
“Augmented Reality Marketing:
Consumer Preferences and Attitudes Toward Hypermedia Print Ads”
To compare consumer response to three different ad formats (traditional print ad, QR code hypermedia print ad, AR hypermedia print ad) by utilizing eight constructs (attitude towards ad, informativeness,
entertainment, irritation, advertising value, time-effort, novelty, ad effectiveness).
Uğur & Apaydın (2014)
“Artırılmış Gerçeklik
Uygulamalarının Reklam Beğeni Düzeyi Üzerindeki Etkileri”
To investigate the effect of the use of AR in advertisements on the ad liking level.
Sung & Cho (2012)
“User Experiences with Augmented
Reality Advertising Applications: Focussing on Perceived Values and Telepresence Based on the
Experiential Learning Theory”
To investigate differences in the main features (entertainment,
informativeness, interactivity) and telepresence between AR and 2D advertising.
The aim of this cross-country study is to investigate how AR ad features (informativeness, entertainment, novelty, interactivity), possible disadvantages of AR technology (irritation, deceptiveness) and self-efficacy of consumers affect consumers’ perceptions concerning AR ad value that affects consumers’ attitudes towards AR ads.
4. RESEARCH MODEL AND HYPOTHESES
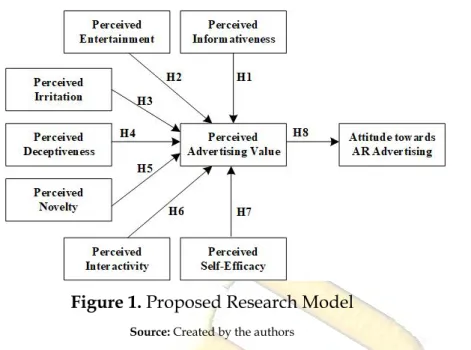
The proposed research model in Figure 1 is an enhancement of the model developed in the study of Bayrak Meydanoğlu and Klein (2019) with the variables “novelty”, “deceptiveness” and “technological self-efficacy”.
Figure 1. Proposed Research Model
Source: Created by the authors
Among previous studies on advertising perceptions, there are two different approaches explaining “advertising value” and “advertising attitude”. According to some studies (e.g., Alwitt and Prabhaker, 1994; Chen and Wells, 2000; Bezjian, Calder and Iacobucci 1998), there is no difference between these two constructs. Indeed, there are some studies that consider value and attitude as separate constructs (e.g., Ducoffe, 1995; Ducoffe, 1996; Brackett and Carr, 2001). According to them, attitude towards advertising is an affective construct (Mitchell and Olson, 1981; Shimp, 1981) that represents whether consumers develop favorable or unfavorable attitudes towards advertising (Ducoffe 1995) and evaluates the likeability of ads. Advertising value, on the other hand, is a cognitive construct. Ducoffe (1995, p. 1) defines advertising value as a “subjective evaluation of the relative worth or utility of advertising to consumers. It
respresents the perceived value of advertising to consumers”. To better understand the
influence of advertising, Ducoffe (1995) proposes to separate emotional effects and cognitive evaluation. Advertising value and advertising attitude are considered also in this study as separate constructs.
Ducoffe (1995, 1996) defines four constructs “informativeness”, “entertainment”, “irritation” and “deceptiveness” as the antecedents of the construct “advertising value”.
Informativeness means providing consumers valuable, useful information. There are many studies suggesting that advertisements with a higher content of
information about a product are better accepted by consumers (Ducoffe, 1996; Haghirian and Madlberger, 2005; Rotzoll, Haefner and Sandage, 1989). AR ads, like the Absolut’s AR ad defined above, are likely to deliver consumers useful information (Suang and Cho, 2012). Ads that fulfill informational needs of consumers are more likely to be approved by consumers (Ducoffe, 1995). In this context, the following hypothesis is proposed:
H1: Perceived informativeness of AR ads has a positive effect on perceived advertising value. “Entertainment denotes the ability to fulfill consumers’ needs for diversion, esthetic
enjoyment or emotional release” (McQuail, 1983). Consumers are likely to be positively
affected by entertaining advertisements (Javadi, Amirosadat, Balochiyan and Liravi 2012; Liu, Sinkovics, Pezderka and Haghirian 2012; Pollay and Mittal, 1993) like the entertaining AR ads of Pepsi and Coca-Cola defined above. On this account the following hypothesis is proposed:
H2: Perceived entertainment of AR ads has a positive effect on perceived advertising value. Irritation refers to “the extent to which the advertising message is messy and irritating
to consumers” (Kim and Han 2014, p. 257). Commonly, obtrusive, insulting and
annoying advertisements irritate consumers (Ducoffe, 1996; Javadi et al., 2012). AR ads with irritating content/message are likely to reduce the advertising value. For instance, sexist ads like the Lynx AR ad defined above might be specified irritation. Thus, it can be hypothesized:
H3: Perceived irritation of AR ads has a negative effect on perceived advertising value.
Consumers place an important value on credible advertising messages. Deceptiveness of an ad is likely to decrease its perceived value (Ducoffe, 1995). AR ads with deceptive content/message might reduce the perceived value of ads. Thus, the following hypothesis is proposed:
H4: Perceived deceptiveness of AR ads has a negative effect on perceived advertising value. Besides the defined constructs above, the constructs “interactivity”, “novelty” and “technological self-efficacy” are also considered as the other antecedents of the advertising value in this study. According to Sheinin, Varki and Ashley (2011) novelty
is a feature that represents the extent to which an ad diverges from consumers’ expectations (e.g. unusual and surprising) and how it identifiably differs from other ads with its unique, new, unfamiliar features (Hopp and Gangadharbatla, 2016). Studies (e.g. Brown, 2002; Edwards and Gangadharbatla, 2001) show that those who perceive an ad as novel are more likely to evaluate the ad positively. “New innovative
mediums such as AR technology improve ad effectiveness by creating a novelty effect that attracts consumers’ attention and creates more favorable attitudes toward the ad
(Yaoyuneyong et al. 2016, p. 21).” For instance, the AR ads of Pepsi and Coca-Cola defined above differ from common, familiar ad campaigns. On this account, the following hypothesis is proposed:
H5: Perceived novelty of AR ads has a positive effect on perceived advertising value.
The term interactivity is seen in many studies as an element that has an impact on consumers’ attitudes and perceptions on advertising value (e.g. Cho and Leckenby, 1999; Wang, 2005; Wu, 1999). AR ads like the Coca-Cola’s “drinkable” AR ad or the AR ad of Lynx can provide users interactive experience. Interactivity can enhance user engagement (Sung and Cho, 2012) and contribute positively to perceived ad value. In this context, the level of interactivity experienced with an AR ad is also an important factor that affects consumers' perceptions on the ad value. Therefore, the following hypothesis is proposed:
H6: Perceived interactivity of AR ads has a positive effect on perceived advertising value. McDonald and Siegall (1992, p. 467) define technological self-efficacy as “the
belief in one’s ability to perform a technologically sophisticated new task”. Particularly
interactive AR ads such as the ads of Absolut or Coca-Cola require consumers to carry out some technological actions such as downloading an app, scanning a tag etc. Since tech-savvy consumers will most probably have the necessary knowledge to interact with an AR ad, they will have no backwardness and feel confident about successfully accomplishing the requirements for interaction. On the other hand, consumers without self-efficacy are likely not to feel confident about interacting with an AR ad. Thus, the following hypothesis is proposed:
An advertisement is defined as ineffective, if it is ignored or dismissed by consumers. This reduces the advertising value which is the sign of the failure of communication exchange. Advertising value refers to the value of an ad from the customers' point of view. In order to draw consumers' attention, it is essential to create an ad that is useful and valuable for consumers. It is likely that such an ad affects consumers' attitudes positively towards ad (Javadi et al., 2012). An ad without a value for the consumer is likely to cause consumer to create a negative attitude towards that ad (Ducoffe, 1996). In this context, it can be concluded that an AR ad with high perceived ad value is likely to affect consumers' attitudes towards AR ad positively. (Liu et al., 2012). Thus the following hypothesis is proposed:
H8: AR advertising value has a positive effect on consumers’ attitudes towards AR advertising. In the previous studies related to consumers’ attitudes towards advertisement (e.g. Bracett and Carr, 2001; Ertekin and Pelton, 2014; Tsang, Ho and Liang, 2004; Feng and Xie, 2018; Cho and Leckenby, 1999; Wang, 2005; Wu, 1999), some other variables (e.g. informativeness, irritation, credibility, entertainment, interactivity, relevant demographics) than the variable “ad value” are also considered as factors that affect attitude towards ad. Since the aim of this study is to investigate only the effect of the perceived ad value on consumers’ attitudes, the other variables defined in the literature were not included in the proposed research model.
5. RESEARCH METHODOLOGY
In order to test the hypothesized model, in December 2019 an online survey in Germany and an online survey in Turkey were conducted. Due to cost and time constraints, the questionnaire used in the study could not be applied to all consumers in Turkey and Germany and a non-random convenience sampling was used. Since the data used in this study were acquired from the surveys conducted before 2020, no ethic committee permission document was attached. The data include Likert scale AR attitude and perception questionnaires as well as some demographic questions respectively from Turkey and Germany. German interviewees are students from a German university in Germany who are studying commonly Business Administration or Economics. Although few in number, students who are studying Engineering, Law
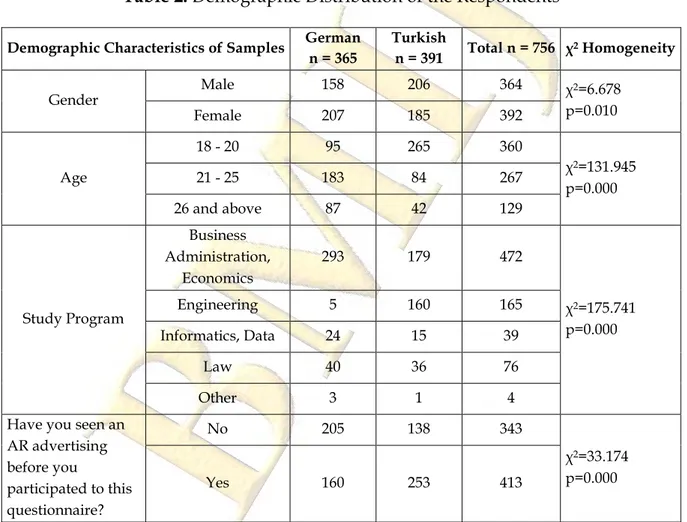
or Informatics or another program, also exist among German interviewees. Turkish interviewees are students, who are commonly studying Business Administration or Economics or Engineering from a Turkish university in Istanbul. According to Wolburg and Pokrywczynski (2001), students are prone to accept new products quickly as they are young. That’s why it was thought that AR ads are more likely distinguished first by the youth. In this sense university students were considered as samples in the study. Table 2 summarizes the demographic characteristics of the German and Turkish samples.
Table 2. Demographic Distribution of the Respondents Demographic Characteristics of Samples German
n = 365 Turkish n = 391 Total n = 756 χ2 Homogeneity Gender Male 158 206 364 χ2=6.678 p=0.010 Female 207 185 392 Age 18 - 20 95 265 360 χ2=131.945 p=0.000 21 - 25 183 84 267 26 and above 87 42 129 Study Program Business Administration, Economics 293 179 472 χ2=175.741 p=0.000 Engineering 5 160 165 Informatics, Data 24 15 39 Law 40 36 76 Other 3 1 4
Have you seen an AR advertising before you participated to this questionnaire? No 205 138 343 χ2=33.174 p=0.000 Yes 160 253 413
The questionnaire was developed first in English language. English version was applied to German interviewees. It was then translated into Turkish in order to apply to Turkish interviewees. The questionnaire consisted of two parts:
The first part includes 28 questions corresponding to each construct in the proposed research model.
The second part includes questions corresponding gender, age of the respondents and the program in which the respondents study as well as questions concerning whether the respondents have ever seen an AR ad.
Except responses to the items in the second part of the questionnaire, responses to the remaining items were measured using a five-point Likert scale anchored between 1 (strongly disagree) and 5 (strongly agree) with reverse coding of unfavorable statements. The questionnaire was pretested among 20 users with the intention to establish the intended referential and connotative meaning of each question, to agree a set of criteria for judging the appropriateness of survey questions, to select the methods for judging appropriateness and undertaking research, and to review the questions for inclusion, revision (the question or intended meaning) or exclusion (Bowden et.al., 2002). The researchers undertook these interviews and used them just for the mentioned purposes instead of using an exploratory principal component analysis. Based on the feedbacks from these users, some items were revised to make their meaning more accurate and clear. The items listed below were adopted from previous studies:
Items concerning informativeness were adopted from Feng and Xie (2018). Items of the variable “entertainment” were adopted from Ducoffe (1995) and Brackett and Carr (2001).
Items concerning irritation were adopted from Brackett and Carr (2001), Feng and Xie (2018).
One item of the deceptiveness was adopted from Ducoffe (1995).
Items concerning novelty were adopted from Sheinin et al. (2011), Feng and Xie (2018).
Items concerning interactivity were adopted from Wang (2005).
Items concerning advertising value were adopted from Ducoffe (1995), Brackett and Carr (2001).
Items concerning consumers’ attitudes towards ad were adopted from Feng and Xie (2018), Wang (2005).
6. DATA ANALYSIS AND RESEARCH RESULTS
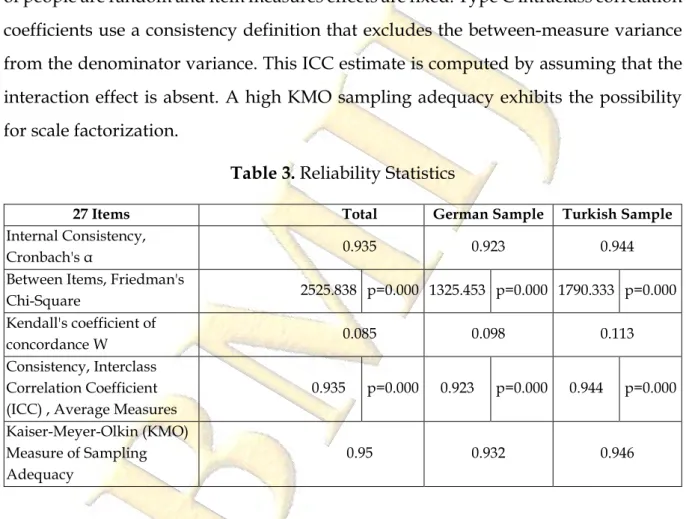
Table 3 shows the reliability statistics of the scale. Both samples provide a high internal reliability measured with Cronbach’s α coefficient. Responds to the items differ significantly for each respondent. This means that respondents are conscious and they do not have similar mindset. This is also supported by the low Kendall’s concordance coefficient. Two-way mixed effects model is suggested where the effects of people are random and item measures effects are fixed. Type C intraclass correlation coefficients use a consistency definition that excludes the between-measure variance from the denominator variance. This ICC estimate is computed by assuming that the interaction effect is absent. A high KMO sampling adequacy exhibits the possibility for scale factorization.
Table 3. Reliability Statistics
27 Items Total German Sample Turkish Sample
Internal Consistency,
Cronbach's α 0.935 0.923 0.944
Between Items, Friedman's
Chi-Square 2525.838 p=0.000 1325.453 p=0.000 1790.333 p=0.000 Kendall's coefficient of
concordance W 0.085 0.098 0.113
Consistency, Interclass Correlation Coefficient (ICC) , Average Measures
0.935 p=0.000 0.923 p=0.000 0.944 p=0.000 Kaiser-Meyer-Olkin (KMO)
Measure of Sampling Adequacy
0.95 0.932 0.946
The structured questionnaire presented a high internal consistency 0.923-0.944 and a value more than sufficient factorization adequacy 0.932-0.950 for the independent samples. The low level of concordance indicates that the items were not responded randomly or the items do not measure the same concept and the responses were not fulfilled with same options.
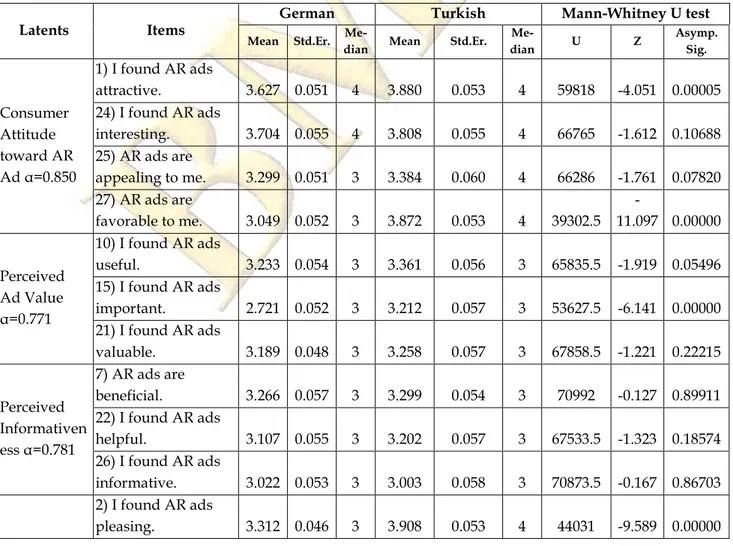
In Table 4 the latent variables and the items are summarized with their means, medians and standard errors separately according to the country. Furthermore, Mann-Whitney U test was conducted for the univariate item comparisons between the two
countries. Mann-Whitney U test is a non-parametric test which is not requiring normality for variable distribution. U statistics are calculated based on rank order. When the sample volume is large enough, the standard normal Z conversion and the critical value are compared (Çilingirtürk, 2011). There is a significant difference, if the probability of tail (significance or p-value) is less than 0.05. German and Turkish distributions differ significantly for most of the items according to Mann-Whitney U test.
The item based descriptive statistics show a significant profile difference for German and Turkish respondents. Eleven items indicate a similarity between the samples out of 27 items according to Mann-Whitney–U tests results. These findings represent that AR ads are as interesting, appealing, entertaining, useful, valuable, beneficial, helpful, informative and incredible at 5% level of significance and offer a vivid communication and interaction experience as well.
Table 4. Summary Statistics and Country-wise Comparison of Responses to Items
Latents Items German Turkish Mann-Whitney U test
Mean Std.Er. dian Me- Mean Std.Er. dian Me- U Z Asymp. Sig.
Consumer Attitude toward AR Ad α=0.850 1) I found AR ads attractive. 3.627 0.051 4 3.880 0.053 4 59818 -4.051 0.00005 24) I found AR ads interesting. 3.704 0.055 4 3.808 0.055 4 66765 -1.612 0.10688 25) AR ads are appealing to me. 3.299 0.051 3 3.384 0.060 4 66286 -1.761 0.07820 27) AR ads are favorable to me. 3.049 0.052 3 3.872 0.053 4 39302.5 -11.097 0.00000 Perceived Ad Value α=0.771 10) I found AR ads useful. 3.233 0.054 3 3.361 0.056 3 65835.5 -1.919 0.05496 15) I found AR ads important. 2.721 0.052 3 3.212 0.057 3 53627.5 -6.141 0.00000 21) I found AR ads valuable. 3.189 0.048 3 3.258 0.057 3 67858.5 -1.221 0.22215 Perceived Informativen ess α=0.781 7) AR ads are beneficial. 3.266 0.057 3 3.299 0.054 3 70992 -0.127 0.89911 22) I found AR ads helpful. 3.107 0.055 3 3.202 0.057 3 67533.5 -1.323 0.18574 26) I found AR ads informative. 3.022 0.053 3 3.003 0.058 3 70873.5 -0.167 0.86703 2) I found AR ads pleasing. 3.312 0.046 3 3.908 0.053 4 44031 -9.589 0.00000
Latents Items German Turkish Mann-Whitney U test
Mean Std.Er. dian Me- Mean Std.Er. dian Me- U Z Asymp. Sig. Perceived Entertainme nt α=0.845 9) I found AR ads enjoyable. 3.811 0.053 4 3.944 0.056 4 64434 -2.426 0.01528 17) I found AR ads entertaining. 3.929 0.052 4 3.862 0.053 4 69172 -0.774 0.43881 Perceived Irritation α=0.788 3) I found AR ads annoying. 3.466 0.057 4 4.202 0.052 4 42253.5 -10.182 0.00000 11) I found AR ads irritating. 3.370 0.053 4 4.366 0.044 5 32055.5 -13.736 0.00000 16) I found AR ads disturbing. 3.627 0.052 4 4.274 0.048 5 44012 -9.596 0.00000 Perceived Deceptivene ss α=0.689 4) I found AR ads not credible. 3.247 0.050 3 3.345 0.059 3 65759 -1.951 0.05112 12) I found AR ads misleading. 3.488 0.051 4 3.642 0.059 4 63940 -2.566 0.01028 18) I found AR ads deceptive. 3.216 0.043 3 3.762 0.055 4 46996.5 -8.510 0.00000 Perceived Novelty α=0.808 5) I found AR ads novel. 3.395 0.048 3 3.829 0.057 4 51526.5 -6.895 0.00000 8) I found AR ads creative. 4.222 0.052 4 4.102 0.049 4 64805 -2.354 0.01858 13) I found AR ads original. 3.677 0.049 4 3.898 0.053 4 60468 -3.804 0.00014 19) I found AR ads inventive. 3.721 0.049 4 3.847 0.051 4 65003 -2.236 0.02537 Perceived Interactivity α=0.570 6) I think AR ads provide high degree of cognitive
involvement. 3.501 0.052 4 3.010 0.061 3 54315.5 -5.878 0.00000 14) I think AR ads
can offer a vivid communication experience. 3.625 0.049 4 3.629 0.058 4 69019 -0.815 0.41492 Perceived Self-Efficacy α=0.703 20) I would feel confident to interact with an AR ad. 3.205 0.055 3 3.302 0.062 3 66973.5 -1.510 0.13092 23) I would feel confident to download an app and use it to interact
with an AR ad. 2.847 0.065 3 3.049 0.064 3 65201.5 -2.103 0.03550 Due to sample inductions, Turkish respondents find AR advertisements significantly more attractive, favorable, important, pleasing, enjoyable, novel, creative,
original, inventive, cognitive involving and interactive as well as less irritating, annoying, disturbing, misleading and deceptive than German respondents.
Except perceived deceptiveness and perceived interactivity, most of the subdimensions of the scale have a Cronbach’s α level above 70% for the whole sample regardless of a grouping according to the country in which the respondents live.
The data was analyzed through STATA SEM generalized multilevel structural equation modeling procedure (StataCorp, 2013; Rabe-Hesketh, Skrondal and Pickles, 2004) which is a broad estimation tool from simple correlation matrices to generalized linear models and multiple equation systems. The maximum likelihood, quasi maximum likelihood with robust variance component and asymptotic distribution free bootstrap are the available estimation methods. The latent endogeneous variables, the latent exogenous variables, the endogenous measured items and their error terms are independently and identically distributed with mean vector μ and covariance matrix Σ. The jointly normal distribution assumption is not strictly necessary and can be relaxed when deriving the standard linear SEM. Covariance between latent exogenous variables are assumed to be nonzero and estimated. The procedure assumes the exogeneous latent variables which are correlated to each other. The first path coefficients were set to 1 due to normalization constraints for the first and second order latent factors.The fit model has the following form for j=1,2,…, p number of variable and i=1,2,…, n number of equation:
𝑌𝑌 = 𝐵𝐵𝑌𝑌 + Γ𝑋𝑋 + 𝛼𝛼 + 𝜁𝜁
where Β = �𝛽𝛽𝑖𝑖𝑖𝑖� is the matrix of coefficients of endogeneous variables, Γ = �𝛾𝛾𝑖𝑖𝑖𝑖� is the
matrix of coefficients on exogenous variables, α = [𝛼𝛼𝑖𝑖] is the vector of intercepts on
endogenous variables, and ζ is the residual with zero mean and unrelated with exogenous variables. Σ is the variance V(Z) of the vector of all the variables Z=(Y X)’ and θ is the vector of all unique model parameters. Under the assumption of multivariate normal distribution, the likelihood function is the sum of weights ω
where Σ0 is the submatrix of V(Z) corresponding to the observed variables (Bollen, 1989).
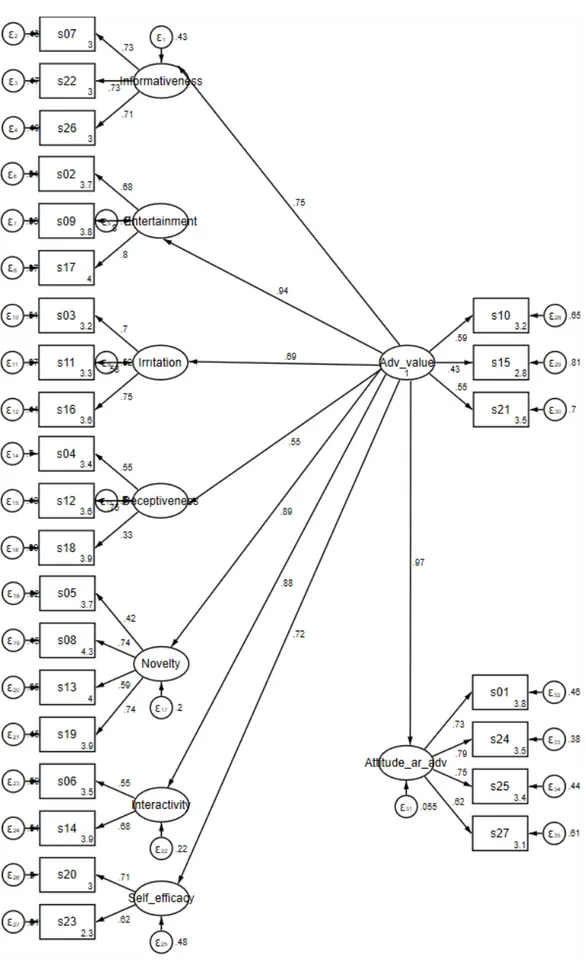
The model was estimated with Maximum Likelihood method for the German respondents’ data. However the hypothesized model does not fit the Turkish respondents’ data. Figure 2 represents the structural equation model and the estimated standardized effect coefficients for German respondents which are all statistically significant below 1%.
All the scale items except of the items related to the attitude towards AR advertising measure perceived advertising value and its subdimensions “perceived informativeness”, “perceived entertainment”, “perceived irritation”, ”perceived deceptiveness”, “perceived novelty”, “perceived interactivity” and “perceived self-efficacy”. Perceived advertising value affects the attitude towards AR advertising of the individuals, which is confirmed by the marketing theory and applications.
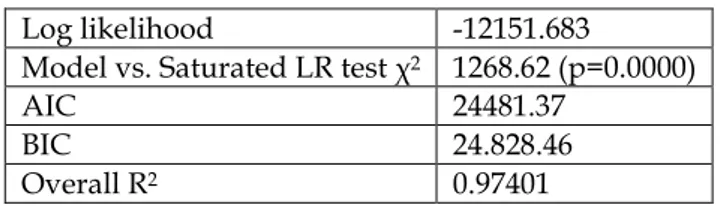
The summary statistics of the model is given in Table 5. They are used for comparing the purposes of different models with the same estimation technique and having the same mathematical structure of the dependent endogenous variables like Akaike and Bayesian Information Criteria, Log-likelihood and determination
coefficient. The chi-square test (χ2 =1268.62) indicates the model’s statistical
significance. These statistics are used to compare the models estimated from German and Turkish samples.
Table 5. Model Summary Statistics and Goodness-of-Fit
Log likelihood -12151.683
Model vs. Saturated LR test χ2 1268.62 (p=0.0000)
AIC 24481.37
BIC 24.828.46
Overall R2 0.97401
The advertising value affects the attitude towards AR advertising at the same level as itself according to that the standardized coefficient (0.97) is more than its indicators (0.62 – 0.79). The superior component advertising value affects its subcomponents at different levels (0.55-0.94). The advertising value affects mostly the perceived entertainment of AR ads (0.94) together with the novelty and interactivity (0.88-0.89) among others. The indicators of irritation and entertainment have noticeably differentiated judgments (above 0.75). These findings are also supported with the determination coefficients of related sub-equations of the model.
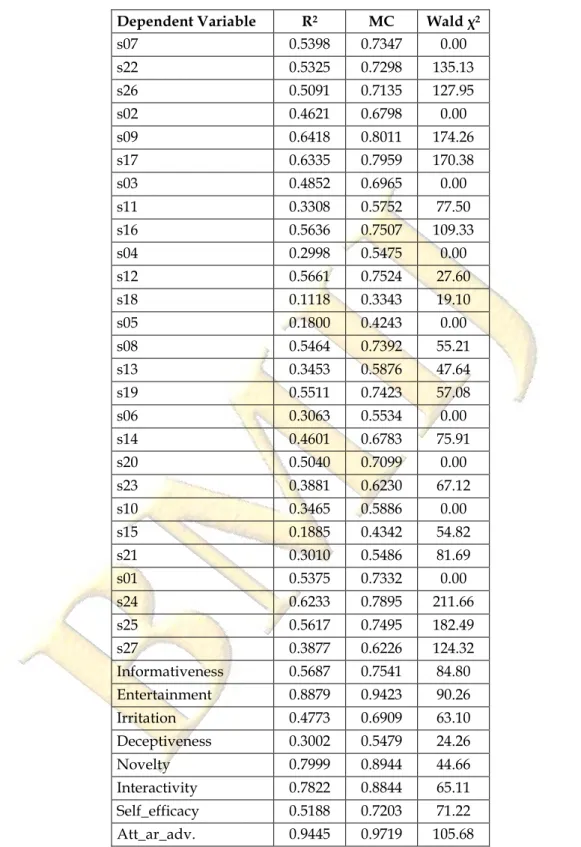
The model consists of several equations explaining the exogenous variables. These are also hypothesized through the theoretical model. The equation level goodness of fit statistics are presented in Table 6.
Table 6. Equation Level Goodness-of-Fit Statistics
Dependent Variable R2 MC Wald χ2
s07 0.5398 0.7347 0.00 s22 0.5325 0.7298 135.13 s26 0.5091 0.7135 127.95 s02 0.4621 0.6798 0.00 s09 0.6418 0.8011 174.26 s17 0.6335 0.7959 170.38 s03 0.4852 0.6965 0.00 s11 0.3308 0.5752 77.50 s16 0.5636 0.7507 109.33 s04 0.2998 0.5475 0.00 s12 0.5661 0.7524 27.60 s18 0.1118 0.3343 19.10 s05 0.1800 0.4243 0.00 s08 0.5464 0.7392 55.21 s13 0.3453 0.5876 47.64 s19 0.5511 0.7423 57.08 s06 0.3063 0.5534 0.00 s14 0.4601 0.6783 75.91 s20 0.5040 0.7099 0.00 s23 0.3881 0.6230 67.12 s10 0.3465 0.5886 0.00 s15 0.1885 0.4342 54.82 s21 0.3010 0.5486 81.69 s01 0.5375 0.7332 0.00 s24 0.6233 0.7895 211.66 s25 0.5617 0.7495 182.49 s27 0.3877 0.6226 124.32 Informativeness 0.5687 0.7541 84.80 Entertainment 0.8879 0.9423 90.26 Irritation 0.4773 0.6909 63.10 Deceptiveness 0.3002 0.5479 24.26 Novelty 0.7999 0.8944 44.66 Interactivity 0.7822 0.8844 65.11 Self_efficacy 0.5188 0.7203 71.22 Att_ar_adv. 0.9445 0.9719 105.68
The latent endogeneous variables perceived entertainment, novelty, interactivity is determined highly by the broad concept of perceived advertising value. The determination coefficients R2 of perceived informativeness, irritation,
latent variables explain medium level of the observed items. The multiple correlations (MC) are Bentler-Raykov coefficients between dependent variables and its predictions (Bentler and Raykov, 2000). The equations are statistically significant according to Wald statistics.
7. CONCLUSION, DISCUSSION, MANAGERIAL IMPLICATIONS, LIMITATIONS OF THE STUDY AND FUTURE RESEARCH
As mentioned above, consumers’ attitudes towards AR ads are important for the efficacy of ads. Advertising value perceived by consumers affects their attitudes towards ads. In this study, a research model was proposed to investigate the relationship between consumer attitude and perceived ad value as well as to investigate the factors affecting the perceived ad value. The proposed model was then tested via SEM analysis for Turkish and German respondents to understand cross-national differences in the perception of the value of AR ads and consumers’ attitudes towards these ads. Contrary to expectations, the proposed research model as a whole was found out not to be significant for Turkish consumers. The model might have been supported statistically for Turkish consumers, if the number of scale items were increased through some new items or if some variables were removed from the proposed research model. The proposed model was found out to be significant as a whole for German consumers. All the proposed hypotheses in the study were supported for the German sample.
Chen (1995) argues that scales developed for western cultures do not work well for eastern culture. This finding might be one of the possible reasons for explaining why the hypotheses were supported for the German sample, but not for the Turkish sample. McCort and Malhotra (1993) argue that nearly every construct that draws the attention of marketers is perceived differently in different cultures. Cultural discrepancies between German and Turkish consumers might also be a reason for the fitting of the proposed research model for Germany, but not for Turkey.
In Germany, which is one of the pioneer countries for the emerging and development of the concept of Industry 4.0 (Duran, 2018), an intensive research is carried out on current technologies such as cloud computing, big data, artificial
intelligence, smart systems, block chain, and Augmented Reality, that constitute important elements of Industry 4.0. Consumers in highly developed countries like Germany, where the implementation of digital transformation and Industry 4.0 is more advanced due to the determined and applied government policies and intensive researches (Nuroğlu & Nuroğlu, 2018), are likely to be exposed more often to new technological applications compared to consumers in developing countries like Turkey. In the study of Şahinli and Kılınç (2013) it is expressed that in terms of innovation performance EU countries especially Germany is ahead of Turkey. It is much more possible that consumers of such a country (especially young consumers who are technology-driven and open to innovation) are aware of new technologies, their benefits and disadvantages for users than consumers of developing countries like Turkey. In this context, German consumers compared to Turkish consumers might be more aware about the advantages (such as informativeness, entertainment, novelty, interactivity) and the disadvantages (such as irritation, deceptiveness) of AR ads. As a result of this, they might have filled out the questionnaire more aware compared to Turkish respondents and perceived AR ads more valuable.
Certainly, personal exposure to advertising has an important effect on the perception of consumers related to AR ad value, its antecedents and on consumers’ attitudes towards ads. Although most of the Turkish consumers stated that they have seen AR ads before, they might have seen or watched them on various platforms (e.g. AR ad videos posted on YouTube), but might not actually have been self-exposed to these ads. This might have caused them to answer the questions in the questionnaire with a low awareness and that the value of AR ads to be perceived not sufficiently accurate and precise.
This study contributes to the relevant literature by proposing a theoretical hypothetical model that can be used to identify the impact of AR technology used in advertising on consumers’ attitudes towards ads which is an important factor to evaluate the efficacy of ads. The results of the study can also be used in developing marketing strategies by companies in Turkey and Germany. Since the proposed research model fits for German consumers, the results can shed light on using AR technology effectively in their campaigns for AR ad campaign designers in Germany.
The surprising results of the study in terms of Turkish consumers reveal for AR ad campaign designers in Turkey that something working in a developed country like Germany might not work in a developing country like Turkey. This has to be considered while developing ad campaigns and marketing strategies.
In spite of the interesting results of this study, some limitations and need for additional research are also recognized. Due to the sampling method, the results are limited regarding generalizability. In a future research, questionnaires can be applied across Turkey and Germany. The sample size can be increased. Moreover, unlike this study, the questionnaire can be applied not only to young consumers, but a wider age range for consumers can be considered. If the same results come out again that Turkish consumers do not act in accordance with the model, it will strengthen the justification above.
A future study can be conducted to find out why the proposed research model did not fit and the hypotheses were not supported for Turkish consumers.
Through revising the proposed research model in this study by adding or eliminating some constructs or through revising the questionnaire used in this study by adding some new items for some constructs and reapplying the revised questionnaire, studies can be conducted to search whether a model can be proposed that fits for Turkish consumers.
AR technology is a novel technology. Consumers’ perceptions related to the value of AR ads and their attitudes towards these ads may still be developing. In the future, longitudinal studies can also be conducted to watch this development.
REFERENCES
Alwitt, L. F., & Prabhaker, P. R. (1994). Identifying Who Dislikes Television Advertising: Not By Demographics Alone. Journal of Advertising Research, 34(6), 17-29.
Avcılar, M.Y., Külter Demirgüneş, B. & Açar, M.F. (2019). Artırılmış Gerçeklik Uygulamalarının Kullanıcı Deneyimi, Tatmin Ve Satın Alma Niyeti Üzerindeki Etkilerinin İncelenmesi. Pazarlama
ve Pazarlama Araştırmaları Dergisi, 24, 235-271.
Azuma, R., Behringer, R., Julier, S., & Macintyre, B. (2001). Recent advances in augmented reality. IEEE
Comput. Graph. Appl., 21, 34–47.
Baratalı, E., Bin Abd.Rahim, M. H., Parhizkar, B., & Gebril, Z. M. (2016). Effective of Augmented Reality (AR) in Marketing Communication: A Case Study on Brand Interactive Advertising.
International Journal of Management and Applied Science, 2(1), 133-137.
Bayrak Meydanoğlu, E. S., & Klein, M. (2019). Factors Affecting Consumers’ Perceived Advertising Value Regarding AR Ads. In Böhm, S. and Suntrayuth, S. (Eds.), Proceedings of IWEMB 2017
(First International Workshop on Entrepreneurship in Electronic and Mobile Business 2017),
Publiqation, Norderstedt.
Bezjian, A., Calder, B., & Iacobucci, D (1998). New Media Interactive Advertising vs. Traditional Advertising. Journal of Advertising Research, 38(4), 23-51.
Bentler, P.M., & Raykov, T. (2000). On measures of explained variance in nonrecursive structural equation models. Journal of Applied Psychology, 85, 125-131.
Bilici, F., & Özdemir, E. (2019). Tüketicilerin Artırılmış Gerçeklik Teknolojilerini Kullanmaya Yönelik Tutum ve Niyeti Üzerine Bir Araştırma. Business & Management Studies: An International
Journal, 7(5), 2011-2033.
Bollen, K.A. (1989). Structural Equations with Latent Variables. New York, Wiley.
Brackett, L. K., & Carr, B. N. (2001). Cyberspace Advertising vs. Other Media: Consumer vs. Mature Student Attitudes. Journal of Advertising Research, 41(5), 23-33.
Brown, M. (2002). The Use of Banner AdvertisementsWith Pull-DownMenus: A Copy Testing Approach. Journal of Interactive Advertising, 2, 57–65.
Bowden, A., Fox-Rushby, J., Nyandieka, L. and Wanjau, J. (2002). How to do (or not to do) ... Methods for pre-testing and piloting survey questions: illustrations from the KENQOL survey of health-related quality of life. Health Policy And Planning, 17(3): 322–330.
Caula, R. (2014). Augmented reality bus shelter by pepsi max creates unbelievable scenarios. Retrieved (April 2019): https://www.designboom.com/technology/augmented-reality-bus-shelter-pepsi-max-03-24-2014
Catchoom (2017). 15 Cool Augmented Reality Advertising Campaigns. Retrieved (December 2019): https://catchoom.com/blog/15-cool-augmented-reality-advertising-campaigns/
Carmigniani, J., & Furht, B. (2011). Augmented reality: an overview. In Handbook of augmented reality (pp. 3-46). Springer, New York, NY.
Chen, C. P. (1995). Counseling applications of RET in a Chinese cultural context. Journal of
Rational-Emotive and Cognitive-Behavior Therapy, 13(2), 117-129.
Chen, Q., & Wells, W. D. (2000). A New Look at Traditional Measures: Attitude toward the Site. In
Proceedings of the 2000 Conference of the American Academy of Advertising, April 14-17. Newport,
Rhode Island, 231.
Cho, C-H., & Leckenby, J. D. (1999). Interactivity as a Measure of Advertising Effectiveness. In
Proceedings of American Academy of Advertising, Albuquerque, New Mexico, 162-169
Condon, K. (2015). Coke Zero™ Tips Off Drinkable Advertising Campaign at NCAA® Men’s Final
https://www.businesswire.com/news/home/20150402005915/en/Coke-Zero%E2%84%A2-Tips-Drinkable-Advertising-Campaign-NCAA%C2%AE%C2%A0Men%E2%80%99s
Çilingirtürk, A. M. (2011). İstatistiksel Karar Almada Veri Analizi. Ankara, Seçkin Yayınları.
De Paolis, L. T., & Aloisio, G. (2010). Augmented Reality in Minimally Invasive Surgery in Mukhopadhyay. In S. C. & Lay-Ekuakille, A. (Eds.), Advances in Biomedical Sensing,
Measurements, Instrumentation and Systems. Berlin, Heidelberg: Springer, 305-320.
DigitalBuzz (2011). Lynx: Augmented Reality Angel Ambush. Retrieved (December 2019): digitalbuzzblog.com/lynx-augmented-reality-excite-angel-ambush-london-victoria/
Ducoffe, R. H. (1995). How Consumers Assess the Value of Advertising. Journal of Current Issues and
Research in Advertising, 17, 1-18.
Ducoffe, R. H. (1996). Advertising value and advertising on the web. Journal of Advertising Research, 36 (5), 21-35.
Duran, A. (2018). Dünyada Endüstri 4.0’a Öncülük Eden 3 Ülke: Almanya, ABD ve Japonya. Retrieved (March 2020): https://magg4.com/dunyada-endustri-4-0a-onculuk-eden-3-ulke-almanya-abd-ve-japonya/
Edwards, S., & H. Gangadharbatla, (2001). The Novelty of 3D Product Presentations Online. Journal of
Interactive Advertising, 2, 10–18.
Ertekin, S., & Pelton, L.E. (2014). Raising the bar for consumer engagement: qualitative investigation of attitude for quick response codes in magazine advertisements. Journal of Marketing Development
and Competitiveness, 8(3), 84-94.
Feng, Y., & Xie, Q. (2018). Measuring the content characteristics of videos featuring augmented reality advertising campaigns. Journal of Research in Interactive Marketing, 12(4), 489-508.
Feng, Y., & Xie, Q. (2019). Ad Creativity via Augmented Reality Technology in Online Video Ads: the Differential Role of Novelty, Message Usefulness, and Ad-Consumer Association. Journal of
Promotion Management, 25(6), 907-933, DOI:10.1080/10496491.2018.1536624
Gaudiosi, J. (2015). How augmented reality and virtual reality will generate $150 billion in revenue by 2020. Retrieved (September 2017): http://fortune.com/2015/04/25/augmented-reality-virtual-reality/ Göçmen, P. Ö. (2018). Artırılmış Gerçeklik Uygulamaları ile Yeni Medya Reklam Tasarımı. Sanat ve
Tasarım Dergisi, (22), 175-191.
Haghirian, P., & M. Madlberger (2005). Consumer Attitude Toward Advertising via Mobile Devices: An Empirical Investigation among Austrian Users. In Proceedings of the 13th European Conference on
Information Systems (ECIS 2005), May 26-28. Germany: Regensburg, 447-458.
Hopp, T., & Gangadharbatla, H. (2016). Novelty effects in augmented reality advertising environments: the influence of exposure time and self-efficacy. Journal of Current Issues and Research in
Advertising, 37(2), 113-130.
Javadi, M. H. M., Amirosadat, N., Balochiyan, R., & Liravi, F. (2012). Factors in Fluencing Users Attitude Toward Mobile Advertising In The City of Isfahan. Australian Journal of Basic and Applied
Sciences, 6(9), 78-84.
Javornik, A. (2016). Augmented reality: Research agenda for studying the impact of its media characteristics on consumer behaviour. Journal of Retailing and Consumer Services, 30, 252-261. Kim, Y. J., & Han, J. (2014). Why smartphone advertising attracts customers: A model of Web
advertising, flow, and personalization. Computers in Human Behavior, 33, 256-269.
Liu, C.-L. E., Sinkovics, R. R., Pezderka, N., & Haghirian, P. (2012). Determinants of Consumer Perceptions toward Mobile Advertising - A Comparison between Japan and Austria. Journal of
McCabe, M. (2011). Lynx turns to outdoor augmented reality. Retrieved (December 2019): https://www.campaignlive.co.uk/article/lynx-turns-outdoor-augmented-reality/1061042
McCort, D. J., & Malhotra, N. K. (1993). Culture and Consumer Behavior: Toward an Understanding of Cross-Cultural Consumer Behavior in International Marketing. Journal of International Consumer
Marketing, 6(2), 91-127.
McDonald, T., & Siegall, M. (1992). The Effects of Technological Self-Efficacy and Job Focus on Job Performance, Attitudes, andWithdrawal Behaviors. Journal of Psychology, Interdisciplinary and
Applied, 126, 465–475.
McQuail, D. (1983). Mass Communication Theory. London: Sage Publication.
Mitchell, A. A., & Olson, J. C. (1981). Are Product Attribute Beliefs the Only Mediator of Advertising Effects on Brand Attitudes. Journal of marketing Research, 318-322.
Nuroğlu, E., & Nuroğlu, H. H. (2018). Türkiye ve Almanya’nin Sanayide Dijital Dönüşümü: Yol Haritalari ve Şirketlerin Karşılaştırması. Süleyman Demirel Üniversitesi İktisadi ve İdari Bilimler
Fakültesi Dergisi, 23(Endüstri 4.0 ve Örgütsel Değişim Özel Sayısı), 1537-1560.
Pantano, E., Rese, A., & Baier, D. (2017). Enhancing the online decision-making process by using augmented reality: A two country comparison of youth markets. Journal of Retailing and
Consumer Services, 38, 81-95.
Pollay, R.W., & Mittal, B. (1993). Here’s the Beef: Factors, Determinants and Seg-ments in Consumer Criticism of Advertising. Journal of Marketing, 57(7), 99-114.
Poushneh, A., & Vasquez-Parraga, A. Z. (2017). Discernible impact of augmented reality on retail customer's experience, satisfaction and willingness to buy. Journal of Retailing and Consumer
Services, 34, 229-234.
Rabe-Hesketh, S., Skrondal, A., & Pickles, A. (2004). Generalized multilevel structural equation modelling. Psychometrika, 69, 167-190.
Rotzoll, Kim, James E. Haefner, & Charles J. Sandage (1989). Advertising and the Classical Liberal World View. In Hovland, R. & Wilcox, G. (Eds.), Advertising in Society. Lincolnwood, IL NTC Publishing Group.
Russell, M. (2012). 11 Amazing Augmented Reality Ads. Retrieved (December 2019): https://www.businessinsider.com/11-amazing-augmented-reality-ads-2012-1
Sayımer, İ., & Küçüksaraç, B. (2017). An experimental research about using augmented reality in advertising for measurement of advertisement liking and effectiveness level. In Narrative
Advertising Models and Conceptualization in the Digital Age (pp. 203-227). IGI Global.
Schart, D., & Tschanz, N. (2015). Praxishandbuch Augmented Reality für Marketing, Medien und Public
Relations. Konstanz, UVK Verlagsgesellschaft.
Sheinin, D.A., Varki, S., & Ashley, C. (2011). The differential effect of ad novelty and message usefulness on Brand judgements. Journal of Advertising, 40(3), 5-7.
Shimp, T. A. (1981). Attitude Toward the Ad as a Mediator of Consumer Brand Choice. Journal of
Advertising, 10(2), 9-15.
Singh, P., & Pandey, M. (2014). Augmented reality advertising: An impactful platform for new age consumer engagement. IOSR Journal of Business and Management, 16(2), 24-28.
Sorrels, M. (2015). Coca-Cola Uses "Drinkable Advertising" During the Final Four. Retrieved (December 2019) : https://www.bizbash.com/production-strategy/experiential- activations-sponsorships/media-gallery/13480962/cocacola-uses-drinkable-advertising-during-the-final-four
Sung, J., & Cho, K. (2012). User experiences with augmented reality advertising applications: focusing on perceived values and telepresence based on the experiential learning theory. Human Centric
Technology and Service in Smart Space, Vol. 182, 9-15.
Şahinli, M. A., & Kilinç, E. (2013). İnovasyon ve İnovasyon Göstergeleri: AB Ülkeleri ve Türkiye Karşılaştırması. Sosyal Ekonomik Araştırmalar Dergisi, 13(25), 329-356.
The Marketing Society (2019). Blog Post. Retrieved (December 2019):
https://www.marketingsociety.com/the-library/coke-zero%E2%80%99s-multi-channel-drinkable-advertising-campaign
Tsang, M.M., Ho, S.C. & Liang, T.P. (2004). Consumer attitude toward mobile advertising: an empirical study. International Journal of Electronic Commerce, 8(3), 65-78.
Tuned Global (2019). Coke's innovative "drinkable ad's" flow from TV to Mobile with Shazam. Retrieved (December 2019): https://blog.tunedglobal.com/innovative-trial-campaign-shazam-cokes-drinkable-ads
Uğur, İ., & Apaydin, Ş. (2014). Artırılmış Gerçeklik Uygulamalarının reklam beğeni düzeyindeki rolü. Humanities Sciences, 9(4), 145-156.
Yaoyuneyong, G., Foster, J., Johnson, E., & Johnson, D. (2016). Augmented reality marketing: consumer preferences and attitudes toward hypermedia print ads. Journal of Interactive Advertising, 16(1), 1-15.
Van Krevelen, D. W. F., & Poelman, R. (2010). A survey of augmented reality technologies, applications and limitations. International Journal of Virtual Reality, 9(2), 1-20.
Wang, C. (2005). An empirical study on consumer’s perceived value and attitude toward advertising. In Proceedings of the 6th Global Information Technology and Management (GITM) World Conference.
Wassermann, T. (2011). Augmented Reality Ad Puts You With Angels in London Train Station. Retrieved (December 2019): https://mashable.com/2011/03/17/unilevers-angels-ar/
Wolburg J. M., & Pokrywczynski, J. (2001). A Psychographic Analysis of Generation Y College Students.
Journal of Advertising Research, September-October 2001, 33-50.
Wu, G. (1999). Perceived Interacivity and Attitude toward Website. In Proceedings of American Academy