Doğuş Üniversitesi Dergisi, 19 (1) 2018, 99 - 111
(1) Prince Sultan University, Department of Engineering Management, College of Engineering; [email protected]
(2) Northeastern University, Department of Mechanical and Industrial Engineering; [email protected]
(*) This paper was presented at the “The 15th International Logistics and Supply Chain Congress (LMSCM)” on October 19-20, 2017.
Geliş/Received: 13-12-2017, Kabul/Accepted: 22-01-2018
The Impact of Carbon Emissions Policies on Reverse Supply
Chain Network Design
(*)Karbon Emisyon Politikalarının Tersine Tedarik Zincir Ağı Tasarımı Üzerindeki Etkileri
Bandar A. ALKHAYYAL
(1), Surendra M. GUPTA
(2)ABSTRACT: Reverse Supply Chain is described as an initiative that plays an important role in the global supply chain for those who seek environmentally responsible solutions for their end-of-life products. The relative economic and environmental benefits of reverse supply chain are influenced by costs and emissions during collection, transportation, recovery facilities, disassembly, recycling, remanufacturing, and disposal of unrecoverable components. The design of reverse supply chain network takes into account social, economic and environmental objectives. This paper addresses the design of reverse supply chain under the three common regulatory policies, strict carbon caps, carbon tax, and carbon cap-and-trade. Keywords: Greenhouse gas (GHG) emissions, low carbon logistics, reverse supply chain, sustainably supply chain
Öz: Küresel tedarik zincirinde önemli bir rol oynayan tersine tedarik zinciri, ömrünü
tamamlamış ürünler için çevreye karşı sorumlu çözümler arayanların bir girişimi olarak tanımlanmaktadır. Tersine tedarik zincirinin nispi ekonomik ve çevresel faydaları, toplama, nakliye, geri kazanım tesisleri, demontaj, geri dönüşüm, yeniden imalat ve geri dönüşü olmayan bileşenlerin imha edilmesi sırasında oluşan maliyetler ve emisyonlardan etkilenmektedir. Tersine tedarik zinciri ağ tasarımı sosyal, ekonomik ve çevresel hedefleri dikkate almaktadır. Bu makale, sıkı karbon kapsülleri, karbon vergisi, karbon emisyon üst sınırı ve ticareti olmak üzere üç ortak düzenleyici politikada ters tedarik zincirinin tasarımını ele almaktadır.
Anahtar Kelimeler: Sera gazı emisyonları, düşük karbonlu lojistik, tersine tedarik
zinciri, sürdürülebilir tedarik zinciri
Jel Kodları: L62, R4, F18, H23, O13
1. Introduction and Related Work
The number of products discarded by consumers has been gradually growing, which has led to legislations in various countries that hold the original equipment manufacturers (OEM) responsible for the end-of-life processing of products. In addition, the field of supply chain has also been influenced by consumer awareness of environmental issues (Vadde, Kamarthi, & Gupta, 2006) & (Ilgin & Gupta, 2010).
100 Bandar A. ALKHAYYAL, Surendra M. GUPTA
Climate change, disposal capacities, finite resources, growing population, improving quality of life, increasing emissions, and rising energy prices have motivated both corporations and academics to develop strategies based on corporate social responsibilities and sustainable supply chains (Carter, 2008), (Nagurney, Zugang, & Trisha, 2007), & (Paul, Kalyan, & Luk, 2005). While the concept of integrating sustainability into supply chain is relatively new, its implementation is however increasing continuously (Seuring, Joseph, Martin, & Purba, 2008).
Nowadays, although the products are still moving in the direction of the end customer the reverse flow of products is also taking place. This movement is obviously pronounced in most of the industrial sectors, especially in automobiles, beverages, electronic products, and pharmaceuticals. The automobile industry, for example, has included the changes in the supply chain to smooth the end-of-life vehicles recovery and the US vehicle recycling infrastructure (Boon, Isaacs, & Gupta, 2000) & (Ferguson & Browne, 2001).
Reverse Supply Chain (RSC) is an initiative that plays an important role in the global supply chain for those who seek environmentally responsible solutions for their end-of-life (EOL) products. The relative economic and environmental benefits of RSC are influenced by costs and emissions during collection, transportation, recovery facilities, disassembly, recycling, remanufacturing, and disposal of unrecoverable components (Ilgin & Gupta, 2010) , (Alkhayyal & Gupta, 2015), and (Gupta, 2013). Seuring and Muller (2008) defined the sustainable supply chain management as “the management of materials, information and capital flows as well as cooperation among companies along the supply chain while taking goals from all three dimensions of sustainable development, viz., economic, environmental and social, into account which are derived from customer and stakeholder requirements”. In this paper, the supply chain economics is taken into account by maximizing the total profit and minimizing the CO2 emissions, energy use, transportation, rent, labor, and product
recovery costs, by investigating the cost factors by facility type, on-site, inter-facility, and total tCO2e from on-site electricity use by unit. Greenhouse Gas (GHG) emissions regulations and environmental sustainability are preventing extreme environmental damages from happening. The social dimension includes, but not limited to, the reduction in negative consequences of coastal destruction, noise, stress, traffic congestion, spread of disease, and the improvement in the quality of life.
A literature review is conducted by Mexiell and Gargeya (2005) on economic considerations of supply chain design. A comprehensive review of the published literature on sustainable supply chain is presented by Seuring and Muller (2008), and Srivastava (2013).
Recent available literature reviews considering different aspects of supply chain sustainability include: energy use (Dotoli, 2005), GHG emissions reduction (Guillen-Gosalbez and Grossmann, 2009), green design (Hugo and Pistikopoulos, 2005), production planning and control for remanufacturing (Hugo,Rutter, Pistikopoulos, Amorelli, & Zoia, 2005), product recovery (Jayaraman, 2006), reverse logistics (Sheu, 2008), and waste management (Guillen-Gosalbez and Grossmann, 2009).
Gungor and Gupta (1999) addressed the issues of environmentally conscious manufacturing and product recovery with an extensive review of the literature. The
The Impact of Carbon Emissions Policies on Reverse Supply Chain Network Design 101
study looked at the product recovery process from environmentally conscious manufacturing point of view, and included the common issues in both environmentally conscious manufacturing and product recovery (viz. environmentally conscious design, environmentally conscious production, recycling and remanufacturing, and production planning and inventory control). Ilgin and Gupta (2010) further extended this literature review through 2010. There are several other authors who reported on product recovery designs under certain legislation and regulations (Das, 2002), (Bellmann & Khare, 2000), (Dekker & Fleischmann, 2004), (Fleishmann, 2000), (Guide, V. D. R., Jayaraman, V., & Srivastava, 1999), (Guide, 2000), & (Henshaw, 1994).
Reducing the emissions generated due to a supply chain has become an important goal. Thus, the “trade-offs in the supply chain are no longer just about cost, service and quality, but also about cost, service, quality and carbon,” (Chaabane, Ramudhin, & Paquet, 2012). A Closed-loop supply chain (CLSC) network considered by Paksoy, Bektaş, & Özceylan (2011), focused on the transportation logistics cost and their GHG emissions, to exam the trade-off between operational and environmental performance measures. Abdallah, Farhat, Diabat, & Kennedy (2012) investigated the carbon emissions as a consequence of the supply chain network design and supplier selection using life-cycle assessment (LCA) approach.
A mixed-integer programming model was formulated to find an optimal strategy for companies to meet their carbon cap, while minimizing costs by Diabat and Simichi-Levi (2010). Chaabane, Ramudhin, & Paquet (2012) formulated a model of an aluminium firm and examined the carbon emissions impact on designing a sustainable CLSC network based on LCA principles. They also evaluated the tradeoffs between economic and environmental dimensions under various cost and strategies. The issues of facility location problem in CLSC with a trading price of carbon emissions and a cost of procurement were considered in Diabat et al.’s (2013) work. Fahimnia et al. ((2013) evaluated the forward and reverse supply chain influences on the carbon footprint using mixed integer linear programming (MILP) model, where carbon emissions are demonstrated in terms of dollar carbon cost.
Benjaafar, Li, & Daskin (2013) illustrated the impact of carbon emission and introduced a series of lot sizing models to be integrated into operations decisions and showed how significant emissions reductions without increases in costs can be achieved by operational adjustments alone. Supply chain and transportation mode selection decisions study for a major retailer based on the carbon policies was reported by (Jin, Granda-Marulanda, & Ian, 2014)
In this research, a mixed integer linear programming model of reverse supply chain with full valuation of emissions is considered to determine the optimal flow of parts among multiple remanufacturing centers that will maximize the total profit with less CO2 emissions, based on actual sites in the Boston area. The proposed model
considers a mid-sized LG A/C unit with a refurbished market price of $288 (LG Model: LW1213ER Refurbished, 2015). Valuation of emissions is done using a direct carbon tax, with the value varied according to ranges proposed at the current COP21 climate talks in Paris, and with the other two different regulatory policies, strict carbon cap where firms are subject to mandatory caps on the amount of carbon they emit, and carbon cap-and-trade where firms are subjected to carbon caps but are rewarded
102 Bandar A. ALKHAYYAL, Surendra M. GUPTA
(penalized) for emitting less (more) than their caps. To that end, we determine how the proposed policies will influence profit margins for remanufactured goods. The model proposed can be used for designing and analyzing a reverse supply chain in a carbon trading environment, and optimize not only costs but also emissions in the supply chain operations. It captures the trade-offs between costs and emissions in the supply chain operations. It shows that carbon tax emissions, particularly at higher taxes, mostly affects transportation operations which results in reduced transportation costs and emissions; on the other hand, the higher the carbon tax is, the greener would be the supply chain design, not necessarily following a linear relationship. Applying an emissions cap combined with a carbon tax slightly increases total supply chain costs, but yields a greener design. Numerical example illustrates different policies and their impact on the costs and the effectiveness of emission reduction.
2. Notation and Assumptions
2.1. Notation
The notations used in this paper are given below: Notation Definition
C1v Storage capacity at remanufacturing facility v per remanufactured unit;
C2v Storage capacity at remanufacturing facility v per used unit;
Cu Storage capacity at collection center u per unit;
Cw CAP
Storage capacity at reselling center w per unit; Carbon strict cap;
Du Dw
Demand of products at collection center u; Demand of products at reselling center w;
duu dwv
Distance from collection center u to remanufacturing facility v, per mile; Distance from remanufacturing facility v to reselling center w, per mile;
EXu Energy cost at collection center u per unit;
EXv Energy cost at remanufacturing facility v per unit;
EXw Energy cost at reselling center w per unit;
GH GHG emissions per ton-mile;
GHu GHG emissions in collection center u, per unit;
GHv GHw GHGt
GHG emissions in remanufacturing facility v, per unit; GHG emissions in reselling center w, per unit; GHG emissions total;
Hu Holding cost per unit at collection center u;
Lu Labor cost at collection center u per unit;
Lv Labor cost at remanufacturing facility v per unit;
Lw Labor cost at reselling center w per unit;
O1 Occupied space by remanufacturing unit; O2
Kg
Occupied space by used-product unit; Weight of each unit;
P Reprocessing cost per unit;
R Retrival cost per unit;
RCAPv Remanufacturing facility v capacity;
RCu Rent cost at collection center u per unit;
RCv Rent cost at remanufacturing facility v per unit;
The Impact of Carbon Emissions Policies on Reverse Supply Chain Network Design 103 SHu Shortage cost per unit at collection center u;
SUPu Supply at collection center u;
Tuv Transportation cost from collection center u to remanufacturing facility v, per unit;
Tvw Transportation cost from remanufacturing facility v to reselling facility w, per unit;
u Collection center;
v Remanufacturing facility;
w Reselling center;
Xuv Decision variable for the number of units transferring from collection center u to remanufacturing facility v;
Yvw Decision variable for the number of units transferring from remanufacturing facility
v to reselling center w; Zv
Zw
Binary variable (0/1) for selection of remanufacturing facility v; Binary variable (0/1) for selection of reselling center w.
2.2. Assumptions
We assume that GHG emissions come from four sources:
1. from the collection centers: the amount of emissions is proportional to the power consumption of these centers;
2. from the remanufacturing facilities: the amount of emissions is proportional to the volume of these remanufacturing facilities;
3. from the reselling centers: the amount of emissions is proportional to the power consumption of these centers; and
4. from the distribution of the products: the emissions level is based on the traveled distance between facilities, and the weight of each unit (40 Kg).
The model also assumes that inventory cost of a used product at the remanufacturing facility is 25% of its retrieval cost (R), and for a remanufactured product it is 25% of its reprocessing cost (P).
3. Problem Formulation
The model is formulated as a single period mixed integer linear programming model of reverse supply chain where full valuation of emissions is considered to determine the optimal flow of parts among multiple remanufacturing facilities that will maximize the total profit which includes the CO2 emissions, energy use,
transportation, rent, labor, and product recovery costs. Objective Functions Minimize Retrieval cost
u vX uv
R
Transportation cost
v w u vY vw
T vw
X uv
T uv
Remanufacturing cost
v wY vw
P
104 Bandar A. ALKHAYYAL, Surendra M. GUPTA Inventory cost
v w u vY vw
Pv
X uv
Ru
/
4
)
(
/
4
)
(
+ Rent cost
w v uYvw
RCw
Xuv
RCv
Du
RCu
*
*
*
+ Labor cost
w v uYvw
Lw
Xuv
Lv
Du
Lu
*
*
*
+ Energy cost
w v uYvw
Ew
Xuv
Ev
Du
Eu
*
*
*
+Greenhouse Gas (GHG) Emissions
w v v u v v w u uYvw
Kg
dwv
GH
Xuv
Kg
duv
GH
GHwYvw
GHvXuv
Du
GHu
*
*
*
*
*
*
*
Shortage cost
DwSUPu
1Z
}SHu (1) ConstraintsDemand constraint must be met while minimizing the total cost of production and inventory.
vYvw
= 𝐷𝑤 ; ∀ 𝑤 (2)Remanufacturing facility total output is at most its total input
v uYvw
Xuv
; ∀ 𝑣 (3)Remanufacturing items occupied space at each remanufacturing facility is at most its capacity, and total space occupied at each collection center by returned items at most its capacity v Yv Yvw
C
O
v w
1 1 ; (4)O
XuvC
u u v
; 2 (5)Total space occupied at each remanufacturing facility by returned items at most its capacity
O
XuvC
Zv v v u
* ; 2 2 (6)The Impact of Carbon Emissions Policies on Reverse Supply Chain Network Design 105
Total space occupied at reselling center by returned items at most its capacity
O
YvwC
Zw w w v
; 1 (7)Carbon strict cap limit
CAP
GHGt
(8) Non-negativity constraint 𝑋𝑢𝑣≥ 0 ; ∀ 𝑢, 𝑣 (9) 𝑌𝑢𝑣≥ 0 ; ∀ 𝑣, 𝑤 (10)Total number of returned items supplied to remanufacturing facilities by collection centers is at most the supply
RCAPv
v
wY vw
;
(11)SUPu
u
v X uv
;
(12)4. Case Study
The numerical example is based on actual sites in the Boston (Massachusetts) area and considers three collection centers (located in Melrose, Canton, and Natick), two remanufacturing facilities (located in Taunton and Hingham), and three reselling centers (located in Revere, Boston, and Somerville). The actual distances in miles between the locations were considered, to calculate mile per gallon costs and emissions of CO2 kg per gallon, assuming the gasoline price per gallon of October
2015. The number of laborers, their annual salaries, and the size of the space were also considered. In short, the example reflects a breakdown of the cost factors: rent, labor, energy, CO2 emissions, and transportation, by facility type, on-site,
inter-facility, and total tCO2e from on-site electricity use by unit. The U.S. Energy
Information Administration at the U.S. Department of Energy data reports (U.S. Energy Information Administration, 2015) were used to calculate the energy usage for each facility. This example considers a mid-size LG A/C unit, model LW1213ER, with dimensions of 23 5/8" x 15" x 22 1/6", and a refurbished market price of $288 (LG Model: LW1213ER Refurbished, 2015). Two 12-foot trucks with a capacity of 58 A/C units each and a load volume of 475 cubic feet were used for transportation (12 Foot Truck, 2017). Valuation of emissions is done using the suggested direct carbon tax, strict cap, and cap-and trade values according to ranges proposed at the 21st Conference of the Parties under the UNFCCC in Paris (Conference of the Parties
(COP21), 2015), the U.S. Interagency Working Group (2013) and, the U.S. Environmental Protection Agency (2015), to determine how proposed ranges will influence profit margins for remanufactured goods.
4.1. Data
In this section two different survey databases were used, Commercial Buildings Energy Consumption Survey (CBECS) which was used for collection centers and reselling centers energy data. Manufacturing Energy Consumption Survey (MECS)
106 Bandar A. ALKHAYYAL, Surendra M. GUPTA
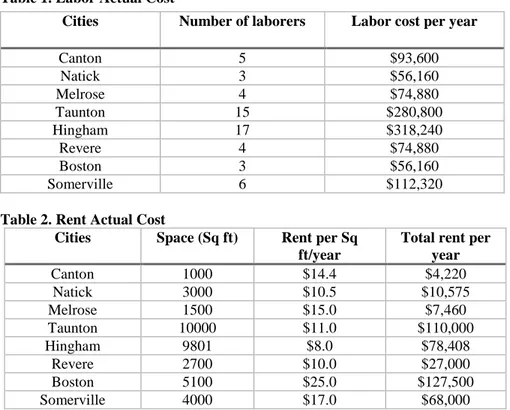
was used for remanufacturing facilities energy data in subsection. Tables 1 to 4 have the labor cost, rent cost, and distances between locations per mile respectively.
Table 1. Labor Actual Cost
Table 2. Rent Actual Cost
Cities Space (Sq ft) Rent per Sq ft/year
Total rent per year Canton 1000 $14.4 $4,220 Natick 3000 $10.5 $10,575 Melrose 1500 $15.0 $7,460 Taunton 10000 $11.0 $110,000 Hingham 9801 $8.0 $78,408 Revere 2700 $10.0 $27,000 Boston 5100 $25.0 $127,500 Somerville 4000 $17.0 $68,000
Table 3. Actual Distances between Collection Center and Remanufacturing Facilities per Mile
From/To City Taunton Hingham
Melrose 52.8 28.1
Canton 17.2 19.3
Natick 37.0 30.5
Table 4. Actual Distances Between and Remanufacturing Facilities and Reselling Centers per Mile
From/To City Revere Boston Somerville
Taunton 45.0 40.0 43.0
Hingham 24.0 19.0 22.0
5. Results and Discussion
The absence of a carbon tax for the A/C unit priced at $218 results in a profit margin estimated to be 24.3% for a $288 selling price according to current refurbished market price (LG Model: LW1213ER Refurbished, 2015), whereas a USEPA-recommended $40/ton CO2 equivalent (tCO2e) tax reduced the profit margin to 19.1% assuming a
price for remanufactured item of $233 per unit (US Environmental Protection Agency, 2015). However, strict carbon cap reduces the profit margin to 13%, and
cap-and-Cities Number of laborers Labor cost per year
Canton 5 $93,600 Natick 3 $56,160 Melrose 4 $74,880 Taunton 15 $280,800 Hingham 17 $318,240 Revere 4 $74,880 Boston 3 $56,160 Somerville 6 $112,320
The Impact of Carbon Emissions Policies on Reverse Supply Chain Network Design 107
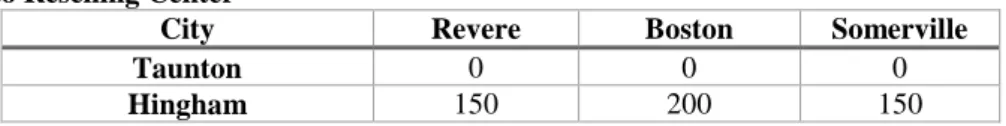
trade policy reduces the profit margin to 9%. LINGO 13.0 was used to solve the problem. The optimal results obtained from the direct carbon tax are shown in Tables 5 and 6.
Table 5. Optimal Number of Units Transported From Collection Center to Remanufacturing Facility
City Taunton Hingham
Melrose 0 50
Canton 0 0
Natick 0 450
Table 6. Optimal Number of Units Transported From Remanufacturing Facility to Reselling Center
City Revere Boston Somerville
Taunton 0 0 0
Hingham 150 200 150
The optimal remanufacturing cost is $218 per unit, which shows that this model is $70 per unit less than the current refurbished market price. The emission quantity is 0.018 tCO2e per unit. Comparing this result to the deflated refurbished market price using a consumer price index expressed in 2002 dollars and analyzing that result using the economic input-output life cycle assessment (EIO-LCA) model a technique for estimating the materials and energy resources required for environmental emissions resulting from economic activities (Carnegie Mellon University Green Design Institute, 2016). The EIO-LCA sector chosen was the U.S. 2002 Benchmark for air conditioning, refrigeration, and warm air heating equipment manufacturing. This shows that the emission quantities are 0.109 tCO2e per unit less than refurbished manufacturing. The valuation of emissions for the optimal result was done by using the values according to ranges proposed at the 21st Climate Change Conference (COP21) in Paris, therefore existing approaches used different carbon policies and applications. Using the carbon price of $40/ton CO2 equivalent (tCO2e), our model gives a profit margin of 19.1%. Moreover, the climate change concerns are continuing to increase along with the acceleration of global warming. The IPCC reports that globally GHG emissions have increased by more than 80% from 1970 to 2010, resulting in widespread threats to global ecosystems and human enterprise (IPCC, 2014). The new Paris agreement proposes a means to achieve zero net GHG emissions by the second half of this century (COP21, 2015). This paper explored this topic through which a deterministic model is employed to determine the effects of internalizing a cost of RSC GHG emissions into optimization models. Variations in optimal facility use, pricing/profit margins, and transportation logistics were compared against a variable cost of carbon, employing a case study method established through the inclusion of actual data from sites in the Boston area. A number of model extensions and refinements could be made. First, the deterministic model could be relaxed to facilitate the potential to relocate remanufacturing facilities/reselling centers rather than shutting down the facility, based upon factors such as traffic congestion and parking difficulties; commuting distance; current land/energy/labor cost criteria; and general population, economy, and geographic characteristics of the setting. Proximity of additional recycling infrastructure, such as
108 Bandar A. ALKHAYYAL, Surendra M. GUPTA
rail lines, Material Recovery Facilities, shipping terminals, and disposal facilities, and their incorporation in a spatially-explicit RSC may serve to make the models presented here more realistic. Finally, this paper used a variable social cost of carbon whose value was set to levels recommended by government agencies and reports to represent a carbon tax on all activities leading to GHG emissions. Furthermore, other policy means of controlling GHG emissions such as strict carbon caps or cap-and-trade policies have been modeled. The existing cost model could also be used to determine how much GHG emissions are reduced by remanufacturing versus disposal, providing a value for the cost of carbon abatement from remanufacturing operations that could be of use to environmental economics research.
6. Conclusion
This paper has presented a reverse supply chain optimization model designed to take into account the influence of both strategic and operational activities of the supply chain on the environment. A case study based on actual sites was considered to illustrate performance of the model and to determine how the proposed policies would influence profit margins on remanufactured goods. The results indicated that the carbon price ranges that were used in this study will control the amount of GHG emissions generated in reverse supply chain operations. The results also indicated that the carbon tax policy forces a strict constraint on the amount of carbon emissions generated in supply chain operations. It shows that the RSC is sensitive to the carbon price. The work herein advances the theoretical modeling of optimal RSC systems while presenting an empirical case study of remanufactured appliances, an understudied facet of current industrial literature.
7. References
12 Foot Truck. (2017). Retrieved from Penske Truck Leasing Corporation:
http://www.pensketruckrental.com/moving-trucks/12-foot-truck/
Abdallah, T. Farhat, A. Diabat, A. Kennedy, S. (2012). Green supply chains with carbon trading and environmental sourcing: Formulation and life cycle assessment, Applied Mathematical Modelling, vol. 36. p. 4271–4285.
Alkhayyal, B & Gupta, S. M. (2015). “A Linear Physical Programming Approach to Evaluate Collection Centers for End-Of-Life Products”. Proceedings of the 2015
Northeast Decision Sciences Institute Conference.
Bellmann, K. and Khare, A.( 2000). Economic Issues in Recycling End-of-Life Vehicles, Technovation, Vol. 20, 677-690
Benjaafar, S. Li, Y. Daskin, M. (2013). Carbon footprint and the management of supply chains: insights from simple models, IEEE Transactions Automotive
Science Eng. Vol. 10. p. 99-116.
Boon, J. E., Isaacs, J. A., & Gupta, S. M. (2000) “Economic Impact of Aluminum‐ Intensive Vehicles on the US Automotive Recycling Infrastructure”. Journal of
Industrial Ecology, 4(2), 117-134.
Carnegie Mellon University Green Design Institute. (2016). Economic Input-Output
Life Cycle Assessment (EIO-LCA) US 2002 (428 sectors) Producer model [Internet], Available from: <http://www.eiolca.net/> [Accessed 21 June, 2017].
Carter, C. R. (2008). A framework of sustainable supply chain management: moving toward new theory. International Journal of Physical Distribution & Logistics
The Impact of Carbon Emissions Policies on Reverse Supply Chain Network Design 109
Chaabane, A., Ramudhin, A. Paquet, M. (2012). Design of sustainable supply chains under the emission trading scheme, International Journal of Production
Economics, vol. 135, p. 37-49.
Conference of the Parties (COP21). (2015). The Paris Agreement. The United Nations
Framework Convention on Climate Change (UNFCCC). Available from
http://www.cop21paris.org/ [Accessed May. 12, 2017].
Das, J. K. (2002). Responding to Green Concerns: the Role of Government and Business, Vikalpa, Vol. 27, 3-12.
Dekker, R., & Fleischmann, M. (Eds.). (2004). Reverse logistics: quantitative models for closed-loop supply chains. Springer Science & Business Media.
Diabat, A, Abdallah, T. Al-Refaie, A. Svetinovic, D. Govindan, K. (2013). Strategic Closed-Loop Facility Location Problem With Carbon Market Trading, IEEE
Transactions on engineering Management, vol. 60, no. 2. p. 398-408.
Diabat, A. Simichi-Levi, D. (2010). A carbon-capped supply chain network Problem.
IEEE International Conference on Industrial Engineering and Engineering Management. p. 523-27.
Dotoli, M. (2005). A multi-level approach for network design of integrated supply chains. International journal of production research, 43:4267–4287.
Fahimnia, B. Sarkis, J. Dehghanian, F. Banihashemi, N. Rahmanm. S. (2013). The impact of carbon pricing on a closed-loop supply chain: an Australian case study,
Journal of Cleaner Production, vol. 59. p. 210-25.
Ferguson, N., & Browne, J. (2001). “Issues in end-of-life product recovery and reverse logistics”. Production Planning & Control, 12(5) (2001), 534-547. Fleishmann, M. (2000). Quantitative models for reverse logistics. Rotterdam. Guide, V. D. R. (2000). Production Planning and Control for Remanufacturing:
Industry Practice and Research Needs, Journal of Operations Management, Vol. 18, 467- 483.
Guide, V. D. R., Jayaraman, V., & Srivastava, R. (1999). Production planning and control for remanufacturing: a state-of-the-art survey. Robotics and
Computer-Integrated Manufacturing, 15(3), 221-230.
Guillen-Gosalbez, G. and Grossmann, I. (2009). Optimal design and planning of sustainable chemical supply chains under uncertainty. American Institute of
Chemical Engineers Journal, 55:99–121.
Gungor, A., & Gupta, S. M. (1999). Issues in environmentally conscious manufacturing and product recovery: a survey. Computers & Industrial
Engineering, 36(4), 811-853.
Gupta, S. M. (2013). Reverse Supply Chains: Issues and Analysis, CRC Press, ISBN: 978-1439899021.
Henshaw, J. M. (1994). Design for recycling: new paradigm or just the latest 'design– for–X' fad?. International Journal of Materials and Product Technology, 9(1), 125-138.
Hugo, A. and Pistikopoulos, E. (2005). Environmentally conscious long-range planning and design of supply chain networks. Journal of Cleaner Production:
Recent advances in industrial process optimization, 13:1471–1491.
Hugo, A., Rutter, P., Pistikopoulos, S., Amorelli, A., & Zoia, G. (2005). Hydrogen infrastructure strategic planning using multi-objective optimization.
International Journal of Hydrogen Energy, 30(15), 1523-1534.
Ilgin, M. A., & Gupta, S. M. (2010). Environmentally conscious manufacturing and product recovery (ECMPRO): a review of the state of the art. Journal of
110 Bandar A. ALKHAYYAL, Surendra M. GUPTA
Interagency Working Group, (2013). Technical update on the social cost of carbon
for regulatory impact analysis-under executive order 12866. United States
Government.
IPCC. (2014). Climate Change 2014: Synthesis Report. Contribution of Working
Groups I, II and III to the Fifth Assessment Report of the Intergovernmental Panel on Climate Change [Core Writing Team, R.K. Pachauri and L.A. Meyer
(eds.)]. IPCC, Geneva, Switzerland, 151 pp.
Jayaraman, V. (2006). Production planning for closed-loop supply chains with product recovery and reuse: An analytical approach. International Journal of
Production Research, 44:981–998.
Jin, M. Granda-Marulanda, N.A. Ian, D. (2014). The impact of carbon policies on supply chain design and logistics of a major retailer, Journal of Cleaner
Production; vol. 85. p. 453-461.
LG Model: LW1213ER Refurbished. (2015). World Wide Voltage, LG Electronics.
Air Conditioners. Available from http://www.worldwidevoltage.com/lg-
lw1213er-12-000-btu-window-air-conditioner-with-remote-fectory-
refurbished--only-for-usa--.html?utm_source=googlepeplaandutm_medium=adwordsandid=61865531738 [Accessed Feb. 17, 2017].
Meixell, M. and Gargeya, V. (2005). Global supply chain design: A literature review and critique. Transportation Research Part E: Logistics and Transportation
Review, 41:531– 550.
Nagurney, A., Zugang, L, & Trisha, W. (2007). Sustainable Supply Chain and Transportation Networks. International Journal of Sustainable Transportation, vol. 1, no 1, p. 29 - 51.
Paksoy, T. Bektaş, T. Özceylan, E. (2011). Operational and environmental performance measures in a multi-product closed-loop supply chain,
Transportation Research Part E: Logistics and Transportation Review, vol. 47,
no. 4. p. 532-46.
Paul R. K., Kalyan. S, & Luk N. W. (2005). Sustainable Operations Management.
Production and Operations Management, vol. 14, no 4, p. 482-492.
Seuring S, Müller M. (2008). From a literature review to a conceptual framework for sustainable supply chain management. Journal of Cleaner Production, Vol. 16, No. 15, pp. 1699-1710.
Seuring, S., Joseph, S., Martin, M., & Purba, R. (2008). Sustainability and supply chain management - An introduction to the special issue. Journal of Cleaner
Production, vol. 16, no 15, p. 1545-1551.
Sheu, J. (2008). Green supply chain management, reverse logistics and nuclear power generation. Transportation Research Part E: Logistics and Transportation
Review, 44:19– 46.
Srivastava, S. (2007). Green supply-chain management: A state-of-the-art literature review. International Journal of Management Reviews, 9:53–80.
U.S. Energy Information Administration. (2015). Table 5.6.A. Average Price of
Electricity to Ultimate Customers by End-Use Sector, Electric Power Monthly [Internet], Available from
http://www.eia.gov/electricity/monthly/epm_table_grapher.cfm?t=epmt_5_6_a [Accessed 20 June, 2017].
US Environmental Protection Agency. (2015). The Social Cost of Carbon. Climate
Change - Social Cost of CO2, 2015-2050 [Internet]. Available from
http://www3.epa.gov/climatechange/EPAactivities/economics/scc.html (Accessed 14 June, 2017].
The Impact of Carbon Emissions Policies on Reverse Supply Chain Network Design 111
Vadde, S., Kamarthi, S. V., & Gupta, S. M. (2006). Pricing decisions for product recovery facilities in a multi-criteria setting using genetic algorithms.
Proceedings of the SPIE International Conference on Environmentally Conscious Manufacturing VI, (6385) 108-118.