One-Pot Synthesis of CdS Nanoparticles in the Channels of
Mesosructured Silica Films and Monoliths
Cenk Tura,
†Neil Coombs,
‡and O
¨ mer Dag*
,†Department of Chemistry, Bilkent UniVersity, 06800, Ankara, Turkey, and Imagetek Analytical Imaging, 32 Manning AVenue, Toronto, Ontario, Canada, M6J 2K4
ReceiVed September 6, 2004. ReVised Manuscript ReceiVed NoVember 22, 2004
Cd(II)-modified mesoporous silica films and/or monoliths synthesized in one pot using a true liquid crystalline (TLC) approach have been reacted with H2S gas to produce CdS-modified mesostructured nanocomposite materials (Nano-CdS/meso-SiO2). During this process, both the TLC and the metallotropic liquid crystalline (MLC) mesophase of metal salt ([Cd(H2O)4](NO3)2)-nonionic surfactant (Cn
H2n+1-(OCH2CH2)mOH, CnEOm) systems were collectively used to incorporate large quantities of metal ions
into the mesoporous silica film and monoliths. The effect of the cadmium nitrate concentration on the formation and structure of the mesoporous silica has also been investigated. The results show that at low salt concentrations, the mesoporous silica is anisotropic (hexagonal); however, at high salt concentration, the structure is isotropic (cubic or disordered). The freshly prepared CdS nanoparticles are reactive toward the surface acids that form during the H2S treatment. These surface acids also promote the degradation of the CdS nanopaticles. However, the CdS particles in the mesopores can be stabilized by washing out the acid sides or aging the samples for a period of time before the H2S reaction. The optical absorption edge of the CdS nanoparticle in the pores is sensitive to the composition and structure of the host. In this context, the materials were characterized using FTIR, micro-Raman, UV-visible absorption spectroscopy, POM, TEM, and PXRD techniques.
Introduction
Since the first report on the synthesis of mesoporous silica,1there is a rapidly growing interest in the modification methods used to produce new functional materials.2-12 Examples of these methods include those for drug delivery systems,2 synthesis of optical materials,3-5 synthesis of polymers,6monolayer depositions of thiols,7encapsulation of metal ions and metal nanoclusters,8-14 etc. It is worth mentioning that mesoporous silica offers various
morphol-ogies, such as thin films,15powders (with various shape),16 and monoliths17for these purposes.
Attard et al.17 introduced the true liquid crystalline (TLC) approach that uses nonionic surfactants (Cn
H2n+1-(OCH2CH2)mOH, denoted as CnEOm) in their lyotropic liquid
crystalline (LLC) mesophase to produce mesoporous silica films and monoliths. For this, the water-CnEOm(50% w/w)
liquid crystalline (LC) phase has been used as a template and silica polymerization reaction media.17Addition of tetra-methyl orthosilicate (TMOS) to an LC mixture of a water-surfactant-acid yields a liquid mixture. However, the hy-drolysis and condensation of TMOS and the evaporation of CH3OH and some of the water molecules reforms the LC mesophase after a short period of time (5-10 min). Further polymerization of this silicatropic mesophase takes place in the LC phase and eventually in the solid phase. The TLC approach has also been used for the synthesis of mesoporous metals18-20and semiconductors,21-24incorporating metal ions * To whom correspondence should be addressed. E-mail: dag@
fen.bilkent.edu.tr. Fax: 90-312-266-4579. Tel: 90-312-266-3918. †Bilkent University.
‡Analytical Imaging.
(1) Kresge, C. T.; Leonowicz, M. E.; Roth, W. J.; Vartuli, J. C.; Beck, J. S. Nature 1992, 359, 710.
(2) Lai, C. Y.; Trewyn, B. G.; Jeftinija, D. M.; Jeftinija, K.; Xu, S.; Jeftinija, S.; Lin, V. S. Y. J. Am. Chem. Soc. 2003, 125, 4451. (3) Dag, O¨ .; Ozin, G. A.; Yang, H.; Reber C.; Guillaume, B. AdV. Mater.
1999, 6, 474.
(4) Scott, B. J.; Wirnsberger, G.; Stucky, G. D. Chem. Mater. 2001, 13, 3140.
(5) Scott, B. J.; Wirnsberger, G.; McGehee, M. D.; Chmelka, B. F.; Stucky, G. D. AdV. Mater. 2001, 13, 1231.
(6) Johnson, S. A.; Khushalani, D.; Coombs, N.; Mallouk, T. E.; Ozin, G. A. J. Mater. Chem. 1998, 8, 13.
(7) Feng, X.; Fryxell, G. E.; Wang, L. Q.; Kim, A. Y.; Liu, J.; Kemner, K. M. Science 1997, 276, 923.
(8) Bronstein, L.; Kramer, E.; Berton, B.; Burger, C.; Fo¨rster, S.; Antonietti, M. Chem. Mater. 1999, 11, 1402.
(9) Han, Y. J.; Kim, J. M.; Stucky, G. D. Chem. Mater. 2000, 12, 2068. (10) Bronstein, L. M.; Polarz, S.; Smarsly, B.; Antonietti, M. AdV. Mater.
2001, 13, 1333.
(11) Shin, H. J.; Ryoo, R.; Liu Z.; Terasaki, O. J. Am. Chem. Soc. 2001, 123, 1246.
(12) Jiang, X.; Xie, Y.; Lu, J.; Zhu, L.; He, W.; Qian, Y. Chem. Mater. 2001, 13, 1213.
(13) Yang, C. M.; Sheu H. S.; Chao, K. J. AdV. Funct. Mater. 2002, 12, 143.
(14) Dag, O¨ .; Samarskaya, O.; Coombs, N.; Ozin, G. A. J. Mater. Chem. 2003, 13, 328.
(15) Yang, H.; Kuperman, A.; Coombs, N.; Mamiche-Afara, S.; Ozin, G. A. Nature 1996 379, 705.
(16) Yang, H.; Coombs, N.; Ozin, G. A. Nature 1997, 386, 692. (17) Attard, G. S.; Glyde, J. C.; Go¨ltner, C. G. Nature 1995, 378, 366. (18) Attard, G. S.; Bartlett, P. N.; Coleman, N. R. B.; Elliott, J. M.; Owen,
J. R.; Wang, J. H. Science 1997, 278, 838.
(19) Attard, G. S.; Goltner, C. G.; Corker, J. M.; Henke, S.; Templer, R. H. Angew. Chem., Int. Ed. Engl. 1997, 36, 1315.
(20) Attard, G. S.; Leclerc, S. A. A.; Maniguet, S.; Russell, A. E.; Nandhakumar, I.; Bartlett, P. N. Chem. Mater. 2001, 13, 1444. (21) Braun, P. V.; Osenar, P.; Stupp, S. I. Nature 1996, 380, 325. 10.1021/cm048484b CCC: $30.25 © 2005 American Chemical Society
for ion conductivity,25 and the synthesis of noble metal nanoparticles in the channels of mesoporous materials.14
Recently, Dag et al. have introduced a new liquid crystal-line system of CnEOmnonionic surfactants with transition
metal aqua complexes.26-28In the new system, coordinated water molecules, M-OH2, mediate the self-assembly process as Si-OH in the silicatropic and M-OH in the other metallotropic29,30systems. The structure of the LC mesophase is determined by the anion type and also by the ionic strength of the media.31 The TLC approach and the new MLC system26-28 could collectively be used to incorporate large quantities of transition metal complex ions into mesoporous materials. In this process, the nonionic surfactant molecules encapsulate the aqua complexes of the transition metal ions and keep them intact during and after the silica polymeri-zation reactions in the hydrophilic regions of the metallo-slicatropic mesophase. The resulting transparent materials could be prepared in thin film and monolith forms. The color of the transition metals is reflected in the films and monoliths. These metal ions have technological importance in many fields. For example, [Cd(H2O)4]X2containing films and/or monoliths could be further used to produce CdS nanoparticles (Nano-CdS) inside the mesoporous/mesostructured silica materials.
Nano-CdS is our choice because it is one of the most studied materials, as a nanocrystalline semiconductor that has an optical band gap in the visible region of the elec-tromagnetic radiation. There are few methods in the literature exploring the synthesis of CdS nanoparticles in the channels of mesoporous materials.32-36 These methods involve the incorporation of metal ions into the mesopores, either through ion-exchange or impregnation methods32-36and reaction with H2S gas.
Here we describe a new approach for the one-pot synthesis of Cd(II) encapsulated transparent thin films and monoliths of mesoporous silica materials. These materials could be reacted with H2S gas in the second step of the preparation to produce transparent mesoporous silica films and monoliths
that contain CdS nanoparticles (abbreviated as Nano-CdS/ meso-SiO2through out the text). In the self-assembly process, the TLC and MLC mesophase were collectively used to incorporate a large concentration of cadmium ions that can be easily controlled, in the channels of the mesostructured silica. This method allows us to control the morphology, transparency and concentration of CdS particles in the mesostructured silica materials, which may find applications in the fields of optics and photo catalysis. The materials studied in this article were characterized using polarized optical microscopy (POM), tunneling electron microscopy (TEM), X-ray diffraction (XRD), Fourier transform infrared (FTIR), UV-visible absorption, and micro-Raman spectros-copy (MRS).
Experimental Section
Syntesis of the Materials. Various amounts of [Cd(H2O)4](NO3)2 salt were dissolved in 1.00 g of H2O that was acidified using 0.10 g of concentrated nitric acid. To this mixture, first 1.00 g of C12EO10and then 1.60 g of TMOS were added consecutively. The liquid mixture was shaken to homogenize. Note that when the mixture was not a clear solution, it required very gentle heating. The homogeneous liquid mixture was spread on glass slides (monoliths) for POM, XRD, and visible absorption and on an undoped Si(100) wafer (films) for FTIR measurements. The XRD and visible absorption (in transmittance mode) measurements were also recorded from the thin-film samples, which were prepared by dip coating using a similar composition but with a higher water content. The coating speed was adjusted to 0.4 cm/s. The various composition of Cd2+ containing mesostructured materials were prepared by varying the Cd2+/C
12EO10 mole ratio from 0.0 (corresponds to a 0.0 w/w % ratio of Cd2+/SiO
2) to 1.50 (corre-sponds to a 50 w/w % ratio of Cd2+/SiO
2) and by keeping the TMOS/C12EO10 mole ratio constant at 6.59 in all samples. The samples were kept under laboratory conditions in a glow box for 3-10 days and then reacted in an evacuated reaction chamber under 50-150 Torr of H2S gas. This process usually produced stable transparent (yellow) Nano-CdS/Meso-SiO2 composite materials. Note also that the Nano-CdS/Meso-SiO2 obtained from freshly prepared samples (monoliths) are not stable, and with time, the color due to the nanoparticles disappears. However aging and/or washing the samples with water after the H2S treatment stabilizes the CdS nanoparticles in the channels of mesoporous silica materials.
Characterization. The polarized optical microscopy (POM) images were obtained in transmittance mode on a Meije Techno ML9400 series polarizing microscope with transmitted light illumi-nation, using convergent white light between the parallel and crossed polarizers and a stereo microscope Stemi 2000 from Carl Ziess Jena GmbH with halogen lamp, 6 V/10 W, equipped for bright field and phase contrast. The X-ray diffraction (XRD) patterns were recorded on a Rigaku Miniflex diffractometer using a high power Cu-KR source operating at 30kV/15mA. The PXRD patterns were recorded in low and high angle regions to monitor both the meso-phase and CdS nanocrystallites, respectively. The TEM images were obtained using a Philips 430 microscope operating at an accelerating voltage of 100 kV. The samples were embedded in epoxy resin and microtomed. The micro-Raman spectra were obtained on a S. A. LabRam confocal Raman microscope. The signal collected was transmitted through a fiber optic cable into a single grating spec-trometer equipped with a 1024× 256 element CCD. The Raman spectra were collected by manually placing the probe tip near the desired point of the film. The FTIR spectra were recorded with a (22) Braun, P. V.; Osenar, P.; Tohver, V.; Kennedy, S. B.; Stupp, S. I. J.
Am. Chem. Soc. 1999, 121, 7302.
(23) Rabatic, B. M.; Pralle, M. U.; Tew, G. N.; Stupp, S. I. Chem. Mater. 2003, 15, 1249.
(24) Jiang, X.; Xie, Y.; Lu, J.; Zhu, L. Y.; He, W.; Qian, Y. T. Chem. Mater. 2001, 13, 1213.
(25) Dag, O¨ .; Verma, A.; Kresge, C. T.; Ozin, G. A. J. Mater. Chem. 1999, 9, 1475.
(26) C¸ elik, O¨.; Dag, O¨. Angew. Chem., Int. Ed. 2001, 40, 3800. (27) Dag, O¨ . Samarskaya, O.; Tura, C.; Gu¨nay, A.; C¸elik, O¨. Langmuir
2003, 19, 3671.
(28) Dag, O¨ .; Alayogˇlu, S.; Tura, C.; C¸elik, O¨. Chem. Mater. 2003, 15, 2711.
(29) Dag, O¨ .; Soten, I.; C¸elik, O¨.; Polarz, S.; Coombs, N.; Ozin, G. A. AdV. Funct. Mater. 2003, 13, 30.
(30) Crepaldi, E. L.; Grosso, D.; Soler-Illia, G. J. D. A.; Albouny, P. A.; Amenitsch, H.; Sanchez, C. Chem. Mater. 2002, 14, 3316. (31) Dag, O¨ .; Alayogˇlu, S.; Uysal, I˙. J. Phys. Chem. B, 2004, 108,
8439.
(32) Hirai, T.; Okubo, H.; Komasawa, I. J. Phys. Chem. B 1999, 103, 4228.
(33) Zhang, W. H.; Shi, J. L.; Chen, H. R.; Hua, Z. L.; Yan, D. S. Chem. Mater. 2001, 13, 648.
(34) Zang, Z. T.; Dai, S.; Fan, X. D.; Blom, D. A.; Pennycook, S. J.; Wei, Y. J. Phys. Chem. B 2001, 105, 6755.
(35) Wang, S.; Choi, D. G.; Yang, S. M. AdV. Mater. 2002, 14, 1311. (36) Besson, S.; Gacoin, T.; Ricolleau, C.; Jacquiod, C.; Boilot, J. P. Nano
Bomem Hartman MB-102 model FTIR spectrometer. A standard DTGS detector was used with a resolution of 4 cm-1and 64 scans for all the samples. The FTIR spectra were recorded as thin films on a single Si(100) wafer. The UV-visible spectra were recorded using a Varian Cary 5 double-beam spectrophotometer with 150 nm/min speed with a resolution of 2 nm over a wavelength range from 800 to 350 nm. The UV-visible absorption measurements were recorded using monoliths of Nano-CdS/meso-SiO2materials.
Results and Discussion
The nonionic surfactants, CnEOmhave a hexagonal
meso-phase both in water around 40-70% w/w water/surfactant (LLC) and also after dissolving some of the transition metal salts directly in the surfactant (metallotropic liquid crystalline, MLC). The salt-surfactant systems are liquid at very low salt concentrations (0.5-1.2 salt/surfactant mole ratios), hexagonal at salt/surfactant mole ratios between 1.2 and 3.2 and cubic at higher salt concentrations.26 In both, water mediates the self-assembly processes, free water in the LLC and coordinated water (M-OH2) in the MLC systems. In this article we took advantage of both the TLC approach and the stable MLC mesophase of a salt-surfactant system to introduce very large quantities of Cd2+ ions into the mesoporous/mesostructured silica materials. Through out this work, we have used C12EO10as a surfactant and [Cd(H2O)4 ]-(NO3)2as a salt source.
The mixture of water-salt-surfactant has an LC meso-phase, which collapses upon water evaporation at low salt concentrations (salt/surfactant mole ratio below 1.2). How-ever, at higher salt concentration the mixture is in the liquid phase and becomes LC with the evaporation of excess water.31With the evaporation of excess water, the coordi-nated water molecules, M-OH2, mediate the self-assembly process and maintain the MLC mesophase. The silica source, TMOS in the presence of acid, undergoes hydrolysis and polymerization reactions in the hydrophilic regions of the LC media. The ingredients, water, [Cd(H2O)4]2+and NO3 -ions, and silica species collectively induce self-assembly in surfactant molecules to transform to a metallosilicatropic LC mesophase. The ratio of the salt to silica source and salt to surfactant are important parameters in this self-assembly process.
Note also that the LC mesophase of a [Cd(H2O)4](NO3)2 -C12EO10appears at a∼1.20 mole ratio with a 2D hexagonal structure and changes to a cubic mesophase above a 3.20 mole ratio.25However, in the presence of the silica species, the isotropic cubic mesophase appears at relatively low salt concentrations. The new approach has advantages for controlling (i) the structure type of the host material by varying the concentration and type of salt, (ii) the amount of loading of the metal ion in the mesostructured silica host, and (iii) the morphology of the materials (transparent film and monoliths).
The influence of the anions on the synthesis of mesoporous materials has been recently realized by many groups.37-39It
was discovered that the Hofmeister series, SO42-> HPO 4
2-> CrO4-> CO32-> Cl-> Br-> NO3-> I-> ClO4-> SCN-, is effective in the process of self-assembly. Dag et al.27,28,31 have also investigated that the counteranions of transition metal salts have a strong influence on the solubility of the salts in CnEOmtype surfactants and on the formation
of MLC mesophases. For example, the hydrotropic nitrate ion salts give 2D and 3D hexagonal mesophases and the solubility is reasonably good. On the other hand, lyotropic anion (left-hand side of the series) salts, such as chlorides and sulfates, are insoluble in CnEOmtype nonionic
surfac-tants. Interestingly the perchlorate salt is moderately soluble and forms a cubic mesophase. Note also that the lyotropic anions, such as chloride and sulfate, make CnEOmsurfactants
more hydrophobic, while the hydrotropic anions (right-hand side of the series, such as nitrate and perchlorate) make them hydrophilic. The hydrophilicity and hydrophobicity of the media determines the solubility of the salt; however, the structure type is mainly determined by the charge density of the media.31
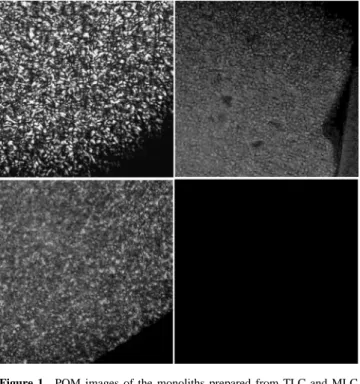
A series of POM images of a [Cd(H2O)4](NO3)2/CnEOm/
silica system are shown in Figure 1. At low salt concentra-tions, the LC mesophase is anisotropic (hexagonal) and produces 3D hexagonal mesostructured silica materials; however, at a higher salt concentration, the anisotropic mesophase disappears with an increasing salt concentration and becomes isotropic at around a salt to surfactant mole ratio of 1.25, Figure 1. All the samples diffract at low angles indicating that the mesostructured silica maintains its integrity even at high cadmium nitrate concentrations, Figures 2 and 3. The film samples obtained by dip coating from a solution of X-350H2O-1.44HNO3-1C12EO10-6.59TMOS (mole ratios), where X is between 0.0 and 1.0 mol of [Cd(H2O)4 ]-(NO3)2, are 3D hexagonal. The film samples are oriented and respond to the rotation of the samples with respect to (37) Leontidis, E. Curr. Opin. Colloid Interface Sci. 2002, 7, 81.
(38) Yu, C.; Tian, B.; Fan, J.; Stucky, G. D.; Zhao, D. J. Am. Chem. Soc. 2002, 124, 4556.
(39) Che, S.; Lim, S.; Kaneda, M.; Yoshitake, H.; Terasaki, O.; Tatsumi, T. J. Am. Chem. Soc. 2002, 124, 13692.
Figure 1. POM images of the monoliths prepared from TLC and MLC
approaches, where the salt/surfactant mole ratios are (top, left) 0.5, (bottom, left) 0.7, (top, right) 1.0, and (bottom, right) 1.5.
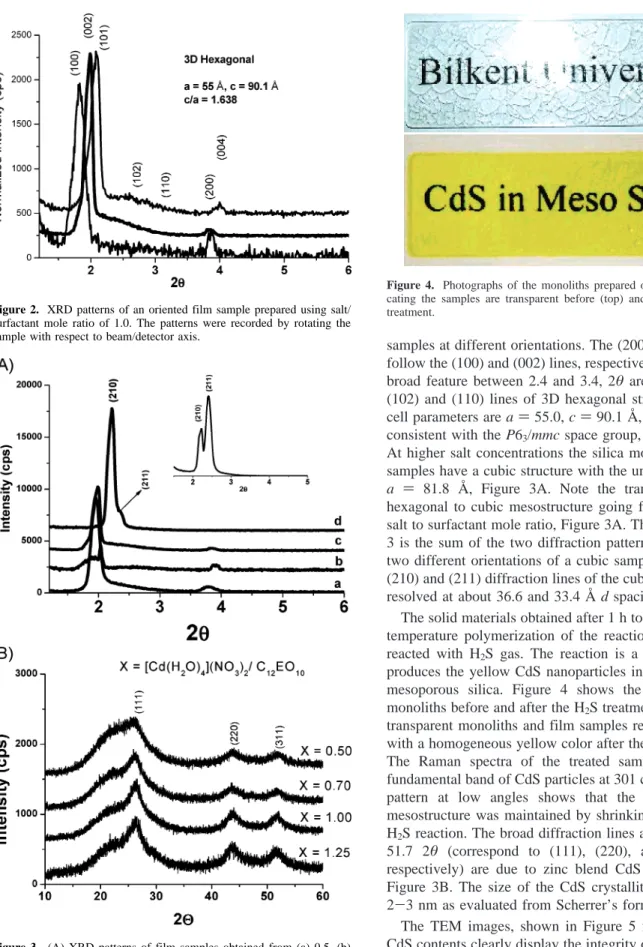
the beam detector axis of the X-ray diffractometer, Figure 2. The (100), (002), (101) diffraction lines of the 3D hex-agonal structure are well resolved by measuring the film
samples at different orientations. The (200) and (004) lines follow the (100) and (002) lines, respectively, Figure 2. The broad feature between 2.4 and 3.4, 2θ are assigned to the (102) and (110) lines of 3D hexagonal structure. The unit cell parameters are a ) 55.0, c ) 90.1 Å, and c/a ) 1.638 consistent with the P63/mmc space group, Figures 2 and 3. At higher salt concentrations the silica monoliths and film samples have a cubic structure with the unit cell parameter
a ) 81.8 Å, Figure 3A. Note the transition from 3D
hexagonal to cubic mesostructure going from a 1.0 to 1.5 salt to surfactant mole ratio, Figure 3A. The inset in Figure 3 is the sum of the two diffraction patterns recorded from two different orientations of a cubic sample. Note that the (210) and (211) diffraction lines of the cubic phase are well resolved at about 36.6 and 33.4 Å d spacing.
The solid materials obtained after 1 h to 10 days of room temperature polymerization of the reaction mixtures were reacted with H2S gas. The reaction is a fast process and produces the yellow CdS nanoparticles inside the pores of mesoporous silica. Figure 4 shows the photographs of monoliths before and after the H2S treatment. Note that the transparent monoliths and film samples remain transparent with a homogeneous yellow color after the H2S treatments. The Raman spectra of the treated samples display the fundamental band of CdS particles at 301 cm-1. The PXRD pattern at low angles shows that the integrity of the mesostructure was maintained by shrinking∼3% after the H2S reaction. The broad diffraction lines at 26.4, 43.8, and 51.7 2θ (correspond to (111), (220), and (311) lines, respectively) are due to zinc blend CdS nanocrystallites, Figure 3B. The size of the CdS crystallites is on average 2-3 nm as evaluated from Scherrer’s formula.
The TEM images, shown in Figure 5 for two different CdS contents clearly display the integrity of the mesostruc-ture after the H2S reaction. The darker spots on the images are due to CdS nanoparticles with an average size of 2-3 nm that is consistent with the XRD results. Note also that the channels are well ordered and oriented in the samples prepared using low salt concentrations (0.5 Cd2+/C
12EO10), Figure 5 (top), and relatively disordered in the high salt containing sample (1.0 Cd2+/C12EO10), Figure 5 (bottom). Figure 2. XRD patterns of an oriented film sample prepared using salt/
surfactant mole ratio of 1.0. The patterns were recorded by rotating the sample with respect to beam/detector axis.
Figure 3. (A) XRD patterns of film samples obtained from (a) 0.5, (b)
0.7, (c) 1.0, and (d) 1.5 salt/surfactant mole ratio. The inset is the sum of two diffraction patterns recorded from sample d in two different orietations. (B) XRD patterns at high angle region of H2S-treated samples obtained from the monoliths.
Figure 4. Photographs of the monoliths prepared on a glass slide indi-cating the samples are transparent before (top) and after (bottom) H2S treatment.
Furthermore the TEM measurements are required to inves-tigate the locations of the CdS nanoparticles, particularly in samples having low CdS contents.
The hydrolysis and polymerization reactions of the silica source in various compositions were monitored using FTIR spectroscopy to elucidate the behavior of the nitrate ions. This is particularly important in showing the influence of anions on the mesophase. During the polymerization process, it was observed that the intensity of the free nitrate peak at 1365 cm-1decreases while the coordinated nitrate ion signal intensities at 1290 and 1460 cm-1are increasing. Note also that the free nitrate has a degenerate asymmetric stretching mode at around 1365 cm-1and splits into two nondegenerate modes observable at around 1290 and 1460 cm-1 upon coordination to Cd2+center (Cd-O
2NO). Since the coordi-nation of the nitrate ion to the metal center reduces the charge on the complex ion ([Cd(H2O)4]2+to [Cd(H2O)2(O2NO)]
+
), it prevents the crystallization of cadmium nitrate salt in-side and/or out in-side of the pores. The spectra of the final product, mesostructured [Cd(H2O)4](NO3)2/C12EO10/SiO2
com-posites with various cadmium nitrate content, show that the nitrate ions are coordinated to the cadmium ion as a unidentate and/or bidentate ligand.27 The H2S treatment removes this coordination and the free nitrate peak reappears in the spectrum.
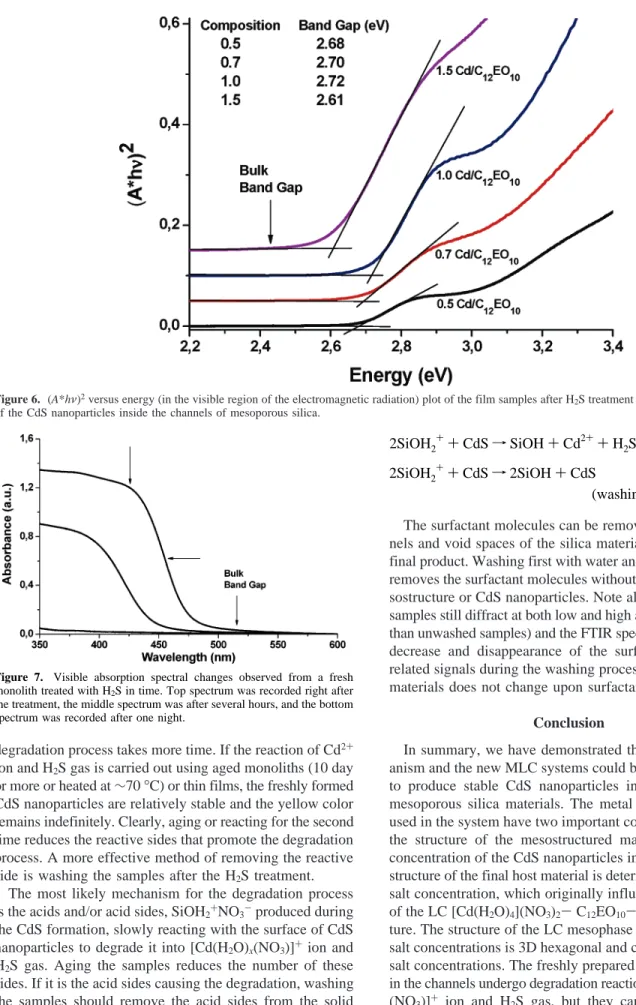
The electronic absorption spectra of the H2S-treated sam-ples were recorded using both monoliths and thin films on glass substrates in transmittance mode, Figure 6. Note that the absorption edge of the treated sample blue-shifts with increasing salt concentrations up to a Cd2+/C12EO10 mole ratio of 1.0 (CdS/SiO2w/w percent of 36.5) and red-shifts at high concentrations, Figure 6. The blue-shift of the band gap (2.72 eV compared to bulk value 2.42 eV) and sharp absorption edge are indications of the quantum size effect (QSE) and the uniform size distribution of the CdS nano-particles in the channels of mesostructured silica materials. The direct band gap fit of the absorption edge gives∼2.70 eV for the low salt concentrations and∼2.61 eV for the 1.5 salt/surfactant mole ratio. These band gap values correspond to approximately a 2.2- and 2.8-nm particle radius as evaluated from Brus’s effective mass model.40The particle size obtained from the optical band gap is also consistent with the particle size evaluated from PXRD data using Scherrer’s equation and TEM images. The blue-shift on the absorption edge of the samples going from a mole ratio of 0.5-1.0 indicates the formation of smaller particles with increasing particle nucleation sites. However the red-shift on the sample with a 1.5 mole ratio could be explained by the spatial density and proximity of the Cd(II) sites which act as nucleation sites for the CdS particles and thus possibly changes the average size obtained. It seems that the particle size may be controlled, in part, by the order or the structure of the mesophase. However, further studies are required to elucidate the correlation between the blue-shift of the band gap and the pore size, the concentration of the cadmium salt, and the salt type.
The unwashed fresh monolithic samples are not stable and undergo degradation reactions to reproduce Cd(II) and H2S after a few hours of the H2S reaction. The H2S-treated yellow samples become transparent (colorless) over time, Figure 7. The degradation takes place under ambient laboratory conditions, in a vacuum, or in the dark. However, the degradation could be reduced or completely overcome by aging the composite materials before the H2S reaction. The degradation process was monitored using UV-visible ab-sorption and FTIR spectroscopy. First the intensity of the absorption band at∼460 nm diminishes and the absorption edge slowly blue-shifts further and eventually disappears, Figure 7. The nitrate signals at around 1290 and 1460 cm-1 due to the coordinated nitrate ion, ([Cd(H2O)2(O2NO)]+) were followed from the FTIR spectra. The signals due to the coordinated nitrate ion disappear after a reaction with H2S gas but re-form upon degradation. These observations indicate that the H2S initially produces CdS nanoparticles, which degrade back to [Cd(H2O)2(O2NO)]+ ion in the channels of the silica materials. The degraded samples can be reacted with H2S for a second time, but this time the
(40) Brus, L. J. Phys. Chem. 1986, 90, 2555. Figure 5. TEM images of the Nano-CdS/meso-SiO2obtained from (top)
degradation process takes more time. If the reaction of Cd2+ ion and H2S gas is carried out using aged monoliths (10 day or more or heated at∼70°C) or thin films, the freshly formed CdS nanoparticles are relatively stable and the yellow color remains indefinitely. Clearly, aging or reacting for the second time reduces the reactive sides that promote the degradation process. A more effective method of removing the reactive side is washing the samples after the H2S treatment.
The most likely mechanism for the degradation process is the acids and/or acid sides, SiOH2+NO3-produced during the CdS formation, slowly reacting with the surface of CdS nanoparticles to degrade it into [Cd(H2O)x(NO3)]
+
ion and H2S gas. Aging the samples reduces the number of these sides. If it is the acid sides causing the degradation, washing the samples should remove the acid sides from the solid matrix as nitric acid and stabilize the CdS nanoparticles (see the following proposed reaction mechanism). Note that the washed sample (after H2S reactions) retains its yellow color indefinitely. The likely mechanism is as follows:
The surfactant molecules can be removed from the chan-nels and void spaces of the silica materials by washing the final product. Washing first with water and then with alcohol removes the surfactant molecules without disturbing the me-sostructure or CdS nanoparticles. Note also that the washed samples still diffract at both low and high angles (no different than unwashed samples) and the FTIR spectra show a gradual decrease and disappearance of the surfactant and nitrate related signals during the washing process. The color of the materials does not change upon surfactant removal.
Conclusion
In summary, we have demonstrated that the TLC mech-anism and the new MLC systems could be collectively used to produce stable CdS nanoparticles in the pores of the mesoporous silica materials. The metal ions or metal salt used in the system have two important contributions both to the structure of the mesostructured materials and to the concentration of the CdS nanoparticles in the structure. The structure of the final host material is determined by the metal salt concentration, which originally influences the structure of the LC [Cd(H2O)4](NO3)2- C12EO10-H2O-TMOS mix-ture. The structure of the LC mesophase obtained from low salt concentrations is 3D hexagonal and cubic from the high salt concentrations. The freshly prepared CdS nanoparticles in the channels undergo degradation reactions into [Cd(H2O)x
-(NO3)]
+
ion and H2S gas, but they can be stabilized by washing the Nano-CdS/meso-SiO2nanocomposite materials after the completion of H2S reaction. Since the degradation process etches and reduces the particle size of Nano-CdS, the etching process (etching time) could be a good parameter Figure 6. (A*hν)2versus energy (in the visible region of the electromagnetic radiation) plot of the film samples after H2S treatment indicating the bad gaps of the CdS nanoparticles inside the channels of mesoporous silica.
Figure 7. Visible absorption spectral changes observed from a fresh
monolith treated with H2S in time. Top spectrum was recorded right after the treatment, the middle spectrum was after several hours, and the bottom spectrum was recorded after one night.
2SiOH2++ CdS f SiOH + Cd2++ H2S(g) (degradation) 2SiOH2++ CdS f 2SiOH + CdS
to obtain smaller particles in the channels. The particle size of the Nano-CdS/meso-SiO2 could be monitored and con-trolled by UV-visible absorption spectroscopy and consecu-tive washing treatment.
Acknowledgment. For the financial support, O¨ .D. grate-fully acknowledges the Scientific and Technical Research
Council of Turkey (TU¨ BI˙TAK) in the framework of the project TBAG-2263 (102T188), the Turkish Academy of Science in the framework of Young Scientist Award (O¨ D/TU¨BA-GEBY˙P/ 2002-1-6), and the Faculty Development grant of Bilkent University.