On the Frequency-Band Selection for
Ground-Penetrating Radars Operating Over Lossy and
Heterogeneous Grounds
UEUR
Oduz*
A N D LEVENT GURELBILKENT UNIVERSITY BILKENT, ANKARA. TURKEY
(uoguzQcern.bilkent.edu.tr, 1gurelQee.bilkent.edu.tr)
DEPARTMENT O F ELECTRICAL AND ELECTRONICS ENGINEERING
1
Introduction
T h e finitc-difference tirrie-doindin (FUTD) method is one of the most versatile iiiodeling and sinrulatiori techniques used for tlie investigation of subsurface-scattering iiieclianisiris involving arbitrarily coniplicatcd inhomogeneities. T h e adaptability of the perfectly-~uatclied layer (PML) absorbing boundary conditions (ABCs) t o lossy and layered media improves the suitability of the FDTD t o simulate subsurface- scattering problems, such as grourid-penetrating-radar (GPR) scenarios [l].
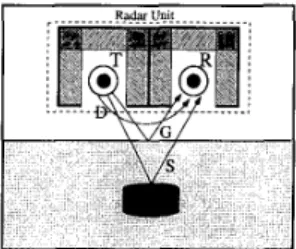
A typical GPR scenario. displayed in Fig. 1 , consists of air, ground, the buried
target, and tlie radar unit. In this paper, the air is modeled by vacuum, ground is modeled by a heterogeneous and lossy dielectric half-space, and the buried target is modeled by a conducting disk. The GPR unit contaiiis a transmitter and a receiver taht are isolated by conducting shields in order to degrade the large direct coupling (D) to the rcceiver with respect to the signal scattered from an embedded body (S). Practical GPR shields iiiclude high-performance absorbers on the inner walls of shield walls in order to prevent the resonance effects. In this paper, the ab- sorbers mounted 011 the inner walls of tlie shield walls are simulated using the PML
ABCs. This GPR model including conducting shield walls and PML absorbers is
designed especially for computational studies [Z]. The transmitting antenna is a n z-polarized dipole, modeled by a single Yee cube of constant current density. The receiver is also modeled as a sniall dipole that samples the x component of the electric field in time. The time variation of the current source on the transmitter is given in [2].
Figure 1: The typical GPR problem and the GPR configuration with a transmitter and a receiver.
2
Properties
of Lossy
Media
Although the electrical parameters. E and U, of real-life soils are almost constant
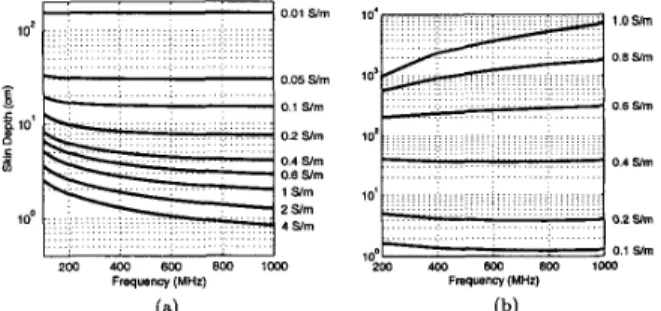
for practical GPR frequencies [3], lossy grounds still yield different reflection and transmission coefficients for different frequency components. A useful parameter for the investigation of the relation between conductivity and frequency is the skin depth, 6 , the distance through which the amplitude of a traveling wave decreases by a factor of l / e . Figure 2(a) displays the skin-depth values in the frequency hand of 100 MHz-1 GHz for various conductivity values of a medium with 8 t o permittivity and po permeability. Figure 2(a) demonstrates that the skin depth of the medium has a small percentage of change in this frequency hand for the Conductivity values smaller than 0.2 S/m. However, after 0.2 S/m, the skin-depth values start to show more variation as the frequency is increased from 100 MHz to
1 GHz.
3
Simulation Results
for
Homogeneous Grounds
In this section, the results of simulations performed a t a stationary point above the ground, i.e., A-scan results, will be presented. In these simulations, perfectly conducting disks, with 2.5 cm radius and 4 cm height, are buried 2.5 cm and 10 cm under the ground with 860 permittivity. T h e scattered-signal energies of the 2.5-cm-deep and 10-cin-deep targets are computed to reveal the amount of decay encountered by the incident wave as it propagates in the ground. The ground conductivity varies between 0.1 S/m-1.0 S/m and the center frequency is varied between 200 MHz-1000 MHz. For all configurations, the energy of the signal received from the 2.5-cm-deep target is divided by the energy of the signal received from the 10-cm-deep target. The resulting ratios are plotted in Fig. 2(b), which demonstrates that for conductivities below 0.5 S/m, changing the center frequency does not influence the energy scattered from the deeper target. However, after 0.6 S/m, decreasing the center frequency of the source signal from 1000 MHz to
200 MHz increases the relative energy of the target buried a t 10 cm.
0 1 Y m
I
f
10' 0 0 2 Y m v) O 4 Y m O B Y m 1 Y m 2 Y m 4 Y m 1 00 1 0 % 0 8 Y m 1 0. 1 0' 0 8 Y m(4
(b)Figure 2: (a) The skin-depth values of the grounds with Conductivities between 0.01 S/m-2.0 S/m. (b) T h e ratios of the energies of the S signals, scattered from targets buried 2.5 cm and 10 cm under the ground.
4
Simulation Results of Heterogeneous Grounds
111 order to Suither demoiistrat.e t,lie effects of tlic frequency selectloll 011 the scat- t,ercd signals. the B-scan siiiiiilat,ioii result,s of tlic shielded GPR iiiodel ol~taiiicd above a Iiiglily-conductive Iictcrogeiieoiis iiiediuiii will be given l'lic reSerred grouiid uiodel. displayod in Fig. 3. is deiiscly liet,erogciicous. coiitaining 80 holesin the gr~iiind-air iliterface. 100 Iiighly coiiductiiig and 200 less coiiducting small bcattercrs cnibedded 111 t,lie groulid. Tlic target is a coiiductiiig disk with 2.6 ciii
radius and 4 cui lieiglit. buried 5 ciii uiider tlic ground. Figures 4-6 present tlie scattered-field images of the conductiiig disk obtanied with 200 MHz aiid 1000 MHz
and 0.05 S/m. 0.2 S/m and 0.6 S/iii ground coiiductivitics. respectively. The scatt,ered-ficld sigiials arc obtained by siibtractiiig a n average D+G signal. wliich is extracted fro111 extra siiiiulatioiis iiivolviiig a targct-free ground.
Y X
E'iguro 3. The heterogcneoirs grouiid iiiodcl
k'igurc 4 rlemoiist~ratcs that for thr: 0.115 S f i n value of the ground conductivity. it is possible to visually detect t,lw buried disk with both 200 MHz aiid 1000 MHz center Srequciir:ies. 011 the contrary, when tlic conductivity is increased to 0.6 S/m, it is not possible to observe the s~giials scattered from the disk for either center Sre- queucies. However, for tlie 0.2 S/Iii conduct,ivity value of the ground, tlie GPR with 2UU MHz ceiiter frequency call detect. tlic target. while the GPR with 1000 MHz
center frcquency caiiiiut.
5
Concluding Remarks
'l'llc FD'I'D iiicthod and t,he P M L ABC is applied to demonstrate the conductivity-
Sreqiieiicy relatioils ill a tIiree-,iiiiicnsioiial GPR probleiu iiivolviiig lossy and het- crogeiicoiis grolliid Tlie selection of the center frequency of thc source signal can influelice thi: GPR iiieasiirciiieiits if tlicsc iiieasurcriiciits are performed above a Ii~gIily-r:onrliictillg soil. However. siiice t,lie skill dept,li of a typical groiiiid model. wit,li n ~midiict.ivit,y valua a ro i m l 0 1 S f i l l : iloes iiot change rapidly. tlic enliancc- iiiclit of t,he target, detectiiiii is not ccrt,aiii with tlie alteration of the center Sre-
qllf~llcy.
References
[l] F. L. Teixcrid: if' C Chew. A I Stiaka a i d h4. L. Oiistaglio. "Fiiiite-rliffeieilce
I iiiuxlomiiti siiriulatiriii or Ri',uird~i)ciiel.iatiiig I adai 011 dispersive. iiilioiriogeneoris
m i l coidur:t,ive soils." IEEE Tram Geoacie,~ce u r d Rcrrrute Seti.sw~g. vol. 36. 110. G.
pp. 1925--1937. Nuv. 1098.
[2] U. O B o z iu~d L. G u e l . "A,Iocleli~ip, of ~ i ~ i i i i d - i ) e i i t ) t i a t i i i p - ~ a d a i antcnrias with slnalds
iiiid siiiiulatad a l i s o ~ b e ~ s . " IEEE nana. A711e7mis Propugat., accepted
[3] D. .I Dwiiels. Su7/r~ce-Pe7ietrolirrr/ Rudot.. Loridox IEE. 199G, Ch. 111: pp. 33-60
Figure 4: Simulation results of a conducting disk, buried under a ground with con- ductivity 0.05 S/m, obtained a t (a) 200 MHz and (b) 1000 MHz center frequency.
50 l W 150 Hm
5
2Y)E..
3Y) 4w .en E wl
1
"
m
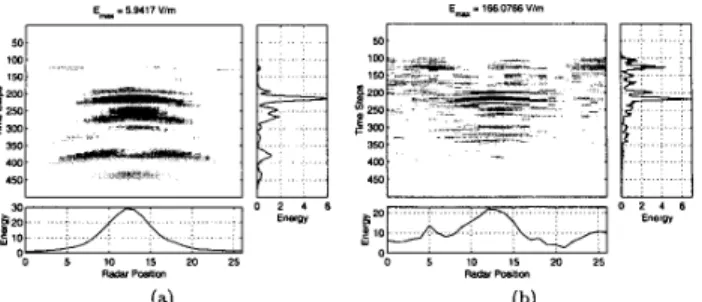
O E&' 00 5 10 15 20 25 R- P d b m 0 5 10 IS 20 25 %@a, PBlm., (a) (b)Figure 5 Simulation results of a conducting disk, buried under a ground with conductivity 0 2 S/m, obtained at (a) 200 MHz and (b) 1000 MHz center frequency
E- i 135 7167 Vlm
3501
I
4m
,,J
Figure 6: Simulation results of a conducting disk. buried under a ground with conductivity 0.6 S/m, obtained at (a) 200 MHz and (b) 1000 MHz center frequciicy.