Sequence analysis
Implicit motif distribution based hybrid computational kernel for
sequence classification
Volkan Atalay
1,2and Rengul Cetin-Atalay
1,3,∗1Virginia Bioinformatics Institute, Virginia Polytechnic Institute and State University Blacksburg, VA 24061, USA, 2Department of Computer Engineering, Middle East Technical University, TR-06531 Ankara, Turkey and 3Department of Molecular Biology and Genetics, Faculty of Science, Bilkent University, 06533 Ankara, Turkey Received on September 24, 2004; revised on December 6, 2004; accepted on December 7, 2004
Advance Access publication December 14, 2004
ABSTRACT
Motivation: We designed a general computational kernel for classific-ation problems that require specific motif extraction and search from sequences. Instead of searching for explicit motifs, our approach finds the distribution of implicit motifs and uses as a feature for classification. Implicit motif distribution approach may be used as modus operandi for bioinformatics problems that require specific motif extraction and search, which is otherwise computationally prohibitive.
Results: A system named P2SL that infer protein subcellular target-ing was developed through this computational kernel. Targettarget-ing-signal was modeled by the distribution of subsequence occurrences (impli-cit motifs) using self-organizing maps. The boundaries among the classes were then determined with a set of support vector machines. P2SL hybrid computational system achieved ∼81% of prediction accuracy rate over ER targeted, cytosolic, mitochondrial and nuclear protein localization classes. P2SL additionally offers the distribu-tion potential of proteins among localizadistribu-tion classes, which is par-ticularly important for proteins, shuttle between nucleus and cytosol. Availability: http://staff.vbi.vt.edu/volkan/p2sl and http://www.i-cancer. fen.bilkent.edu.tr/p2sl
Contact: [email protected]
1 INTRODUCTION
Proteomics and systems biology are emerging fields as a result of recent advances in molecular biology, which produce large-scale genomic data. In addition, computational techniques generate new putative protein sequences predicted from genomes. Therefore, com-putational analysis techniques, which aim to develop tools for functional annotations to protein sequences, are highly required in the post-genomic era (Eisenberg et al., 2000). Accurate and descriptive protein sequence annotations depend on the determination of par-ticular amino-acid subsequences called protein motifs that are spe-cifically related to a biochemical function. In general, computational motif discovery tools (Bailey and Elkan, 1994; Blekas et al., 2003), focus on the explicit search and identification of motifs. Sequence motifs are identified by three approaches: deterministic patterns (PROSITE, PRINTS), profiles (BLOCKS, PROSITE, MEME) and probabilistic patterns with hidden Markov models (PFAM) (Henikoff and Henikoff, 1991; Attwood and Beck, 1994; Bailey and Elkan, ∗To whom correspondence should be addressed.
1994; Bucher and Bairoch, 1994; Bateman et al., 2004). Sequence motif discovery is more difficult than it might seem because many sequence motifs are discontinuous and not only the spacing between the residues but also the order in which they occur may vary. Therefore, whole or partial sequence analysis may be applied to each particular functional protein annotation problem. The sequence motifs are used for functional annotation of proteins with additional operations such as PROFILESCAN, BLIMPS and MAST (Henikoff and Henikoff, 1991; Bailey and Gribskov, 1998). The approach we present here, which is based on the use of distribution of implicit motif features may be employed as a general computational kernel for classification problems in genome and proteome analysis that necessitate specific motif extraction and search, which is otherwise computationally prohibitive.
Analysis of the subcellular localization of a newly identified pro-tein is invaluable for the characterization of its function. Eventually, studying subcellular localization and developing predictors may have implications in systems biology in terms of a better representation of cellular machinery with respect to the site of protein action (Demir et al., 2002). There have been several studies to predict protein subcellular localization based on primary sequence as well as three-dimensional structure information (Dierendonck et al., 1997; Nakai, 2000; Emanuelsson, 2002; Mott et al., 2002). Traditional compu-tational predictors concentrate on the presence of signal peptide cleavage sites on protein sequences using machine-learning tech-niques (i.e. NNPSL, TargetP, SignalP, SortPred, SubLoc). Recently, in addition to machine learning techniques, hybrid methods that cover extensive biological knowledge, such as protein sequence homology, protein and literature database text analysis, have been applied to attain a better accuracy of prediction (i.e. LOC3D, PA-SUB, PSORT-B and SMART) (Emanuelsson et al., 2000; Mott et al., 2002; Nair and Rost, 2003; Gardy et al., 2003; Lu et al., 2004).
The aim of this study is to demonstrate the application of distribution of implicit motifs as a feature for classification on the prediction of subcellular localization of proteins in eukaryotic organisms. Therefore, we designed and developed a system called prediction of protein subcellular localization (P2SL). P2SL uses local subsequence features along with various amino acid similar-ity schemes. We used the self-organizing map (SOM) for proto-type feature extraction and implicit protein sorting signal (motif) distribution. Subsequently a set of support vector machines (SVMs) is used for the classification of the features extracted by SOM.
2 SYSTEMS AND METHODS
2.1 Computational problem definition
From computational point of view, the prediction of subcellular localization among n-compartments can be stated as an n-class classification problem. In P2SL system n is determined by the following four compartments ER targeted (all ER-mediated membrane enclosed proteins), cytosolic, mito-chondrial and nuclear: given n sets of primary sequence samples that are drawn from n unknown probability distributions, construct a system that can label a compartment (one of n) when used on new samples drawn from the same probability distributions.
Here, we assumed that the group of protein sequences targeted to a com-partment has a particular probability distribution. However, neither the type nor the parameters of the distribution are known. From computational point of view we are given n sets of primary sequence samples each of which is drawn from one of the n above-mentioned groups. In addition, we know from which group these samples are drawn; i.e. the samples are labeled with their correct compartments. Subsequently, a new protein sequence (exclusive of the labeled sets) is classified to one of the n compartments. The problem is to construct a system that will predict to which of the groups the new sequence belongs. For training, n-sets of labeled samples would be used and the trained system would be employed to predict the label of the new sample.
2.2 General approach
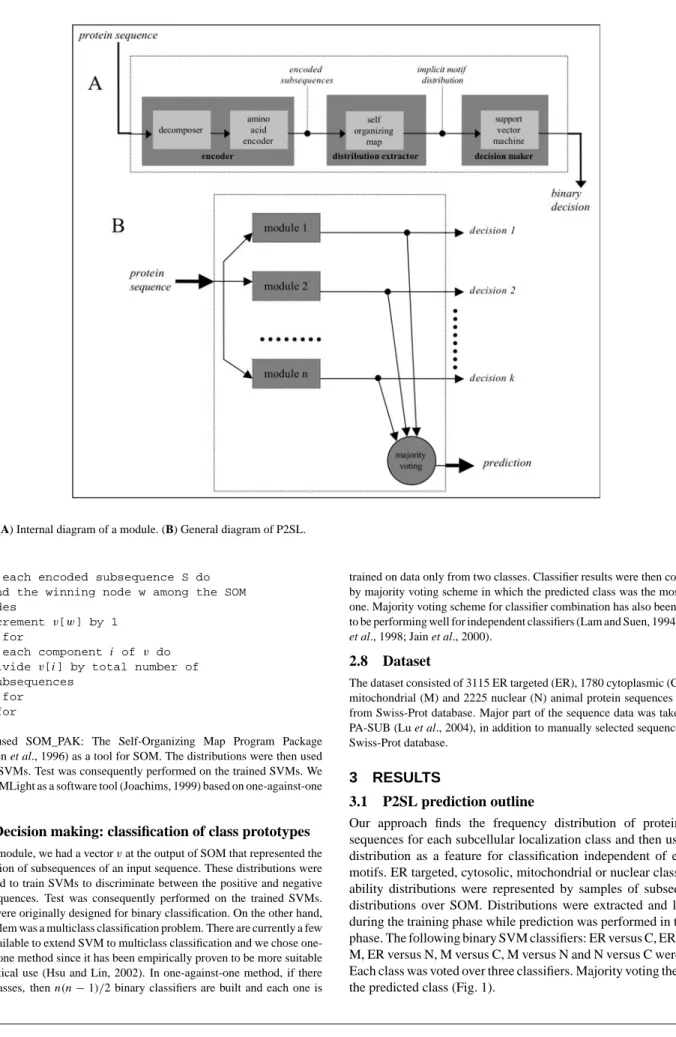
The system was composed of a set of modules (Fig. 1). A module indicated whether the input sequence was of one of two particular classes. Therefore, if there were n classes, we had k = n(n − 1)/2 modules. Each module was composed of an encoder, a distribution extractor and a decision maker (Fig. 1A). The input to a module was amino acid primary sequences. An input primary sequence was decomposed into subsequences. Each subsequence was then encoded with an amino acid similarity matrix (see below). We fed the encoded subsequences to SOM. During the training phase of SOM, distributions of amino acid order for two classes particular to the module were determined by the winning nodes of SOM. In the space, the boundary between the two classes was learned by an SVM. In the test phase, when the subsequences of an unknown query sequence were given, according to the corresponding winning nodes in the SOM, a distribution was obtained and it was fed to SVM to be classified into one of the two already learned distributions.
2.3 Self-organizing maps and support vector machines
We used two machine-learning methods in a hybrid way: SOMs and SVMs. SOM has a competitive unsupervised learning algorithm and it can be used for clustering and to construct nonlinear projection of the data onto a low-dimensional space as well (Kohonen, 1997). SOM algorithm leads to an efficient representation of the statistical structure implicit in the input samples and it generates a set of prototype vectors representing templates for a group of input samples mapped onto a node or to a set of neighboring nodes. The latter process is known as vector quantization, which is a form of dimen-sionality reduction. We explore particularly this property of SOM. SVM is a discriminative supervised statistical machine learning method for regression and classification (Boser et al., 1992; Burges, 1998; Vapnik, 1998; Scholkopf
et al., 1999; Cristianini and Shawe-Taylor, 2000). When learning from data,
traditional machine learning and pattern recognition methods minimize train-ing error in a particular norm. On the other hand, SVM is an approximate implementation of structural risk minimization and it constructs a hyperplane, i.e. linear division, in terms of a subset of the training data and the hyperplane separates negative and positive examples with the maximum margin. Prior to finding the hyperplane, it is possible to map, linearly or non-linearly, the training data into a higher dimensional space by a kernel function to seek a linear boundary. In addition, SVM permits some misclassifications by build-ing a soft margin, which can be controlled by a parameter. This is very helpful when the data are noisy. After finding the hyperplane, previously unseen data in test set can be labeled by SVM. In practice, SVMs have been used in many
real-life applications and they have already been applied for several problems in bioinformatics and computational biology in particular (Noble, 2004).
2.4 Implicit motif frequency distribution by SOM and obtaining class prototype distribution
Extraction of implicit motif frequency distribution occured during the training of SOM and in this phase, subsequences of a subcellular localization class were topologically grouped and prototypes for each group were obtained. Therefore, the input dataset could be represented by a set of SOM prototype vectors, which were denoted by the winning nodes in the SOM. The problem of finding motifs particular to a class may then be interpreted as finding the nodes, i.e. prototype motifs, specific to a class. However, it is very hard to determine these motifs and the nodes specific to a class when sequence motifs are discontinuous. In addition, the spacing between the residues and also the order in which they occur may vary. The projection of these signal patches to one-dimension disperses the motif information throughout the protein primary sequence. Therefore, we use the distribution of winning nodes corresponding to each subsequence and the whole protein sequence is represented by the occurrences, i.e. distribution, of the winning nodes.
During the iterations, the prototype vector of each node is contributed by the input vectors mapped not only onto the node itself but onto the neighboring nodes as well. At the end of iterations, the prototype vectors are, in fact, local averages of subsequence data. Although the elements of input vectors are integers, the prototype vectors are composed of real numbers and therefore there may not exist one-to-one mapping back to amino acids subsequences from these prototype vectors that are the representatives of sequence motifs. Furthermore, we make use of the distribution of prototype vector occurrences rather than the prototype motif vectors themselves.
2.5 Protein sequence encoding
Protein sequences are composed of letters corresponding to amino acids and these letters are non-numerical entities. In order to be able to perform com-putation on these sequences amino acids should be represented by numerical values. We used amino acid similarity matrices for this purpose and we called this process as encoding.
Amino acids were first encoded by the corresponding row found in amino acid similarity matrices. For example, each amino acid in ‘MQT’ subsequence could be encoded as follows M = [−1 0 −2 −3 −5 −1 −2 −3 −2
2 4 0 6 0 −2 2 −1 −4 −2 2], Q = [0 1 1 2 −5
4 2 1 3 −2 −2 1 −1 −5 0 −1 −1 −5 −4 2], T =
[1 −1 0 0 −2 −1 0 0 −1 0 −2 0 −1 −2 0 1 3 −5 −3 0]. Then, they were concatenated in the order they are found in the sequence (MQT =
[−1 0 −2 −3 −5 −1 −2 −3 −2 2 4 0
6 0 −2 2 −1 −4 −2 2 0 1 1 2 −5 4 2 1 3 −2 −2 1 −1 −5 0 −1 −1 −5 −4 2 1 −1 0 0 −2 −1 0 0 −1 0 −2 0 −1 −2 0 1 3 −5 −3 0]) and a numerical subsequence vector was obtained. The effect of various encodings by amino acid similarity matrices are given and discussed in Section 3.3 and particularly in Table 1 by indicating the best and the worst encoding amino acid similarity matrices.
2.6 Implicit motif frequency distribution
Let X denote an encoded protein sequence and S denote a protein subsequence of length κ. If the dimension of SOM is m∗ n, any SOM node (i, j) can be represented as an integer via the map f (i, j )= i ∗m+j. Hence, a vector v of length (m∗ n) can be associated with each protein sequence X. The element of v is initialized to 0. For each subsequence S, the corresponding winning node w= (k, l), v[f (w)] is incremented. When all the subsequences are processed, each entry of v is normalized by the total number of subsequences in X. v gives the distribution of winning SOM nodes for a protein which becomes the input data for classification. This step is given in the following algorithm:
for a protein sequence X do initialize each entry of v to 0
Fig. 1. (A) Internal diagram of a module. (B) General diagram of P2SL.
for each encoded subsequence S do find the winning node w among the SOM nodes
increment v[w] by 1 end for
for each component i of v do divide v[i] by total number of subsequences
end for end for
We used SOM_PAK: The Self-Organizing Map Program Package (Kohonen et al., 1996) as a tool for SOM. The distributions were then used to train SVMs. Test was consequently performed on the trained SVMs. We used SVMLight as a software tool (Joachims, 1999) based on one-against-one method.
2.7 Decision making: classification of class prototypes
In each module, we had a vector v at the output of SOM that represented the distribution of subsequences of an input sequence. These distributions were then used to train SVMs to discriminate between the positive and negative class sequences. Test was consequently performed on the trained SVMs. SVMs were originally designed for binary classification. On the other hand, our problem was a multiclass classification problem. There are currently a few ways available to extend SVM to multiclass classification and we chose one-against-one method since it has been empirically proven to be more suitable for practical use (Hsu and Lin, 2002). In one-against-one method, if there are n classes, then n(n− 1)/2 binary classifiers are built and each one is
trained on data only from two classes. Classifier results were then combined by majority voting scheme in which the predicted class was the most voted one. Majority voting scheme for classifier combination has also been proven to be performing well for independent classifiers (Lam and Suen, 1994; Kittler
et al., 1998; Jain et al., 2000).
2.8 Dataset
The dataset consisted of 3115 ER targeted (ER), 1780 cytoplasmic (C), 1148 mitochondrial (M) and 2225 nuclear (N) animal protein sequences derived from Swiss-Prot database. Major part of the sequence data was taken from PA-SUB (Lu et al., 2004), in addition to manually selected sequences from Swiss-Prot database.
3 RESULTS
3.1 P2SL prediction outline
Our approach finds the frequency distribution of protein sub-sequences for each subcellular localization class and then uses this distribution as a feature for classification independent of explicit motifs. ER targeted, cytosolic, mitochondrial or nuclear class prob-ability distributions were represented by samples of subsequence distributions over SOM. Distributions were extracted and learned during the training phase while prediction was performed in the test phase. The following binary SVM classifiers: ER versus C, ER versus M, ER versus N, M versus C, M versus N and N versus C were used. Each class was voted over three classifiers. Majority voting then gave the predicted class (Fig. 1).
3.2 Selection of subsequence parameters
It has been reported that proteins which are to be ER targeted have a sorting signal known as signal peptide, of length∼20–25 amino acids in the N-terminal of the primary sequence, while proteins destined to the mitochondria usually contain an N-terminal mito-chondrial transfer peptide, 35 amino acids long on average (Nakai, 2000; Emanuelsson, 2002). There is no explicit signal sequence start site on the entire protein sequence of cytosolic and nuclear proteins. Nuclear localization signals can be found at any part of the sequence whereas cytosolic proteins and some of the nuclear proteins do not carry any signal motif at all. Hence, for each subcellular localization prediction class, the part of the sequence to be examined (L), win-dow length (κ) and slide offset for subsequences (t), were determined as different values after rigorous computational experimentation. In order to characterize the proteins targeted to ER, we analyzed the first 30 amino acids (L= 30), with a window length of 5 (κ = 5) and sliding the windows by one amino acid (t= 1) at a time. Similarly, for the proteins targeted to mitochondria, we investigate the first 40 amino acids (L= 40) with window length of 5 (κ = 5) and sliding the windows by one amino acid (t= 1). For proteins targeted to nuc-leus or destined to act in cytosol, our results demonstrated that the analysis of the entire sequence (L= all), with a window size of 15 (κ= 15) and sliding the window by 5 amino acids (t = 5) gives good prediction accuracy in addition to its advantage in computational time complexity.
3.3 Amino acid encoding
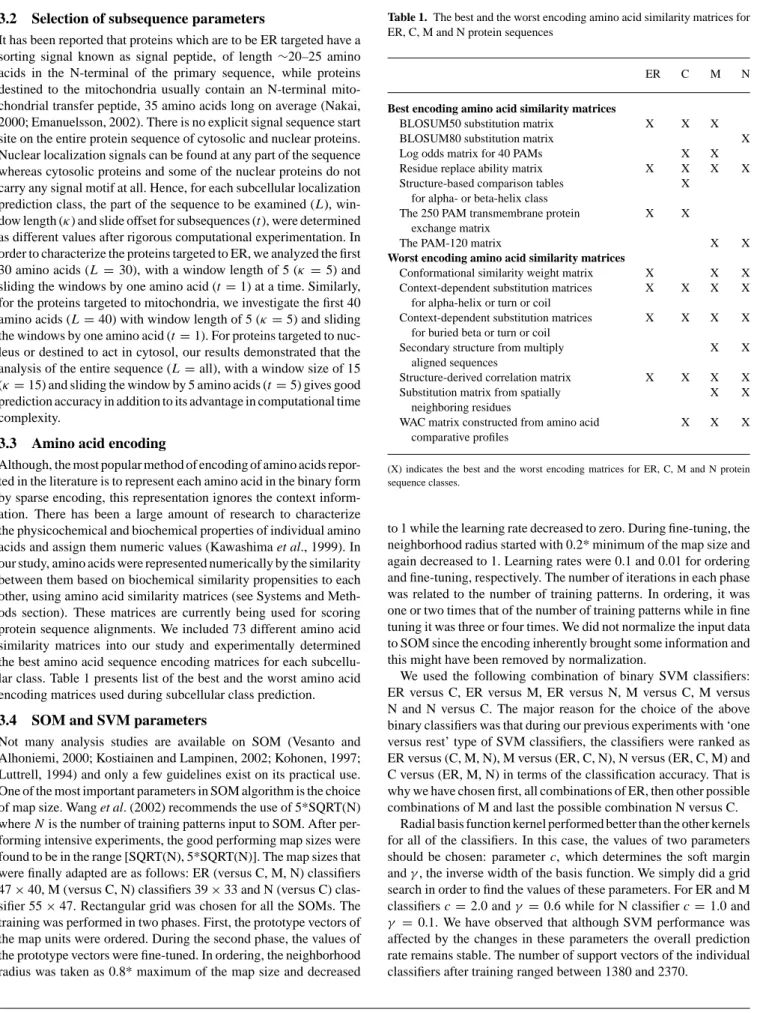
Although, the most popular method of encoding of amino acids repor-ted in the literature is to represent each amino acid in the binary form by sparse encoding, this representation ignores the context inform-ation. There has been a large amount of research to characterize the physicochemical and biochemical properties of individual amino acids and assign them numeric values (Kawashima et al., 1999). In our study, amino acids were represented numerically by the similarity between them based on biochemical similarity propensities to each other, using amino acid similarity matrices (see Systems and Meth-ods section). These matrices are currently being used for scoring protein sequence alignments. We included 73 different amino acid similarity matrices into our study and experimentally determined the best amino acid sequence encoding matrices for each subcellu-lar class. Table 1 presents list of the best and the worst amino acid encoding matrices used during subcellular class prediction.
3.4 SOM and SVM parameters
Not many analysis studies are available on SOM (Vesanto and Alhoniemi, 2000; Kostiainen and Lampinen, 2002; Kohonen, 1997; Luttrell, 1994) and only a few guidelines exist on its practical use. One of the most important parameters in SOM algorithm is the choice of map size. Wang et al. (2002) recommends the use of 5*SQRT(N) where N is the number of training patterns input to SOM. After per-forming intensive experiments, the good perper-forming map sizes were found to be in the range [SQRT(N), 5*SQRT(N)]. The map sizes that were finally adapted are as follows: ER (versus C, M, N) classifiers 47× 40, M (versus C, N) classifiers 39 × 33 and N (versus C) clas-sifier 55× 47. Rectangular grid was chosen for all the SOMs. The training was performed in two phases. First, the prototype vectors of the map units were ordered. During the second phase, the values of the prototype vectors were fine-tuned. In ordering, the neighborhood radius was taken as 0.8* maximum of the map size and decreased
Table 1. The best and the worst encoding amino acid similarity matrices for
ER, C, M and N protein sequences
ER C M N
Best encoding amino acid similarity matrices
BLOSUM50 substitution matrix X X X
BLOSUM80 substitution matrix X
Log odds matrix for 40 PAMs X X
Residue replace ability matrix X X X X
Structure-based comparison tables X
for alpha- or beta-helix class
The 250 PAM transmembrane protein X X
exchange matrix
The PAM-120 matrix X X
Worst encoding amino acid similarity matrices
Conformational similarity weight matrix X X X
Context-dependent substitution matrices X X X X
for alpha-helix or turn or coil
Context-dependent substitution matrices X X X X
for buried beta or turn or coil
Secondary structure from multiply X X
aligned sequences
Structure-derived correlation matrix X X X X
Substitution matrix from spatially X X
neighboring residues
WAC matrix constructed from amino acid X X X
comparative profiles
(X) indicates the best and the worst encoding matrices for ER, C, M and N protein sequence classes.
to 1 while the learning rate decreased to zero. During fine-tuning, the neighborhood radius started with 0.2* minimum of the map size and again decreased to 1. Learning rates were 0.1 and 0.01 for ordering and fine-tuning, respectively. The number of iterations in each phase was related to the number of training patterns. In ordering, it was one or two times that of the number of training patterns while in fine tuning it was three or four times. We did not normalize the input data to SOM since the encoding inherently brought some information and this might have been removed by normalization.
We used the following combination of binary SVM classifiers: ER versus C, ER versus M, ER versus N, M versus C, M versus N and N versus C. The major reason for the choice of the above binary classifiers was that during our previous experiments with ‘one versus rest’ type of SVM classifiers, the classifiers were ranked as ER versus (C, M, N), M versus (ER, C, N), N versus (ER, C, M) and C versus (ER, M, N) in terms of the classification accuracy. That is why we have chosen first, all combinations of ER, then other possible combinations of M and last the possible combination N versus C.
Radial basis function kernel performed better than the other kernels for all of the classifiers. In this case, the values of two parameters should be chosen: parameter c, which determines the soft margin and γ , the inverse width of the basis function. We simply did a grid search in order to find the values of these parameters. For ER and M classifiers c= 2.0 and γ = 0.6 while for N classifier c = 1.0 and
γ = 0.1. We have observed that although SVM performance was
affected by the changes in these parameters the overall prediction rate remains stable. The number of support vectors of the individual classifiers after training ranged between 1380 and 2370.
Table 2. Confusion matrix indicating the average percentage values of 4-fold
cross-validation over the test set
Actual Predicted label
ER C M N
ER 85.63 6.19 3.29 4.89
C 2.36 79.33 3.65 14.66
M 5.66 7.23 83.80 3.31
N 1.43 19.94 3.29 75.34
SD were between 0.34 and 2.62. Test sets had 1780 ER targeted, 445 cytosolic, 287 mitochondrial and 890 nuclear proteins, which were mutually exclusive of the training sets each time.
3.5 4-Fold cross-validation and performance assessment of P2SL
In order to assess the performance of the P2SL system, we performed a 4-fold cross-validation. The overall accuracy of the system was 81.96% on average with an SD of 0.43. However, the overall accuracy does not represent the true performance of prediction methods in gen-eral. Therefore, further statistical measures are required for detailed analysis of prediction. The results given by the confusion matrix were obtained by the average of 4-fold cross-validation experiments (Table 2).
In addition to confusion matrix for each class the evaluation of the P2SL prediction results was presented by four statistical measures defined as: precision, recall, F-score and specificity. These stat-istical measures were given in terms of true positives (tp, number of patterns predicted as of class K and actually they are of class K), false positives (fp, number of patterns predicted as of class K and they actually belong to other classes), true negatives (tn, number of patterns predicted not to be of class K and they actu-ally do not belong to class K) and false negatives (fn, number of patterns predicted not to be of class K and they actually belong to class K).
The employed statistical measures are then given in terms of the above definitions:
precision= tp/(tp + fp) recall= tp/(tp + fn)
F-score= 2 ∗ precision ∗ recall/(precision + recall) specificity= tn/(tn + fp)
Table 3 shows the average of these statistical measures for a 4-fold cross-validation. Precision measured the portion of the correctly assigned subcellular classes. Prediction precision of cytosolic pro-teins is relatively low, because there was no particular localization signal in protein function in cytosol, whereas subcellular localiza-tion of proteins having subcellular targeting peptides (Table 3, line 1 ER, M and N) was predicted with high precision. On the other hand, recall statistics of P2SL, i.e. the portion of the correct subcellular classes that were assigned, are similar for all classes, in addition to the F-score, which was an even combination of precision and recall. Specificity, which is the ability of P2SL to correctly identify the pro-teins that do not belong to the class to which they are not targeted in vivo, was high for all classes.
Table 3. Performance assessment of P2SL
ER C M N
Precision 97.47 53.37 69.98 80.57
Recall 85.63 79.33 83.80 75.34
F-score 91.17 63.80 76.20 77.86
Specificity 97.56 89.57 96.66 93.56
The numbers indicate the average percentage values of 4-fold cross-validation. SDs were between 0.29 and 2.62.
Table 4. Comparison of confusion matrices and statistical measures of the
results for Target-P and P2SL over one of the sets of 4-fold cross-validation
Actual Predicted label
ER M Other Confusion matrices ER TargetP 82.02 0.73 17.25 P2SL 84.66 2.98 12.36 M TargetP 18.12 54.70 27.18 P2SL 8.71 81.53 9.76 Other TargetP 2.25 8.61 89.21 P2SL 2.25 1.80 95.96 Statistical measures Precision TargetP 94.68 55.09 75.57 P2SL 96.48 75.24 83.78 Recall TargetP 82.02 54.70 89.15 P2SL 84.66 81.53 95.96 F-score TargetP 87.90 54.90 81.80 P2SL 90.19 78.26 89.46 Specificity TargetP 94.95 95.89 81.37 P2SL 96.61 97.53 88.00
3.6 Comparison with TargetP
TargetP is a neural network based tool for subcellular location pre-diction of proteins (Emanuelsson et al., 2000). Since TargetP is a computational tool similar to P2SL, we compared P2SL with Tar-getP. TargetP gives predictions in terms of only three classes: ER targeted (ER), mitochondria (M) and Other. Therefore, we arranged the predicted labels of P2SL such that cytosolic (C) and nuclear (N) were in the ‘Other’ class. We compared the results of TargetP with P2SL only on the first set of 4-fold cross-validation. The confusion matrices and statistical measures for the two systems are given in Table 4. On this set, the overall accuracy of P2SL was 88.83%, which was better than that of TargetP (82.54%). Similarly, all of the statistical measures of P2SL were better than those of TargetP. In addition, P2SL predicts for proteins targeted to nucleus and gives distribution possibilities about proteins shuffle between nucleus and cytosol.
We compared TargetP and P2SL on the same set of proteins that is exclusive of the training set of P2SL and the results given in Table 4 as confusion matrices and statistical measures. TargetP’s prediction accuracy degrades while P2SL maintains similar performances for all locations. We did further comparative analysis on both predictors. We particularly looked at the cases where one or both of the systems
Table 5. Comparison of prediction errors made by TargetP and P2SL for ER,
M and other (C and N) targeted proteins
TargetP P2SL
ER M Other
tp fn tp fn tp fn
tp 78.48 3.54 49.83 4.88 87.42 1.80
fn 6.18 11.80 31.71 13.59 8.54 2.54
Values are given as percentages. tp indicates true positives while fn indicates false negatives.
Table 6. P2SL predicted distribution of selected proteins that shuttle between
the nucleus and the cytosol
Protein Cytosola Nucleusa
β-catenin 3/3 2/3 PKCα 3/3 2/3 Hexokinase1 3/3 2/3 BCL2 3/3 2/3 BRCA1 2/3 3/3 p53 2/3 3/3 NF-κB p100/p49 2/3 3/3 E2F1 1/3 3/3
aPossibility of localization in cytosol or nucleus over three-voted classifiers.
fail (Table 5). Based on our analysis we observed that the percent-age of cases in which TargetP predicted erroneously when P2SL predicted correct was higher than the percentage of cases in which P2SL predicted erroneously and TargetP predicted correct (compare fn values: 6.18 versus 3.54, 31.71 versus 4.88 and 8.54 versus 1.80 in Table 5).
Furthermore, when we go through the individual cases of the res-ults, we observe that when both systems predict wrong, as in most of the cases, they predict the same compartment.
It is hard to compare the computational complexities of TargetP and P2SL since they are composed of several complex modules. However, it is clear that the most time consuming part is the training. Once the systems are trained, obtaining a prediction for a query sequence is rather fast for both the systems.
3.7 Protein distribution among localization classes
Each SVM classifier that we used for ER versus C, ER versus M, ER versus N, M versus C, M versus N and N versus C, gave a decision. These decisions were an input for majority voting (Fig. 1). Each class was voted by three classifiers generating a possibility of one over three. The sum of votes indicated the potential of the protein located in that class. However, it is meaningful to analyze and further interpret the decision results. In the P2SL system the number of votes for a localization class gives the distribution possibility for a protein among localization sites. Such distribution tendencies were particularly interesting in the case of proteins that shuttle between the nucleus and cytosol.
We selected eight proteins reported to move to the nucleus and interfere with gene expression control upon cell signal (Table 6). Four of these proteins (β-catenin, PKCα, hexokinase1 and BCL2) have
major functions in cytosol whereas the other four (BRCA1, p53,
NF-κB and E2F1) are primarily known as transcription factors (Schmalz et al., 1998; Hoetelmans et al., 2000; Fabbro and Henderson, 2003; Ahuatzi et al., 2004). Remarkably, P2SL analysis could predict that the first four proteins locate with a possibility of 3/3 in the cytosol and a possibility of 2/3 in the nucleus.
4 DISCUSSION
Recent scientific interest in molecular biology moves toward sys-tems biology that requires detailed functional analysis of genome and proteome. However large-scale data obtained through these ana-lyses should be confirmed by individual in vivo experiments. It is critical to select the experiments to be done since each of them is expensive in terms of time and economical resources. Therefore, predictive preliminary tools and models for this selection is invalu-able. Many proteins may have more than one function depending on where and when they operate during their cellular activities (Cyert, 2001; Henderson and Fagotto, 2002; Burchett, 2003). Prediction of the cellular behavior of a protein is one of the research interests in vivo and in silico that includes subcellular localization of the pro-teins. Biological processes are too complex to be modeled by a single approach. There are several approaches for the prediction of subcel-lular localization based on: sorting signals (TargetP, PSORT), amino acid composition (SubLoc), sequence homology (PA-SUB), gen-omic context with phyla analysis and domain projection (SMART) (Mott et al., 2002). Each method gives a prediction with certain reliability, thus single or combination of methods can be applied to a particular biological problem for better predictions. In our study, P2SL aimed to find out the protein-sorting subsequences for major subcellular localization classes: endoplasmic reticulum (ER) tar-geted, cytosolic, mitochondrial and nuclear. However, it was difficult to search directly for these subsequences particularly when they are discontinuous. In addition, the spacing between the residues and also the order in which they occur may vary in the case of nuclear pro-teins. Therefore, we used the distribution of implicit motifs for each localization class based on both amino acid order and composition. It was relatively simple to predict the localization of the proteins to ER or Mitochondria where the N-terminal signal peptides are determ-inants whereas for proteins targeted to nucleus or retained in cytosol, the prediction was difficult. In addition, these proteins may function in both the compartments. They may carry both types of sequence signals composed of small subsequence signal patches throughout the entire sequences. As mentioned in Section 3.2, the signal patches for proteins targeted to nucleus or destined to act in cytosol were modeled as subsequences of length of 15 amino acids. This means that there are 2015different possible subsequence compositions to look for. This is the cost of direct search, which is intractable. In P2SL system, we applied a heuristic: the use of implicit motifs where the motifs to be sought are not determined explicitly but extracted in a dif-ferent format from the training data. This extraction is performed by machine learning and pattern recognition methods. Theory and prac-tice of these techniques have been improved significantly and they have been successfully applied to areas such as character, speech, face recognition (Özer et al., 2001; Mohamed et al., 2004) as well as biological data analysis (Baldi and Brunak, 2001; Mjolsness and DeCoste, 2001).
When applying machine-learning techniques to a particular prob-lem, optimization and parameter selection based on the nature of the
input data, is highly important for the prediction performance. There-fore with different in silico experiments we tested various parameters in order to attain the best prediction performance. The parameter val-ues that were selected were stable. A small change in their valval-ues did not affect the prediction results significantly.
We also compared several amino acid similarity matrices for amino acid encoding. When matrices, generated based on amino acid replacements observed in closely related sequences, were used, the prediction accuracy of subcellular classes was better than those of the matrices generated based on structural properties of proteins (Table 1). Our observation is in correlation with subcellular localiz-ation prediction methods that use phyla and domain analysis based on genomic context (Mott et al., 2002).
When tested on nuclear proteins in general subcellular localiz-ation, predictors do not achieve high prediction rates. Many of them are transcription-related proteins and are kept in the cytosolic pool. When necessary they are translocated to the nucleus (Cyert, 2001; Burchett, 2003). Moreover, some of the nuclear proteins are partitioned between two compartments acting in both locations (Henderson and Fagotto, 2002). In general, protein sequences may reveal themselves mostly as targeted to stay in cytosol. Therefore in P2SL, proteins targeted to nucleus (19.94%) or stayed in cytosol (14.66%) were the most confused ones bilaterally. This is very consistent with the recent results by Scott et al. (2004) where 16% of human proteins are predicted to be multicompartmental. These results were in correlation with the cellular behavior of many nuc-lear proteins transcription factors, e.g. p53 or β-catenin, which are kept in a cytosolic pool until a cellular signal activates and sends them into the nucleus (Cyert, 2001; Henderson and Fagotto, 2002; Burchett, 2003). Accordingly, the high rate of confusion obtained by P2SL analysis of nuclear and cytosolic proteins reflected biological system behavior. Therefore, we took advantage of the binary P2SL– SVM classifiers to attribute possibilities for being in two different compartments as tested and demonstrated with the proteins given in Table 5. The proteins given in this table are initially described to act in the cytosol and then their novel function in the nucleus is discovered. However, proteins whose function mainly related to transcription regulation were predicted to be found in nucleus with 3/3 possibilities by the P2SL–SVM classifier. If a single decision is expected, classifier results could be combined by majority voting scheme in which the predicted class was the most-voted one. Never-theless, we believe that assigning only one subcellular localization to proteins may neglect other functions for proteins with multiple action sites. Therefore, P2SL provides its users the possibilities of subcel-lular localizations in addition to prediction. P2SL system will be updated through periodical training with the addition of new exper-imental data. This will provide P2SL users to keep up with the new emerging information with respect to subcellular localization.
In this study, we demonstrated that implicit motif distribu-tion approach gave a simple but yet successful soludistribu-tion to the problem of subcellular localization using a large protein dataset. Our approach may be used as a computational kernel for vari-ous other biological problems that require specific motif extraction and search. In addition, modular decision using SVM classifiers inherently provide decision possibilities for each classification incid-ent. Computational methods defining classification possibilities may provide new insights to unexplained activities of proteins or may support to attribute new activities to proteins along with in vivo experiments.
ACKNOWLEDGEMENTS
We would like to thank M. Ozturk (Bilkent University, Turkey) for his critical discussions on this paper and M. Ozarar for the initial tech-nical assistance. This work was supported by the Turkish Academy of Sciences to R.C.A. (RCA/TUBA-GEBIP/2001-2-3), and R.C.A. partial funding was also provided by TUBITAK (Turkey).
REFERENCES
Ahuatzi,D., Herrero,P., de la Cera,T. and Moreno,F. (2004) The glucose-regulated nuc-lear localization of hexokinase2 in Saccharomyces cerevisiae is Mig1-dependent.
J. Biol. Chem., 279, 14440–14446.
Attwood,T.K. and Beck,M.E. (1994) PRINTS—a protein motif fingerprint database.
Protein Eng., 7, 841–848.
Bailey,T.L. and Elkan,C. (1994) Fitting a mixture model by expectation maximiza-tion to discover motifs in biopolymers. In Proceedings of the Second Internamaximiza-tional
Conference on Intelligent Systems for Molecular Biology, Stanford, CA, USA,
pp. 28–36.
Bailey,T.L. and Gribskov,M. (1998) Combining evidence using P -values: application to sequence homology searches. Bioinformatics, 14, 48–54.
Baldi,P. and Brunak,S. (2001) Bioinformatics: The Machine Learning Approach, 2nd ed. MIT Press, Cambridge, MA.
Bateman,A., Coin,L., Durbin,R., Finn,R.D., Hollich,V., Griffiths-Jones,S., Khanna,A., Marshall,M., Moxon,S., Sonnhammer,E.L.L. et al. (2004) The Pfam protein families database. Nucleic Acids Res., 32 (Database issue), 138–141.
Blekas,K. Fotiadis,D.I. and Likas,A. (2003) Greedy mixture learning for multiple motif discovery in biological sequences. Bioinformatics, 22, 607–617.
Boser,B., Guyon,I. and Vapnik,V. (1992) A training algorithm for optimal margin clas-sifiers. In Proceedings of the Fifth Annual Workshop on Computational Learning
Theory 1, Pittsburg, PA, pp. 144–152.
Bucher,P. and Bairoch,A. (1994) A generalized profile syntax for biomolecular sequences motifs and its function in automatic sequence interpretation. In
Pro-ceedings of the 2nd International Conference on Intelligent Systems for Molecular Biology, Stanford, CA, pp. 53–61.
Burchett,S.A. (2003) In through the out door: nuclear localization of the regulators of G protein signaling. J. Neurochem., 87, 551–559.
Burges,C.J.C. (1998) A tutorial on support vector machines for pattern recognition. Data
Mining Knowl. Discov., 2, 121–167.
Cristianini,N. and Shawe-Taylor,J. (2000) An Introduction to Support Vector Machines. Cambridge University Press, New York, NY.
Cyert,M.S. (2001) Regulation of nuclear localization during signaling. J. Biol. Chem., 15, 20805–20808.
Demir,E., Babur,O., Dogrusoz,U., Gursoy,A., Nisanci,G., Cetin-Atalay,R. and Ozturk,M. (2002) PATIKA: an integrated visual environment for collaborative construction and analysis of cellular pathways. Bioinformatics, 18, 996–1003. Dierendonck,J.H., Bahar,I., Atilgan,A.R., Jernigan,R.L. and Erman,B. (1997)
Under-standing the recognition of protein structural classes by amino acid composition.
Proteins, 29, 172–185.
Eisenberg,D., Marcotte,E.M., Xenarios,I. and Yeates,T.O. (2000) Protein function in the post-genomic era. Nature, 405, 823–826.
Emanuelsson,O. (2002) Predicting protein subcellular localisation from amino acid sequence information. Brief Bioinform., 3, 361–376.
Emanuelsson,O., Nielsen,H., Brunak,S. and von Heijne,G. (2000) Predicting subcellular localization of proteins based on their N-terminal amino acid sequence. J. Mol. Biol., 300, 1005–1016.
Fabbro,M. and Henderson,B.R. (2003) Regulation of tumor suppressors by nuclear-cytoplasmic shuttling. Exp. Cell Res., 282, 59–69.
Gardy,J.L., Spencer,C., Wang,K., Ester,M., Tusnady,G.E., Simon,I., Hua,S., deFays,K., Lambert,C., Nakai,K. and Brinkman,F.S.L. (2003) PSORT-B, improving protein sub-cellular localization prediction for Gram-negative bacteria. Nucleic Acids Res., 31, 3613–3617.
Henderson,B.R. and Fagotto,F. (2002) The ins and outs of APC and beta-catenin nuclear transport. EMBO Rep., 3, 834–839.
Henikoff,S. and Henikoff,J.G. (1991) Automated assembly of protein blocks for database searching. Nucleic Acids Res., 19, 6565–6572.
Hoetelmans,R., van Slooten,H.J., Keijzer,R., Erkeland,S. and van de Velde,C.J. (2000) Bcl-2 and Bax proteins are present in interphase nuclei of mammalian cells. Cell
Death Differ., 7, 384–392.
Hsu,C.W. and Lin,C.J. (2002) A comparison on methods for multi-class support vector machines. IEEE Trans. Neural Netw., 13, 415–425.
Jain,A.K., Duin,R.P.W. and Mao,J. (2000) Statistical pattern recognition: a review. IEEE
Trans. Pattern Anal. Mach. Intell., 22, 4–37.
Joachims,T. (1999) Making large-scale SVM learning practical. In Schoelkopf,B., Burges,C. and Smola,A. (eds), Advances in Kernel Methods—Support Vector
Learning. MIT Press, Cambridge, MA, pp. 169–184.
Kawashima,S., Ogata,H. and Kanehisa,M. (1999) AAindex: amino acid index database.
Nucleic Acids Res., 27, 368–369.
Kittler,J.V., Hatef,M., Duin, R.P.W. and Matas,J. (1998) On combining classifiers. IEEE
Trans. Pattern Anal. Mach. Intell., 3, 226–239.
Kohonen,T. (1997) Self-Organizing Maps. Springer-Verlag, New York, Inc., Secaucus, NJ.
Kohonen,T., Hynninen,J., Kangas,J. and Laaksonen,J. (1996) SOM_PAK: the self-organizing map program package. Technical Report A31, Helsinki Univer-sity of Technology, Laboratory of Computer and Information Science, Espoo, Finland.
Kostiainen,T. and Lampinen,J. (2002) On the generative probability density model in the self-organizing map. Neurocomputing, 48, 217–228.
Lam,L. and Suen,C.Y. (1994) A theoretical analysis of the application of majority voting to pattern recognition. Proc. Intell. Conf. Pattern Recogn., 1, 418–420.
Lu,Z., Szafron,D., Greiner,R., Lu,P., Wishart,D.S., Poulin,B., Anvik,J., Macdonell,C. and Eisner,R. (2004) Predicting subcellular localization of proteins using machine-learned classifiers. Bioinformatics, 20, 547–556.
Luttrell,S.P. (1994) A Bayesian analysis of self-organizing maps. Neural Comput., 6, 767–794.
Mjolsness,E. and DeCoste,D. (2001) Machine learning for science: state of the art and future prospects. Science, 293, 2051–2055.
Mohamed,E.M.M., Dick de,R., Robert,P.W.D. and Atalay,V. (2004) Almost autonomous training of mixtures of principal component analyzers. Pat. Rec. Lett., 25, 1085–1095. Mott,R., Schultz,J., Bork,P. and Ponting,C.P. (2002) Predicting protein cellular
localiz-ation using a domain projection method. Genome Res., 12, 1168–1174.
Nair,R. and Rost,B. (2003) LOC3D: annotate sub-cellular localization for protein structures. Nucleic Acids Res., 31, 3337–3340.
Nakai,K. (2000) Protein sorting signals and prediction of subcellular localization. Adv.
Protein Chem., 54, 277–344.
Noble,W.S. (2004) Support vector machine applications in computational biology. In Schoelkopf,B., Tsuda,K. and Vert,J.P. (eds), Kernel Methods in Computational
Biology. MIT Press, Cambridge, pp. 71–92.
Özer,Ö.F., Ozün,O., Tüzel,C.O., Atalay,V. and Cetin,A.E. (2001) Vision-based single-stroke character recognition for wearable computing. IEEE Intell. Syst., 16, 33–37. Schmalz,D., Hucho,F. and Buchner,K. (1998) Nuclear import of protein kinase C occurs
by a mechanism distinct from the mechanism used by proteins with a classical nuclear localization signal. J. Cell Sci., 111, 1823–1830.
Scholkopf,C., Burges,J.C. and Smola,A.J. (1999) Advances in Kernel Methods. MIT Press, Cambridge.
Scott,M.S., Thomas,D.Y. and Hallett,M.T. (2004) Predicting subcellular localization via protein motif co-occurrence. Genome Res., 14, 1957–1966.
Vapnik,V. (1998) Statistical Learning Theory. Wiley, New York.
Vesanto,J. and Alhoniemi,E. (2000) Clustering of the self-organizing map. IEEE Trans.
Neural Netw., 11, 586–600.
Wang,J., Delabie,J., Aasheim,H., Smeland,E. and Myklebost,O. (2002) Clustering of the SOM easily reveals distinct gene expression patterns: results of a reanalysis of lymphoma study. BMC Bioinformatics, 3, 36.