598
Identification
of
Target
Primitives with
Multiple
Decision-Making
Sonars
Using
Evidential
Reasoning
Birsel
Ayrulu
Billur Barshan
Department
of Electrical and ElectronicsEngineering
BilkentUniversity
Bilkent 06533 Ankara,
Turkey
Abstract
In this
study, physical
models are used to modelreflections from
targetprimitives commonly
encountered in a mobile robot’senvi-ronment. These targets are
differentiated
by employing
a multi-transducerpulse/echo
system that relies on bothtime-of-flight
data andamplitude
in thefeature-fusion
process,allowing
more robustdifferentiation. Target features
aregenerated
asbeing evidentially
tied todegrees of belief,
which aresubsequently
fused by
employ-ing
multiple logical
sonars atgeographically
distinct sites. Featuredatafrom multiple logical
sensorsarefused
withDempster’s
ruleof
combination toimprove
theperformance
of classification
by
reduc-ing perception uncertainty. Usreduc-ing
threesensing
nodes,improvement
in
differentiation
is between 10% and 35%withoutfalse decision,
atthe cost
of additional computation.
The method isverified by
exper-iments with a real sonar system. The evidential
approach
employed
herehelps
to overcome thevulnerability of
the echoamplitude
tonoise, and enables the
modeling of nonparametric uncertainty
in real time.1. Introduction
There is no
single
sensor thatperfectly
detects, locates,
and identifiestargets
under all circumstances.Although
somesensors are more accurate at
locating
andtracking objects,
they
may notprovide
identity
information,
or vice versa,pointing
to the need forcombining
data frommultiple
sensorsvia data-fusion
techniques.
Theprimary
aim of data fusion is to combine data frommultiple
sensors toperform
inferencesthat may not be
possible
from asingle
sensor. Data-fusionapplications
span a widedomain,
including
automatictarget
recognition,
mobile-robotnavigation,
target
tracking,
aircraftnavigation,
andteleoperations
(Steinberg
1987;
BlackmanThe International Journal of Robotics Research,
Vol. 17, No. 6, June 1998, pp. 598-623,
© 1998 Sage Publications, Inc.
and Broida
1990;
Hall1992;
Murphy
1993).
In roboticsapplications,
data fusion enablesintelligent
sensors to bein-corporated
into the overalloperation
of robots so thatthey
can interact with andoperate
in unstructuredenvironments,
without the
complete
control of a humanoperator
(Luo
andLin
1988).
Data fusion can be
accomplished by using geometrically,
geographically,
orphysically
different sensors at differentlevels of
representation,
such assignal-level, pixel-level,
feature-level,
andsymbol-level
fusion. In thisstudy,
phys-ically
identical sonar sensors areemployed
to combine in-formation whenthey
are located atgeographically
differ-entsensing
sites. Feature-level fusion is used toprovide
a
system
performing
anobject-recognition
task withaddi-tional features that can be used to increase its
recognition
capabilities.
One mode of
sensing
that ispotentially
useful and cost ef-fective for mobile-robotapplications
is sonar. Sinceacous-tic sensors are
light,
robust,
andinexpensive
devices,
they
arewidely
used inapplications
such asnavigation
ofau-tonomous vehicles
through
unstructured environments(Kuc
andSiegel
1987;
Kuc and Viard1991),
mapbuilding
(Crow-ley
1985;
Leonard andDurrant-Whyte
1991 ),
target
tracking
(Kuc 1993),
and obstacle avoidance(Borenstein
and Koren1988).
Although
there are difficulties in theinterpretation
ofsonar data
owing
tomultiple specular
reflections,
the poorangular
resolution of sonar, and the need to establishcor-respondence
betweenmultiple
echoes on different receivers(Peremans,
Audenaert,
andCampenhout
1993;
Kleeman andKuc
1995),
these difficulties can be overcomeby
employ-ing
accuratephysical
models for the reflection of sonar.Sensory
information from asingle
sonar has poorangu-lar resolution and is not sufficient to differentiate the most
commonly
encounteredtarget
primitives
(Barshan
and Kuc1990).
Therefore,
manyapplications
require
multiple
sonarconfigurations.
The mostpopular
sonarranging
system
is599
time
elapsed
between the transmission of apulse
and itsre-ception.
Since theamplitude
of sonarsignals
is prone toen-vironmental conditions and since the standard electronics for the
commonly
used Polaroid transducers(Polaroid 1990)
donot
provide
the echoamplitude directly,
most sonarsystems
exploit only
the TOF information. Differential TOF models ofplanes, edges,
comers, andcylinders
have been usedby
several researchers in
map-building,
robot-localization,
andtarget
tracking applications.
In Bozma(1992),
using
asin-gle
mobile sensor for mapbuilding, edges
are differentiatedfrom
planes
and corners from asingle
location. Planes and corners are differentiatedby
scanning
from twoseparate
lo-cations
using
TOF information fromcomplete
sonar scans ofthe
targets.
In Leonard(1990)
and Peremans et al.(1993),
similarapproaches
have beenproposed
toidentify
thesetar-gets
as beacons for mobile-robot localization.Manyika
hasapplied
differential TOF models totarget
tracking (Manyika
and
Durrant-Whyte
1994).
For
improved
target classification,
multitransducerpulse/echo
systems
thatrely
on both TOF andamplitude
information can beemployed.
In earlier workby
Barshan andKuc,
amethodology
based on TOF andamplitude
in-formation is introduced to differentiate
planes
and cornersusing
a statistical error model for thenoisy signals
(Barshan
and Kuc
1990).
Here,
this work is extended todevelop
algo-rithms that cover additional
target types
and fuse the decisionsof
multiple sensing
agents
using
evidentialreasoning.
Un-certain environmental dataacquired by multiple
sonars at dis-tinctgeographical
sites is used fortarget
recognition.
First,
the ultrasonic reflection process from
commonly
encounteredtarget
primitives
is modeled such that sonarpairs
becomeevi-dential logical
sensors.Logical
sensors, asopposed
tophysi-cal sensors that
simply acquire
realdata,
process real sensory data togenerate
perception
units that arecontext-dependent
interpretations
of the real data(Nazhbilek
and Erkmen1993).
By
processing
the realdata,
logical
sensorsclassify
thetar-get
primitives.
An automatedperception
system
for mobile robotsfusing
uncertain sensory information must be reliable in the sense that it ispredictable.
Therefore,
quantitative
approaches
touncertainty
are needed. These considerations favor measure-based methods forhandling
sensory data(both
physical
andlogical)
at different levels ofgranularity
relatedto the resolution of the
data,
as well as the time constantsof the different sensors. The
sensor-integration problem
canbe abstracted in a
conceptual
model whereuncertainty
aboutevidence and
knowledge
can be measured andsystematically
reduced. To overcome the
vulnerability
of echoamplitude
tonoise,
multiple
sonar sensors are used in thedecision-making
process. Decisions of these
sensing
agents
are thenintegrated
using Dempster’s
rule of combination.Section 2
explains
thesensing configuration
used in thisstudy,
and introduces thetarget
primitives.
A differentiationalgorithm
that isemployed
toidentify
thetarget
primitives
is alsoprovided
in the same section. In Section3,
thebelief-Fig.
1. Atypical
echo of the ultrasoundranging
system.
assignment
process isdescribed,
which is based on both TOFand
amplitude
characteristics of the data. Also included isa
description
of feature and location fusion whenmultiple
sonar-sensing
nodes are used. Consensus ofmultiple
sen-sors at different sites is achievedby using
Dempster’s
rule ofcombination,
and thesensitivity
to different levels ofampli-tude noise is
investigated.
Simulation results areprovided
inSection 4. In Section
5,
themethodology
is verifiedexperi-mentally by assigning
belief values to the TOF andamplitude
characteristics of thetarget
primitives,
based on real data. Furtherexperiments
are conducted in an unclutteredrectan-gular
room where feature and location fusion processes aredemonstrated
by employing
one to threesensing
nodes. In the lastsection,
concluding
remarks are made and directionsfor future research are motivated.
2. Sonar
Sensing
and
Target
Differentiation
Algorithm
In this
section,
basicprinciples
of sonarsensing
are reviewed. Thesensing configuration
and thetarget
primitives
that areused in this
study
are described. A differentiationalgorithm
is
developed
toidentify
and locate thetarget
primitives
from the measurements of asingle logical
sensor.2.1.
Physical Reflection
Modelsof
Sonarfrom Different
Target
PrimitivesThe most
popular
sonarranging
system
is the TOFsystem.
Inthis
system,
an echo isproduced
when the transmittedpulse
encounters an
object
and a range value r isproduced
whenthe echo
amplitude
waveform first exceeds apreset
threshold level T, as shown inFigure
1:Here,
to is the TOF of the echosignal
at which the echoFig.
2.Sensitivity region
of an ultrasonic transducerpair.
of sound in
air.
IAssuming
additive Gaussian-distributednoise,
T isusually
setequal
to 4 to 5 times the value of the noise standarddeviation,
which is estimated based onexperimental
data.In this
study,
the far-field model of apiston-type
transducerhaving
a circularaperture
is used(Zemanek 1971 ).
Theam-plitude
of the echo decreases with inclinationangle
B,
whichis the deviation
angle
of thetarget
from normalincidence,
asillustrated in
Figure
2. The echoamplitude
falls below thethreshold level when
181
>0.,
where0.
is the beamangle
thatdepends
on theaperture
size and the resonantfrequency
of the transducer as
Here,
a is the transduceraperture radius,
andf
is
theresonant
frequency
of the transducer(Zemanek 1971).
With a
single
transducer,
it is notpossible
to estimate the azimuth of atarget
with better resolution than theangular
resolution of sonar, which is
approximately
290.
In thepresent system,
two identical acoustic transducers a and bwith center-to-center
separation
d areemployed
toimprove
the
angular
resolution,
as illustrated inFigure
2. Eachtrans-ducer can
operate
both as transmitter and receiverby
con-struction. The
typical shape
of thesensitivity region
of anultrasonic transducer
pair
is shown inFigure
2. The extentof this
region
is ingeneral
different for eachtarget type,
sincegeometrically
orphysically
differenttargets
exhibit different reflectionproperties.
The wordtarget
is used here to refer toany environmental feature that is
capable
ofbeing
observedby
a sonar sensor.In this
study,
thetarget
primitives
modeled areplane,
cor-ner, acute comer,
edge,
andcylinder,
whose horizontal crosssections are illustrated in
Figure
3. Thesetarget
primitives
constitute the basic
building
blocks for most of the surfaceslikely
to exist in an uncluttered robot environment. Since thewavelength
of sonar(À ~
8.6 mm at 40.0kHz)
is muchlarger
than thetypical roughness
ofobject
surfaces encountered inlaboratory
environments, targets
in these environmentsre-flect acoustic beams
specularly,
like a mirror(Morse
andIngard
1968).
Hence,
whilemodeling
the receivedsignals
from thesetargets,
all reflections are considered to bespecu-lar. This allows transducers both
transmitting
andreceiving
to be viewed as aseparate
transmitter T and virtual receiver R in all cases(Kuc
andSiegel
1987).
Detailed
physical
reflection models of thesetarget
primi-tives with
corresponding echo-signal
models areprovided
in theAppendix.
2.2.
Target
Differentiation Algorithm
In the differentiation of the
target
primitives
discussed in thissection,
both TOF andamplitude
characteristics are used.In
Figures
4 and5,
TOF characteristics of varioustarget
primitives
aregiven
over therange 9
E[-60°, 60°]
for awide-beam transducer. The TOF characteristics of
plane,
comer,
edge,
andcylinder
have almost the same form asil-lustrated in
Figure
4.However,
Figure
5 indicates that the TOF characteristics of the acute corner aresignificantly
dif-ferent than those of other
targets.
Lettab( 0)
denote the TOFreading
extracted atangle 9
fromAab(r,
0, d, t),
which is thesignal
transmittedby
a and receivedby
b,
modeled in theAp-pendix.
The difference in the TOF characteristics of the acutecomer is
exploited
by
thefollowing algorithm
to differentiatethe acute comer from the other
targets.
Acute corner
differentiation algorithm
then acute comer;
then
plane,
corner,edge,
orcylinder.
In this
algorithm,
0’ is the standard deviation of the TOFes-timate,
which is ingeneral nonlinearly
related to the additivenoise on the
signal amplitude.
Thisrelationship
isinves-tigated
in(Ayrulu
1996).
Amultiple
of ot,A;t<7t,
is used toimprove
the robustness of the differentiationalgorithm
tonoise
(Ayrulu
1996).
Note that if a new decision on the
target type
is to be made at each value of 9 asproposed
in thealgorithm,
an acutecomer and a corner cannot be differentiated over a ±1’ °
in-terval around 0 = 0° . This is because the
qualitative
TOF1. c =
331.4√T/273
m/s, where T is absolute temperature in Kelvin. At room temperature (T = 293 K), c = 343.3 m/s.601
Fig.
3.Target
primitives
modeled and differentiated in thisstudy.
Fig.
4. The TOF characteristics oftargets
when thetarget
is at r = 2 m:(a)
plane;
(b)
corner;(c)
edge
with0,
=90’;
and(d)
cylinder
with rc = 20 cm.characteristics of a comer are the same as that of an acute
corner in this
interval,
as illustrated inFigures
4b and 5.However,
aftermistakenly identifying
a comer as an acute corner, thewedge
angle
of the acute comer will becomputed
as 90° in this smallinterval,
as verifiedexperimentally
inSection 5.
Hence,
if the differentiationalgorithm initially
detects an acute comer but calculates thewedge angle
tobe around
90°,
the final decision will be a corner. For 6values outside the interval
[-20°, 20°],
an acute corner of0c
= 60° cannot be differentiated from the othertarget
prim-itives,
since its TOF characteristics resemble those of othertarget
primitives
for these 0 values.Similarly,
acute comersof
0c
= 45° and0c
= 30° cannot be differentiated when 0is outside the intervals
[-45°, 45°]
and[-55°, 55°],
respec-tively.
Therefore,
acute corners ofwedge angle
less than 60°can be
reliably
differentiated from the rest of thetarget
prim-itives when 0 E
[-20°, 20°]. If 0,
>60°,
the differentiationis not
reliable,
since the TOF characteristics are very similarto those of other
targets.
The azimuth 0 and
angle
0,
of the acute corner can be estimated asFig.
5. TOF characteristics of acute corner at r = 2 m with(a) 0c
=30° (b) 0,
=45°
(c) 0.
=60°
and(d) 0,
= 90°.where the
geometry
for raa and r66 areprovided
in theAp-pendix.
For () = 00,
To estimate the range r
for 0 #
0°,
a second-orderpoly-nomial
equation
must be solved:The coefficients of this
polynomial
are:For the identification of the rest of the
targets,
amplitude
characteristics of the return
signals, given
inFigure
6,
mustbe
used,
since their TOF characteristics have the same form.Based on the
amplitude
characteristics,
thefollowing
algo-rithm is used to differentiate theplanar
target
from the restof the
target
primitives.
Plane
differentiation algorithm
then
plane
withthen corner,
edge,
orcylinder.
Here,
Aaa(0), Aab(O),
andA66(B), respectively,
denote the maximum values ofAaa(r, 0, d,
t),
Aab(r,
0, d, t),
and603
Fig.
6.Amplitude
characteristics at r = 2 m when thetarget
is a(a)
plane;
(b)
corner;(c) edge
with6e
=90° ;
(d)
cylinder
Abb(r,
0, d,
t)
over time atangle
0. Functional forms of the latter areprovided
in theAppendix.
The ra and rb are theper-pendicular
distances of therespective
transducers from thetarget,
whosegeometries
are also included in theAppendix.
To differentiate a comertarget
from anedge
orcylinder,
amplitude
characteristics over therange 9
E[ - 0., 0. j
arestudied. The
distinguishing
feature is that the maxima ofAaa(8), Aab(B), A6b(B)
over 0 E[-90, 80]
areequal
for aright-angle
corner, whereas this is not so for theedge
and thecylinder,
as shown inFigure
6.Hence,
the differentiationalgorithm
follows.Comer
differentiation algorithm
. If
[max{Aaa(8)} -
max{Abb(8)}
<kAoA]
and[max{Abb(8)} -
max(Aab(0))
<kAO&dquo;A]
then comer with
else
edge
orcylinder.
In the above
algorithm,
max{Aaa(9)}
corresponds
to the maximumamplitude
over 0 for 9 E[ - 00 , 80],
With thegiven
number of measurements, it is notpossible
to determine the orientation of the twoplanes forming
the corner.Only
theorientation of the line where the two
planes
intersect can befound with
respect
to the line ofsight.
To find the orientationof the
planes,
measurements that include reflections from thetwo constituent
planes
are necessary.In the above
algorithms,
noisemultiplicity
factorskA
andkt
provide
robustness for the differentiation process.Simu-lation results for
integer
values ofkA and kt
between 0 and 6 areprovided
inAyrulu (1996),
which indicate that for thedesired level of
robustness,
it isappropriate
to set theseequal
to one. In situations where a
greater
level of robustness isdesired,
larger
values may beemployed.
Referring
toFigure
6,
edge
andcylinder
targets
can bedistinguished
over a small interval near 0 = 0’. At 0 =0°,
Aaa(0)
=Aab(0)
=Abb(0)
for anedge,
but thisequality
is not true for a
cylinder. Depending
on the radius of thecylinder,
it may bepossible
to differentiateedge
andcylinder
with this
configuration
of transducers. Anedge
is atarget
with zero radius of curvature. For an
edge, expressions
forrange r and azimuth 0
given
in eqs.(12)
and(13)
are the same as in the case of a corner. In the case of acylinder,
in addition to range and
azimuth,
the radius of thecylinder
can be estimated. The radius of curvature has two limits of interest: As re ~
0,
the characteristics of thecylinder
approach
those of anedge.
On the otherhand,
as y-e -> oo, the characteristics are more similar to those of aplane.
By
assuming
thetarget
is acylinder
first andestimating
itsradius of curvature
(Barshan 1996),
it may bepossible
todistinguish
these twotargets
forrelatively large
values of r,.Approximate expressions
for ther, 0
and re estimates aregiven by
The ratio of transducer
separation
to theoperating
range(d/r)
is animportant
parameter
in the differentiation oftarget
primitives, directly affecting
how well thesetarget
primitives
can be differentiated
by
their TOF andamplitude
character-istics. The furtherapart
are thetransducers,
thelarger
arethe differentials in TOF and
amplitude
aslong
as thetarget
remains within the
sensitivity
patterns
of bothtransducers,
asin
Figure
7a. If this is not the case, as inFigure
7b,
some or allfour of the
signals
may not be detected. In thelimit d
-> 0,
whichcorresponds
to either the transducersbeing
too closetogether
and/or thetarget
being
toofar,
the two transducers behave as asingle
transducer and the differentialsignals
arenot reliable. This situation is
equivalent
to the case oftry-ing
to differentiate thetargets
using
asingle
transducer at afixed
location,
which is not feasible(Barshan
and Kuc1990;
Bozma
1992).
A detailedstudy
on the effect of transducerseparation
d and range r on the maximum differentials isprovided
inAyrulu
(1996).
3.
Feature
and Position Fusion
by Multiple
Logical
Sensors
This section focuses on the
development
of alogical sensing
module that
produces
evidential information from uncertainand
partial
information obtainedby multiple
sonars atgeo-graphically
distinctsensing
sites. The formation of such evi-dential information isaccomplished
withreasoning
based onbelief functions. Belief values are
generated by
eachlogical
sensor andassigned
to the detected features. These features and their evidential metric obtained frommultiple
sonars arethen fused
using
Dempster’s
rule of combination.A belief function is a
mapping
from a class of sets to the interval[0,1 that
assigns
numericaldegrees
ofsupport
basedon evidence
(Shafer 1976).
This is ageneralization of
proba-bilistic
approaches,
since one is allowed to modelignorance
about a
given
situation. Unlikeprobability theory,
a belieffunction
brings
a metric to the intuitive idea that aportion
of605
Fig.
7. Aplanar
target
falls(a)
within the intersection of thesensitivity
patterns
of both transducers and(b)
outside the intersection of thesensitivity
patterns
so thatcross-signals
are not detected.committed to its
complement.
In thetarget
classificationproblem, ignorance corresponds
to nothaving
anyinforma-tion on the
type
oftarget
that the transducerpair
isscanning.
Dempster-Shafer
theory
differs from theBayesian approach
by allowing
support
for more than oneproposition
at atime,
allowing
lack of data(ignorance)
to berepresented.
With thisapproach,
fulldescription
of conditional(or
prior)
probabili-ties are no
longer required,
and incremental evidence can beeasily incorporated.
Several researchers haverecently
startedusing
evidentialreasoning
inapplications
such aslandmark-based
navigation (Murphy
1996)
and mapbuilding
(Pagac,
Nebot,
andDurrant-Whyte
1996).
To differentiate the
target
primitives,
differences in the reflection characteristics of thesetargets
areexploited
andformulated in terms of basic
probability
masses. Thislogical
sensor model of sonarperception
is novel in the sense that itmodels the uncertainties associated with the
target type,
its range, and itsazimuth,
as detectedby
each sensorpair.
Theuncertainty
in the measurements of each sensor node isrep-resented
by
a belief functionhaving
target type
(or
feature)
and
target
location rand 0 as focalelements,
with basicprob-ability
massesm(.)
associated with them:3.1. Feature Fusion
from Multiple
SonarsThe focus of this section is feature
fusion;
fusion oftarget-location estimates will be handled in the next section.
Logical
sensing
of thetarget
primitives
isaccomplished through
ametric as
degrees
of beliefassigned
to thetarget
primitives,
according
to the TOF andamplitude
characteristics of the receivedsignals
described in Section 2.According
to the method used in thisstudy,
a new decision on thetarget type
is made on-line at each discrete value of9,
based on thedifferentiation
algorithm.
Sincecomplete amplitude
sonarscans that cover the whole range of 0 E
[-00,00]
must beinterpreted
to differentiateedge
andcylinder
from corner, it ispossible
to differentiateonly plane,
corner, and acute cornerwith on-line data
processing.
However,
oncecomplete
TOFand
amplitude
characteristics are obtained for all values of0,
all fivetargets
can be differentiated. Based on TOF andamplitude
characteristics of the receivedsignals
fromplane,
comer, and acute corner, basic
probability assignment
to each feature is made as follows:where
Aab(0)
denotes the maximum value ofAab(r, 9,
d,
t)
(the
signal
transmittedby
a and receivedby
b),
andtab(0)
de-notes TOF extracted from
Aab(r,
9,
d, t)
at inclinationangle
0by thresholding.
The definitions ofAaa(8), Abb(O), taa(9),
andtbb(0)
are similar.1,, I2, 13,
and14
are the indicators ofThe
remaining
belief isassigned
to an unknowntarget type,
representing ignorance
or undistributedprobability
mass, asDempster’s
fusion ruleapplies
whereindependent opinion
sources are to be combined
(Shafer
1976).
This is the casein the
present
application.
Given two sources with belieffunctions
and
consensus is obtained as the
orthogonal
sumwhich is both associative and
commutative,
with theresulting
operation being
shown in Table 1. Thesequential
combina-tion of
multiple
bodies of evidence can be obtained for nsensor
pairs
asUsing Dempster’s
rule ofcombination,
where
L
Lhk=f.n9,=o
~t(A)~2(~)
is a measure ofcon-flict.
’ ’
The consensus belief function
representing
thefeature-fusion process has the metrics
Disagreement
in the consensus of twological
sensing
units isrepresented
by
the &dquo;conflict&dquo; term above. The conflictmeasure is
expressed
asAfter
discounting
thisconflict,
the beliefs can be rescaled and used in further data-fusion processes, such as in these-quential
combination ofmultiple
bodies of evidence(Murphy
1996).
3.2. Fusion
of Range
andAzimuth
EstimatesAssignment
of belief to range andangle
measurements isbased on the
simple
observation that the closer thetarget
isto the face of the
transducer,
the more accurate is the rangereading,
and the closer thetarget
is to the line ofsight
of thetransducer,
the more accurate is theangle
estimate(Barshan
1991 ).
This is due to thephysical properties
of sonar:signal
amplitude
decreases with r andwith
181.
Atlarge
ranges andlarger
angular
deviations,
thesignal-to-noise
ratio is smaller. The most accurate measurements are obtainedalong
the lineof
sight
(9
=0°)
and atnearby
ranges to the sensor
pair.
Therefore,
beliefassignments
to range and azimuth estimates derived from the TOF measurements are made as follows:Note
that,
belief of r takes its maximum value of one whenr = r~.~,zn and its minimum value of zero when r = rmax- ·
Similarly,
belief of 9 is one when 0 = 0° and zero when8 =
tB°.
Since each sensor
pair
takes measurements in its ownsensor-centric coordinate
frame,
the beliefs of range andaz-imuth information need to be first
projected
onto a commoncoordinate
system
wherethey
can beintegrated.
This is rep-resented inFigure
8,
where erroneous estimates are assumedfor r and 9. Then the metric of the fusion process is
computed
based on theseprojected
values. Due to the noise on thesys-tem, estimated range and azimuth values are different than
the true values.
Suppose n
transducerpairs
areemployed
and each
pair
estimates the range and azimuth of thetarget
as
607
Table 1.
Target
Differentiationby Dempster’s
Rule of CombinationFig.
8. Common coordinatesystem
for npairs
of sonar sensors.Fig.
9.Projected
range and azimuth for transducerpair
i.in each sensor’s own coordinate
frame,
while thetarget
iswithin its
sensitivity
region.
Theprojected
range and azimuthare
represented
inFigure
9 asAlthough typically logarithmic relationships
are used tore-late
uncertainty
and belief(Pearl 1988),
here asimpler
linearrelationship
is chosen to facilitate theanalysis:
where p
corresponds
to either the range or azimuth of thetarget.
Since the range and azimuth estimates are transformed
onto a common coordinate
frame,
uncertainties in theesti-mated range and azimuth must be
represented
as uncertaintiesin the transformed range and azimuth with the transformation
below:
where (7~ and
ug
represent
uncertainties in the range and azimuth measurements,respectively,
and4>i
is theangle
be-tween
f,
andr’’.
Since theposition
of theith
transducerpair,
rs, , isknown,
4>~
can be found from thegeometry
by
using
the cosine theorem:
where rs, is the distance of the
ith
sensorpair
from theori-gin.
Afterprojecting
the range and azimuth estimates ontoa common coordinate
system,
they
are fused into asingle
range and a
single
azimuth estimate as follows:where the new belief value in the common coordinate
system
can be foundby solving
eq.(41 )
form(p).
Beliefs to these combined range and azimuth estimates
Fig.
10. Position of aplane
withrespect
to each sensorpair.
is noiseless and the location of the
target
in the commoncoordinate
system
is(r,
0),
all estimated range and azimuthvalues are
equal
to their true values:Then the
projected
and fused range and azimuth estimatesare all
equal:
For the
planar
target
case, which is illustrated inFigure
10,
fusion of range and azimuth estimates needs to bemodified,
because each sensor
pair
detects theplane
at a differentposi-tion. For this case, a line that
represents
theplane
in 2-D canbe estimated
using
the estimatedpositions
of theplane by
all sensorpairs
in the common coordinate frame. Then theperpendicular
distance between this line and theorigin,
and the orientation of this line withrespect
to theorigin
must be found whichyield
the fused range and azimuth of thisplane.
In
2-D,
aplanar
target
can berepresented
as a line with theequation
If range and azimuth measurements from n sensors are
avail-able,
aweighted least-squares
solution(Bar-Shalom 1990)
issought
for a and b where theweights
anduncertainty
arein-versely
related. Theweighted least-squares
solution can befound
by minimizing
thefollowing expression:
Here,
and the
weights
that minimize the mean-square error can befound as
(Barshan
and Kuc1990)
where ()&dquo; x. and oy. are found
by transforming
the uncertaintiesin
r’ and 0§
asNote that here there is no need to normalize the sum of the
weights
to one. Theweighted least-squares
solution isand the fused range and azimuth estimates are
4.
Simulation
Results
4.1. Feature Fusion
for
Plane-CornerIdentc; fication
In the simulationstudies,
it is assumed that adecision-making
unit
consisting
of apair
of sonars withseparation
d = 24.0 cmis
available,
mounted on astepper
motor withstep
size 0.9°.Signals
are simulatedaccording
to the modelspresented
in theAppendix
for the Panasonictransducer,
which has a resonantfrequency
of10
= 40 kHz and0.
= 54°.Temporally
andspatially
uncorrelated zero-mean additive Gaussian noise of standard deviation <y~ is added to the echosignals.
At eachstep
of the motor, apulse
istransmitted,
and four TOF andfour
amplitude
measurements are recorded. The unit scans an uncluttered area which is a 1.4 m x 1.0 mrectangular
roomfor 0
E[-180°,180°]
in
order to detect corners andplanar
walls.
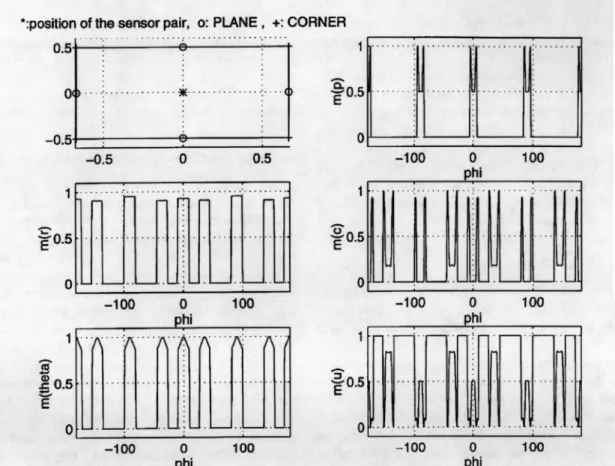
The results of the belief
assignment
process for asingle
transducer
pair
located at the center of the room aregiven
in
Figure
11. In thisfigure,
m(1n)
clearly
indicates that theplane
feature isrecognized
withhigh
beliefs atright angles
around
0°, ::1::900,
::I:: 1800,
and withhighest
beliefs in range than comer, sinceplanes
lie at closerproximity
to the sensor609
Fig.
11. Beliefassignment
with information from asingle
transducerpair.
than corners. For
larger
inclinationangles,
these fourplanes
are confused with corners, because the tails of the
amplitude
characteristics of a
plane
and corner are similar. The beliefm(c)
shows that the four corners of the room are identifiedwith
highest
belief values around :f:45° and :f: 1350. The be-liefchop
in the middle of each corner belief curve reflects apin-type
rise inuncertainty
at these locations. This is dueto the
amplitude
characteristics of the corner. At +E, medegrees
to the left or to theright
of thisline,
higher
beliefsare
generated
in therecognition
of a corner. In theangular
interval between the identification of
plane
and that of comer,there exists a
region
ofhigh uncertainty
inm(u)
due to nore-turn
signal being
available. In this case,neglecting
multiple
reflections of third and
higher
orders,
all transmittedwave-forms bounce off the room
boundaries,
and no returnsignal
is recorded.
Thus,
m(r)
=m(6)
= 0.Further simulation studies were
performed
with threeiden-tical
logical
sensors located at differentpositions
in the 1.4 mx 1.0 mrectangular
room. The decisions of the threepairs
are combined so as toperform
the feature fusionby
employing Dempster’s
rule of combination. The locations of these transducerpairs
are(0.0, 0.0), (-0.1, 0.1 ),
and(0.1, 0.1 )
in meters, where the
origin
is taken as the center of the room.All transducer
pairs
are assumed to rotate onstepper
mo-tors with
step
size 0.9’. These units scan the room for0
E[-180°,180°].
At eachstep,
transducerpairs
collect data from thetarget
at the samestep
angle
0,
and the decisionsof all
pairs
at thisangle
are fused. To calculateprobabilities
of correct
classification, misclassification,
and lack oftarget
identification,
data is collectedfor 0
E[-180°, 180°] three
times,
whichcorresponds
to about1,200
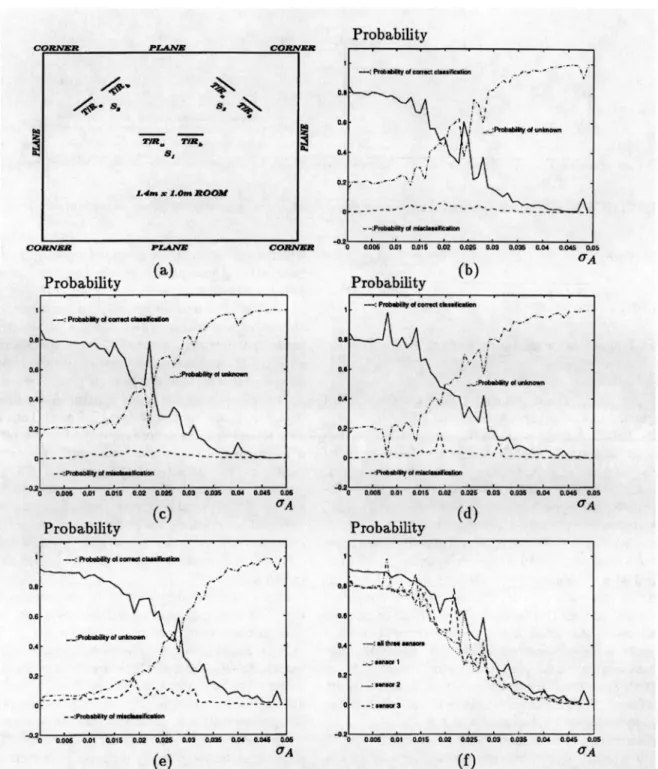
decisions.The classification results for each transducer
pair
and the data fusionusing
three transducerpairs
aregiven
inFigure
12. For a maximumecho-amplitude
value of0.3,
amplitude
noisestandard deviation of 0.02
corresponds
to 50% of themax-imum
signal-amplitude
differences. Foru A >
0.03,
differ-entialsignal
levels arecomparable
to the noiselevel,
and it becomesimpossible
to detect these differences. InFig-ure
12b-12d,
theprobability
of misclassification with onepair
is almost zero for all the noise standard deviationvalues,
owing
to the inclusion of a A in the classificationalgorithms.
The
probability
of correct classification with the fusion of threepairs
can be seen inFigure
12e. Theimprovement
inthe
probability
of correct classification is shown inFigure
12f.Here,
theprobability
of correct classification is derived from the consensus of threelogical
sonars,illustrating
how fusionprovides
an increase in evidentialsupport
that raises theprob-ability
of correct classification whencompared
to that of asingle
transducerpair.
Theimprovement
is between 10% and 35% for a A <0.03,
becoming
smaller forlarger
values ofa A. Of course, this is at the increased cost of time to collect
more data and do the necessary
computations
to fuse the data from threepairs
of sensors.When O’A is excluded from the differentiation
algorithm
by
replacing
it with zero, thealgorithm
becomes less robustand the
probability
of misclassificationincreases,
as shownin
Figure
13. In this case, whenu A >
0.02,
theperformance
of the classification is
comparable
to theperformance
of arandomized decision rule
(Berger
1988),
where 50% of the time thetarget
israndomly
guessed
to be aplane,
and 50% of the time it isguessed
to be a comer,by completely ignoring
the information carriedby
the data.4.2. Acute Corner Simulations
Acute comers are less
frequently
encountered incomparison
to the other
target
primitives.
Oneexample
wherethey
com-monly
occur is in orchestra shells for auditoriums and operahouses.
In the acute-comer
simulations,
the samesensing
configu-ration as in the
previous
subsection is used. An acute cornerwith
wedge angle
0c
isplaced
in front of the sensorpair
at r = 2 m, as shown in
Figure
14. Each time apulse
istransmitted,
four TOF and fouramplitude
measurements arecollected. The
stepper
motor isrotated,
and thetarget
isscanned for 9 from -60° to 60’. While
obtaining
classifi-cation results for eachangular
step,
the unit scans thetarget
from 0 = -60° to 9 =
60°,
eight
times. As aresult,
thelog-ical
sensing
unit makes about1,072
decisions for eachpair
of at and a A values.For the
region
in which an acute comer can bereli-ably
differentiated with the classificationalgorithm
(9
E[-20°, 20°]),
the results of beliefassignments
by
alogi-cal sensor unit for different values of
0c
areobtained,
andthe result for
0c
= 60° isprovided
inFigure
15 as anexam-ple. According
to theresults,
for allOr
values,
the maximum belief ofbeing
an acute corner is obtained at 0 = 0° whenthe
system
is noiseless.Moreover,
the belief ofbeing
aplane
or a comer is zero for all0,
9~,
and a A values. The values of a A used in thisstudy
are 0.002 and 0.003.Although
thedecrease in the belief of acute corner with
increasing
101
issharper
forlarger
9~,
the belief of acute corner isgreater
thanthe belief of unknown
target
for all 0 and QA values. Belief values are between 0.8 and 1.0 forOr
=30°,
between 0.7and 1.0 for
0c
=45°,
and between 0.6 and 1.0 forOc
= 60’.The range,
azimuth,
and0c
are estimated for acute comerswith
0c
=30°, 45°,
and 60° at r = 2 m, for different a Avalues. The results for a A = 0.002 are
provided
inFigure
16. For a A =0.002,
the maximum range error is 5.7 cm, andthe maximum error in azimuth is
1.8°,
which occurs with theacute corner of
0c
=30°,
and the maximum error in0c
is1.4°,
occurring
for the acute comer of0,
= 60°.The classification results for these acute corners are
il-lustrated in
Figure
17. In thisfigure,
theprobability
ofcorrect classification is
higher
than both theprobability
ofmisclassification and the
probability
of unknowntarget
up to ut = 160 J.Lsec for0c
=30°,
ut = 100psec for
Be
=45°,
and ut = 40 ilsec for
0,
= 60’. Theprobability
ofmisclas-sification is
always
less than both theprobability
of correctclassification and the
probability
of unknowntarget.
5.
Experimental
Verification
In this
study,
anexperimental
setup
isemployed
toassign
belief values to the
experimentally
obtained TOF andam-plitude
characteristics of thetarget
primitives,
and to testthe
proposed
fusion method fortarget
classification. Datawas collected at Bilkent
University
Robotics andSensing
Research
Laboratory.
Three sensor nodes areplaced
in asmall, uncluttered,
rectangular
room withspecularly
reflect-ing
surfaces. Panasonic transducers areused,
which have much wider beam width than thecommonly
used Polaroid transducers. Theaperture
radius of the Panasonic transducer is a = 0.65 cm, and its resonantfrequency
is10
= 40kHz;
therefore
00 E#
54° for these transducers(Panasonic 1989).
Since Panasonic transducers are manufactured with distinctcharacteristics for
transmitting
andreceiving,
two transmit-ter/receiverpairs
with very small verticalseparation,
asil-lustrated in
Figure
18,
are used as asingle logical
unit. Thehorizontal center-to-center
separation
between thetransduc-ers is d = 24.0 cm. This
sensing
unit is mounted on a small6-V
stepper
motor withstep
size 0.9’. Thestepping
action iscontrolled
through
theparallel
port
of an IBM-PC486,
withthe aid of a microswitch. The sensor data is
acquired using
aDAS-50 A/D card with four
channels,
12-bitresolution,
and 1 MHzsampling frequency.
The echosignals
areprocessed
on an IBM-PC 486using
a Clanguage
program. From thetime of
transmission, 10,000
samples
of each echosignal
arecollected and thresholded. The
amplitude
information isex-tracted
by finding
the maximum value of thesignal
after thethreshold value is exceeded. The
targets
employed
in thisstudy
are:cylinders
with radii1.5, 2.5, 5.0,
and 7.5 cm; aplanar
target;
a comer; and an acute corner ofOc
= 60° .All of the
experiments
are conducted onlarge
sheets ofmillimetric paper to allow accurate calibration. In the
exper-iments,
eachtarget’s
surface distance r to the center of the transducersystem
is varied between 20 cm to 140 cm at 10cm intervals. At each
position,
thetarget
is scanned while it isstationary
at 0 = 0° . Thetypical
differential TOF betweenthe transducers varies between 0 cm and 14 cm,
depending
on the
target type,
curvature, and distance for the fixedsep-aration of d = 24.0 cm
(Ayrulu
1996).
As therange of the
target increases,
the differentialsignal
becomes less reliable fortarget
classification.Belief-assignment
results to the TOF andamplitude
char-acteristics of aplane
at r = 50 cm when scanned with thesensing
unit aregiven
inFigure
19. In thisfigure,
belief ofbeing
aplanar
target
primitive
isgreater
than zero for611
Fig.
12.(a)
The simulated room;(b)
classification results: sensor at(0.0, 0.0); (c)
sensor at(-0.1, 0.1); (d)
sensor at(0.1,
0.1 ); (e)
all three sensors;(f)
improvement
in theprobability
of correct classification.Fig.
13. Classification with asingle
transducerpair
without the (j A term in the classificationalgorithm.
Fig.
14. Position of the transducerpair
and the acute comer.0 E
[-20°, 20°].
Belief ofbeing
aplane
and the belief ofbeing
an unknowntarget
oscillate around 0.5 for101
<10°,
and the belief of
being
an unknowntarget
isgreater
thanthe belief of a
plane
outside thisregion.
Moreover,
belief ofbeing
a corner or an acute corner is zero for all 0 values.Estimated range and azimuth values are
given
inFigure
20.Referring
to thisfigure,
maximum range error is 0.5 cm andmaximum error in the azimuth estimate is 0.7°.
Beliefs are
assigned
to the TOF andamplitude
character-istics of a corner at r = 80 cm, as shown in
Figure
21 when scanned with thesensing
unit.Although
thetarget
is acor-ner, for the interval 0 E
[-5°, 2°],
highest
belief isassigned
to the acute comer. This is due to the
similarity
of the TOF characteristics(for
small
9 ~ )
of corners and acute comerswith
large
8e,
asexplained
in Section 2.2. Belief of cornerbecomes
larger
than belief of acute corner for101
>5°,
asexpected.
Since the TOF characteristics aresignificantly
dif-ferent for
101
>5°,
the correct decision is reached. Belief ofplane
is zero for all 0 valuesexcept
at 0 = -9°.Estimated range and azimuth values are
given
inFigure
22.Referring
to thisfigure,
maximum range error is 0.3 cm,and the maximum error in azimuth is 3.6° in the
region
0 E
[-4°, 4°].
InFigure
22c,
estimatedwedge angle
of the acute corner is shown.Although
the belief for an acutecorner is around one for
101
< 5°,
estimatedwedge angle
isaround 90° in this
region.
Therefore,
the final decision is acomer, as discussed in Section 2.2.
Beliefs
assigned
to the TOF andamplitude
characteristics of an acute cornerof 8
= 60° at r = 40 cm, which is scannedwith the same
system,
aregiven
inFigure
23. In thisfigure,
belief ofbeing
an acute corner isalways
greater
than the beliefof
being
an unknowntarget,
and belief ofbeing
aplane
or a comer isalways
zero. Estimated range,azimuth,
andwedge
angle
of acute comer aregiven
inFigure
24.Referring
to thisfigure,
maximum range error is 2.0 cm, maximum azimutherror is
3.0°,
and maximum error in estimatedangle
of theacute comer is 4.2’ for 9 c
[-6°, 6°].
The fusion method is tested
experimentally
in anunclut-tered
rectangular
roommeasuring
1.4 m x 1.0 m withspecu-larly reflecting
surface,
createdby partitioning
off a sectionof a
laboratory.
The test area is scannedby
three sensor unitslocated at
(0.0, 0.0), (-0.1, 0.1),
and(0.1, 0.1)
in meters,which are same as the
positions employed
in the simulationstudies. The
physical
limitations of the hardwareprevent
thesensors from
covering
the entireangular
range0.
Instead,
rotation is over the
range 0
E[0°, 284°].
As anexample,
therange
readings
of the sensor located at(-0.1, 0.1)
aregiven
in
Figure
25.Feature beliefs are
assigned by
the sensors based onthe TOF and
amplitude
characteristics of the sonarsig-nals reflected from comers and
planar
walls. The basicprobability assignments by
individual sensors are shown inFigure
26a-26c. Note thehigh degree
ofuncertainty,
sincea
single logical
sensor isemployed.
Each of the sensorde-cisions on
target type
is referred to the centralposition
forcomparison
and fusion.During
a scan, a sensor estimates therange and
angle
of thetarget
under observation. The valuesfor a
target
areweighted by
the beliefsassigned
to the esti-mates, and then referred toposition
(0.0, 0.0).
The sensors’determinations of beliefs are fused
using Dempster’s
rule ofcombination. Fusion results are shown in
Figure
26d.Us-ing
asingle sensing
node,
thepercentage
of correct decisions is about 30%. Theremaining
70% is attributed to incorrectdecisions due to noise and