i
CERIA PROMOTED NOX STORAGE AND REDUCTION MATERIALS
A THESIS
SUBMITTED TO THE DEPARTMENT OF CHEMISTRY AND
THE GRADUATE SCHOOL OF ENGINEERING AND SCIENCE
OF
BILKENT UNIVERSTIY
IN PARTIAL FULFILLMENT OF THE REQUIREMENTS
FOR THE DEGREE OF
MASTER OF SCIENCE
By
ZAFER SAY
AUGUST 2011
ii
To My Family
And
iii
ABSTRACT
CERIA PROMOTED NOX STORAGE AND REDUCTION MATERIALS
ZAFER SAY
M.S in Chemistry
Supervisor: Assistant Prof. Dr. Emrah ÖZENSOY
In the current work, the effect of CeO2 promotion on the NOx storage
materials and NOx storage-reduction (NSR) catalysts is studied. Synthesized
materials were prepared using different baria and ceria loadings in order to investigate the influence of the surface composition on the NOx storage process.
Synthesized materials were also thermally treated in the temperature range within 300 - 1273 K to mimic the thermal aging effects on the material structure. Structural properties of the synthesized materials were investigated via spectroscopic and diffraction techniques such as Raman spectroscopy, X-ray diffraction (XRD), and BET (Brunauer, Emmett, ve Teller) surface area analysis. These ex-situ characterization studies revealed that materials containing Pt showed indications of sintering after thermal treatment at elevated temperatures where Pt sites grew in size and were partially covered by BaO domains. Pt addition to the BaO/Al2O3 system
facilitated the formation of the undesired BaAl2O4 phase, particularly at high baria
loadings. Decomposition of the Ba(NO3)2 species took place at lower temperatures
for Pt containing materials. An indication for a strong-metal-support interaction (SMSI) between Pt and CeO2 sites was observed in Raman spectroscopic data,
resulting in the formation of a new mixed oxide phase on the surface. BET results indicated that the specific surface area (SSA) of the synthesized materials monotonically decreased with increasing temperature and increasing BaO and CeO2
iv
The behavior of the synthesized materials in NOx and SOx adsorption
experiments were also investigated via temperature programmed desorption (TPD) and in-situ Fourier transform infrared (FTIR) spectroscopy. Ceria promotion had no significant influence on the nature of the adsorbed nitrate species and the NOx uptake
ability of the alumina support material. On the other hand, addition of Pt to CeO2/Al2O3 binary and BaO/CeO2/Al2O3 ternary systems was observed to enhance
the NOx storage. For the ternary mixed oxide NOx storage systems
(BaO/CeO2/Al2O3), increasing BaO or CeO2 loadings results in a decrease in the
specific surface area values, which in turn leads to decreasing NOx uptake. SO2 (g) +
O2 (g) interaction with a selected set of samples were also investigated via in-situ
FTIR spectroscopy. These experiments reveal that ceria promotion and platinum addition assisted the formation of surface sulfate species. Furthermore, the presence of ceria also resulted in a decrease in the thermal stability of sulfates and enabled easier regeneration.
Keywords: NSR, NOx storage materials, -Al2O3, Ce/Al, Pt/Ce/Al, Ba/Ce/Al,
v
ÖZET
SERYUM DİOKSİT İLE ZENGİNLEŞTİRİLMİŞ NO
xDEPOLAMA VE İNDİRGEME KATALİZÖRLERİ
ZAFER SAY
Kimya Bölümü Yüksek Lisans Tezi
Tez Yöneticisi: Yard. Doç. Dr. Emrah Özensoy
Ağustos 2011
Bu çalışma kapsamında, seryum dioksitin NOx depolama ve indergeme
malzemeleri/katalizörleri üzerindeki etkisi incelenmektedir. Bu bağlamda, farklı miktarlarda Pt, CeO2 ve BaO ile zenginleştirilmiş γ-Al2O3 destek/alttaş malzemesi içeren
malzemeler sentezlenmiştir. Sentezlenen bu malzemelerinin yapısal
karakterizasyonu, BET (Brunauer, Emmett, ve Teller) yüzey alanı ölçümleri, X-ışını kırınımı (XRD), Raman spektroskopisi teknikleri yardımıyla yapılmıştır. Elde edilen yapısal çözümleme sonuçları ışığında, platin ve alumina destek malzemesinin yüksek sıcaklıklarda faz değişikliğine uğramadığı gözlemlenmiştir. Platin metalinin Ba/Al depolama malzemesine eklenmesiyle, NOx depolama kapasitesine olumsuz etkisi
olduğu bilinen BaAl2O4, fazının yüksek sıcaklıklarda oluştuğu saptanmıştır. NOx
alım kapasitesine olumsuz yönde etki eden BaAl2O4 fazı, artan barium oksit
miktarıyla doğru orantılı olarak artarken, sistemin CeO2 ile zenginleştirilmesi, bu
fazların oluşumunu önemli ölçüde azaltmaktadır. Sentezlenen malzemelere Pt eklenmesinin yapısal özellikler üzerindeki diğer bir etkisi ise, Pt birimlerinin CeO2
vi
ile girdiği kuvvetli etkileşimlerdir. Bu etkileşimler sonucu yüzeyde, Pt-O-CeO2
türlerinin oluşumu Raman spektroskopisi yardımıyla gösterilmiştir. BET tekniği ile yaptığımız yüzey alanı ölçümlerinde ise CeO2 ve BaO birimlerinin kütlece artan
miktarda kullanılması sonucunda yüzey alanını azalmaktadır.
Sentezlemiş olduğumuz malzemelerin NOx ve SOx türü gazlarla etkileşimleri
sıcaklık programlı yüzeyden buharlaştırma (TPD) ve Fourier Dönüşümlü Kızıl Ötesi Spektroskopisi (FTIR) teknikleri ile incelenmiştir. CeO2 eklenmesinin alumina
destek malzemesinin NOx depolama kapasitesi üzerinde etkisi oldukça sınırlıdır.
Fakat, Pt içeren Ce/Al ve Ba/Ce/Al türü destek malzemelerinin NOx alım
kapasiteleri, platin içermeyenlere nazaran daha yüksektir. Pt eklenmesinin diğer bir etkisi ise nitratların yüzeyden salınım sıcaklıklarıdır. Pt içeren malzemelerdeki nitrat salınımları, Pt içermeyenlere nazaran daha düşük sıcaklıklarda gerçekleşmektedir. Üçlü karışık oksit yapılarında (Ba/Ce/Al), BaO ve CeO2 birimlerinin miktarlarının
arttırlmasıyla, malzemelerin yüzey alanları azalmakta ve buna paralel olarak, NOx
depolama miktarları azalmaktadır. FTIR yöntemi kullanılarak sentezlenen bazı malzemelerin SO2 (g) + O2 (g) gaz karışımın ile etkileşimleri de incelenmiştir.
Edinilen spektroskopik veriler, alumina destek malzemesinin CeO2 ile
zenginleştirimesi sonucu yüzeyde oluşan sülfatların miktarındaki artışı göstermektedir. Yüzey sülfatlarındaki artış, Pt metalinin Ce/Al ikili oksit yapısına eklenmesiyle de devam etmektedir. CeO2 eklentisine dair diğer önemli sonuç ise
CeO2 içeren malzemeler üzerindeki sülfatların ısıl olarak daha az kararlı olmasıdır.
Anahtar Kelimeler: NSR, NOx depolama malzemeleri, -Al2O3, Ce/Al, Pt/Ce/Al,
Ba/Ce/Al, Ba/Pt/Ce/Al, SOx zehirlenmesi, XRD, Raman, BET, FTIR spektroskopisi,
vii
ACKNOWLEDGEMENT
I would like to express my gratitude to…
My supervisor, Assistant Prof. Dr. Emrah Özensoy for his guidance, encouragement, patience and supervision throughout my studies.
Evgeny Vovk for his contributions and scientific discussions.
My parents; Ayşe and Mehmeti my sister Ebru and my brother İbrahim for their continuous supports throughout during my education.
Special thanks to my uncle, Sami Say, for his memorable helps and supports.
Finally, I am sincerely thankful to Esra Nur for her love and everlasting supports in my life.
viii
TABLE OF CONTENTS
1 INTRODUCTION ………...1
1.1 Material Properties of Oxides ... 4
1.2 Literature Survey in NSR ... 6
2 EXPERIMENTAL……….11
2.1 Sample Preparation ... 11
2.1.1Pt/Al catalyst ... 11
2.1.2 Ba/1Pt/Al catalyst ... 11
2.1.3 Synthesis of CeO2/Al2O3 Support Materials ... 11
2.1.4 Synthesis of Pt/CeO2/Al2O3 ... 11
2.1.5 Synthesis of BaO/CeO2/Al2O3 ... 11
2.1.6 Synthesis of BaO/Pt/CeO2/Al2O3 ... 12
2.1.7 Synthesis of BaO/CeO2 ... 12
2.2 Experimental Techniques ... 13
2.2.1 FTIR: ... 13
2.2.1.1 Stepwise NO2 (g) adsorption experiments: ... 14
2.2.1.2 Temperature dependent FTIR experiments: ... 15
2.2.1.3 SO2 (g) + O2 (g) adsorption experiments: ... 15
2.2.1.3 NOx adsorption experiments on pre-poisoned samples: ... 15
2.2.2 BET ... 16
2.2.3 X-Ray Diffraction (XRD)... 16
2.2.4 Raman Spectroscopy ... 16
2.2.5 Temperature Programmed Desorption (TPD) ... 17
2.2.5.1 Thermal Stability of NOx species on Fresh Materials ... 17
3 RESULTS AND DISCUSSION………18
3.1 Structural Characterization... 18
ix
3.1.2 Raman Spectroscopy Experiments ... 23
3.1.3 BET ... 27
3.2 FTIR Spectroscopic Analysis of NOx Adsorption on Synthesized Materials ... 28
3.2.1 Stepwise NOx adsorption on pure γ-Alumina and CeO2 ... 28
3.2.2 Ce/Al Binary System ... 30
3.2.2.1 Stepwise NOx adsorption on Ce/Al binary system ... 30
3.2.2.2 Effect of Pt on the NOx uptake properties of Ce/Al binary system ... 31
3.2.2.3 Effect of Pt on the Thermal Stability of Adsorbed NOx on the Ce/Al Binary System ... 34
3.2.3 Ba/Ce/Al Ternary System ... 37
3.2.3.1 Stepwise NOx Adsorption on the Ba/Ce/Al Ternary System ... 37
3.2.3.2 Influence of Pt on the NOx Uptake Properties of the Ce/Ba/Al Ternary System ... 41
3.2.3.3 Thermal Behavior of NOx Species on the Ba/Ce/Al Ternary System .... 43
3.3 FTIR Spectroscopic Analysis of SOx Uptake of the Synthesized Materials ... 48
3.4 Quantitative SOx Uptake Determination via XPS ... 54
4 CONCLUSION………...55
5 REFERENCES………..56
x
LIST OF FIGURES
Figure 1: Fuel consumption and three-way performance of gasoline engines [3]. ... 1 Figure 2: Illustration of the general operational principle of NSR catalyst ... 3 Figure 3: Fluorite structure of CeO2 [9] ... 4
Figure 4: Simplified schematic of the custom-designed insitu-FTIR catalytic analysis system coupled to the quadrupole mass spectrometer chamber. Abbreviations used in the scheme are given in the inset. [89] ... 14 Figure 5: X-ray diffraction patterns of 1Pt/Al after annealing at various temperatures. ... 19 Figure 6: Ex-situ XRD patterns of (a) 8Ba/Al, (b) 8Ba/1Pt/Al, (c) 20Ba/1Pt/Al after annealing at 323 K – 1273 K... 19 Figure 7: Ex-situ XRD patterns of (a) 8Ba/1Pt/Al, (b) 8Ba/1Pt /10Ce /Al and (c) 8Ba/1Pt/20Ce /Al samples at temperatures between (323 K - 1273 K). ... 21 Figure 8: Ex-situ XRD patterns of (a) 20Ba/1Pt/Al, (b) 20Ba/1Pt/10Ce/Al and(c) 20Ba/1Pt//20Ce/Al samples at temperatures between (323 K - 1273 K). ... 21 Figure 9: Ex-situ Raman spectra for the (a) 20Ce/Al and (b) 1Pt/20Ce/Al samples that were annealed in Ar(g) at the given temperatures within 323 K – 1273 K. ... 24 Figure 10: Ex-situ Raman spectra for the (a) 8Ba/10Ce/Al and (b) 8Ba/20Ce/Al samples that were annealed in Ar(g) at the given temperatures within 323 K – 1273 K. ... 25 Figure 11: Ex-situ Raman spectra for the (a) 8Ba/1Pt/10Ce/Al and (b)
8Ba/1Pt/20Ce/Al samples that were annealed in Ar(g) at the given temperatures within 323 K – 1273 K. ... 26 Figure 12: SSA values of the synthesized materials ... 27 Figure 13: FTIR spectra of stepwise NO2(g) adsorption on a) γ-Alumina and b) ceria
at 323 K. ... 28 Figure 14: FTIR spectra of stepwise NO2(g) adsorption on (a) 10Ce/Al and (b)
20Ce/Al at 323 K. ... 30 Figure 15: FTIR spectra of stepwise NO2(g) adsorption on (a) Pt/10Ce/Al and
xi
Figure 16: A comparative analysis of the FTIR spectra corresponding to stepwise NO2(g) adsorption on Ce/Al and Pt/Ce/Al systems at 323 K, revealing the influence
of Pt. ... 32 Figure 17: TPD profiles obtained after NO2 saturation at 323 K of (a) 10Ce/Al, (b)
20Ce/Al, (c) 1Pt/10Ce/Al, (d) 1Pt/20Ce/Al. ... 34 Figure 18: Temperature dependent FTIR spectra for NO2(g) saturated (a) 10Ce/Al,
(b)1Pt/10Ce/Al samples between 323 K – 673 K. ... 36 Figure 19: FTIR spectra corresponding to stepwise NO2(g) adsorption on a
8Ba/10Ce/Al surface at 323 K. ... 38 Figure 20: FTIR spectra corresponding to stepwise NO2(g) adsorption at 323 K on
(a) 8Ba/10Ce/Al, (b) 8Ba/20Ce/Al, (c) 20Ba/10Ce/Al, (d)20Ba/20Ce/Al. ... 40 Figure 21: FTIR spectra of stepwise NO2(g) adsorption on a) 8Ba/1Pt10Ce/Al b)
8Ba/1Pt//20Ce/Al c) 20Ba/1Pt//10Ce/Al d) 20Ba/1Pt/20Ce/Al at 323 K. ... 41 Figure 22: FTIR spectra obtained after NO2(g) saturation on Pt-free Ba/Ce/Al (black
line) and Pt-containing Pt/Ba/Ce/Al (red line) samples at 323 K. ... 42 Figure 23: FTIR spectra of stepwise heating on a) 8Ba/10Ce/Al b) 8Ba/20Ce/Al in temperature range between 323 K-723 K. ... 45 Figure 24: FTIR spectra of stepwise heating on a) 20Ba/10Ce/Al b) 20Ba/20Ce/Al in temperature range between 323 K-723 K. ... 45 Figure 25: TPD profiles obtained after saturating on a) 8Ba/10Ce/Al b)20Ba/10Ce/Al c) 20Ba/20Ce/Al d) 8Ba/1Pt/10Ce/Al e) 20Ba/1Pt/10Ce/Al f) 20Ba/1Pt/20Ce/Al ... 47 Figure 26: FTIR spectra for SO2 (g) + O2 (g) (SO2:O2, 0.1:1) co-adsorption on γ-
Al2O3 and CeO2. (a) After 10 min exposure to SO2 (g) + O2 (g) at 323 K (spectrum
was obtained in the presence of the gas mixture), after flashing the sample to (b) 473 K, (c) 673 K in SO2 + O2 and cooling to 323 K (spectrum was obtained in the
presence of the gas mixture), (d) after SO2 (g) + O2 (g) mixture evacuated (Preactor
~1×10⁻³ Torr) , after flashing the sample to (e) 473 K, (f) 673 K, (g) 873 K and (h) 1073 K in vacuum (Preactor < 1×10⁻³ Torr) and cooling to 323 K. ... 48
Figure 27: FTIR spectra for SO2 (g) + O2 (g) (SO2:O2, 0.1:1) co-adsorption on γ-
Al2O3, 20Ce/Al and 1Pt/20Ce/Al. a) After 10 min exposure to SO2 (g) + O2 (g) at
323 K (spectrum was obtained in the presence of the gas mixture), b) after flashing the sample to b) 473 K c) 673 K in SO2 + O2 and cooling to 323 K (spectrum was
obtained in the presence of the gas mixture), d) after SO2 (g) + O2 (g) mixture
evacuated (Preactor ~1×10⁻³ Torr) , after flashing the sample to e) 473K f) 673K g)
xii
Figure 28: FTIR spectra for SO2 (g) + O2 (g) (SO2:O2, 0.1:1) co-adsorption on 8BaAl
and 8BaCeO2 a) After 10 min exposure to SO2 (g) + O2 (g) at 323 K (spectrum was
obtained in the presence of the gas mixture), b) after flashing the sample to b) 473 K c) 673 K in SO2 + O2 and cooling to 323 K (spectrum was obtained in the presence
of the gas mixture), d) after SO2 (g) + O2 (g) mixture evacuated (Preactor ~1×10⁻³
Torr) , after flashing the sample to e) 473K f) 673K g) 873K and h)1073K in
vacuum (Preactor < 1×10⁻³ Torr) and cooling to 323 K. ... 51
Şekil 29: FTIR spectra for SO2 (g) + O2 (g) (SO2:O2, 0.1:1) co-adsorption on 8BaAl
and 8BaCeO2 a) After 10 min exposure to SO2 (g) + O2 (g) at 323 K (spectrum was
obtained in the presence of the gas mixture), b) after flashing the sample to b) 473 K c) 673 K in SO2 + O2 and cooling to 323 K (spectrum was obtained in the presence
of the gas mixture), d) after SO2 (g) + O2 (g) mixture evacuated (Preactor ~1×10⁻³
Torr) , after flashing the sample to e) 473K f) 673K g) 873K and h)1073K in
vacuum (Preactor < 1×10⁻³ Torr) and cooling to 323 K. ... 53
Figure 30: Histogram showing the relative sulfur percentage in the poisoned
xiii
LIST OF TABLES
Table 1: Sample compositions of the synthesized materials and the abbreviations used for each sample………12
1
1 INTRODUCTION:
Air pollution is one of the most challenging problems of the industrialized world. Thus, the legislations regarding the emissions of pollutants such as unburned hydrocarbons, CO2, NOx and SOx are becoming constantly stricter every year [1].
The NOx emitted from the mobile sources have serious destructive effects on the
atmosphere, global ecosystem and especially on the human health. About one half of the total NOx emissions results from mobile sources [2].
Due to the rigorous environmental regulations, automotive industry is forced to search for new promising technologies to lower the exhaust emissions. Three-way catalysts (TWC) were used for the reduction of toxic gases in conventional gasoline engines which operate under air to fuel ratios (A/F) equal to 14.5 as shown in Figure 1. For a better fuel economy and a more efficient combustion, diesel and lean burn gasoline engines have been considered as attractive alternatives which operate at A/F = 24. However, under such oxidizing (i.e. lean) conditions, hydrocarbons, NOx
cannot be efficiently reduced via a TWC system.
2
For lean burn engines, a promising after treatment method for the catalytic
NOx reduction from mobile sources is the NOx storage/reduction (NSR) catalyst
technology which was innovated by Toyota Motor Corporation [4,5]. NSR catalysts consist of three main components. These are the NOx storage component based on
alkaline and alkaline earth oxides (e.g. K, Ba, Sr), precious metal (e.g. Pt, Pd, Rh) which is responsible for the oxidation and reduction, and the high surface area support material (e.g. γ-Al2O3) [6].
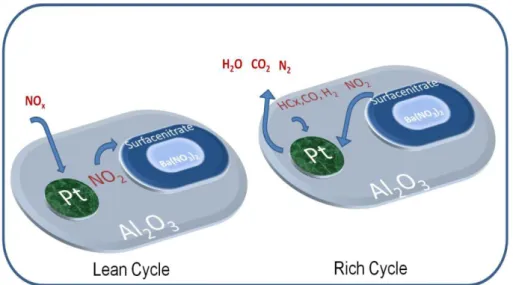
NSR catalysts, which are also called Lean-NOx Traps (LNT), operate under
lean and rich conditions as shown in Figure 2. NO is the dominant NOx species after
combustion in the lean-burn engine. During the lean period (60-120 s), oxygen abundant period, NO is oxidized to NO2 and this catalyst acts as lean NOx trap
material storing NOx as barium nitrates which is followed by short (5-15 s) rich
period where most of the trapped NOx is released and reduced to O2 and N2 by the
help of unburned reducing hydrocarbons. After the completion of the rich period, resultant catalyst is regenerated and adsorption sites are mostly available for the next lean period. A commonly accepted view of the operation of the NSR catalysts is given below [3]:
3
4
1.1 Material Properties of Oxides
Cerium oxide, CeO2, has the fluorite (i.e. CaF2)structure as shown in Figure
3. In the face centered cubic (FCC) structure of ceria, Ce4+ ions form a cubic close
packed arrangement and all of the tetrahedral sites are occupied by the oxide ions whereas the octahedral sites remain vacant. In the literature, ceria is known to form oxygen deficient, non-stoichiometric CeO2-x, at elevated temperatures [7,8]. Readily
available lattice oxygen in the ceria structure has been exploited in catalytic reactions involving oxidation steps. The fluorite structure of ceria is retained up to 900 K under a reducing atmosphere. Above this temperature, ceria lattice starts to expand due to the reduction of Ce+4 to Ce+3 (due to the relatively larger ionic radius of Ce+3). In the ceria structure, Ce and O atoms have coordination numbers of 8 and 4, respectively.
Figure 3: Fluorite structure of CeO2 [9]
The main role of ceria and ceria based materials in TWC is to expand the operational A/F window and help maintaining the conversion efficiency of the catalyst. Ceria has the ability to store excess oxygen under the lean period and
5
release it under the rich conditions, which is used in the oxidation of CO and hydrocarbons in the downstream. This happens due to its ability to switch between Ce4+ and Ce3+ oxidation states depending on the oxygen partial pressure in the exhaust gas composition. Ceria can undergo a number of reactions by exchanging oxygen with gas molecules in the exhaust environment.
Under lean conditions: Ce 2O3 + 0.5 O2 ⇋ 2CeO2 Ce 2O3 + NO ⇋ 2CeO2 + 0.5 N2 Ce 2O3 + H2O ⇋ 2CeO2 + H2
Under rich conditions: 2CeO
2 + H2 → Ce2O3 + H2O
2CeO
2 + CO → Ce2O3 + CO2
γ-Al2O3 is the most commonly used oxide support in NSR formulations due
to its porous structure with fine particle size, high surface area, high catalytic surface activity, distinctive chemical, mechanical and thermal properties [10-12]. γ-Al2O3
has a defective spinel structure (space group Fd3m), where the aluminum cations are located in the octahedral (Oh) and tetrahedral (Td) interstitial sites identified by the
face-centered-cubic (fcc) oxygen anion sublattice. At elevated temperatures γ-Al2O3
can go through polymorphic phase transitions to form other crystal structures which are commonly called as the transitional aluminas and eventually forms the thermodynamically stable α-Al2O3 (corundum) phase. This process is accompanied
by a catastrophic loss of porosity via sintering. Another important part of the NSR system is the BaO component which crystallizes in a NaCl (rock salt) structure. The coordination number of both ions in the BaO lattice is 6.
6
1.2 Literature Survey in NSR
CeO2 which is an important component of TWCs has been used as either a
promoter [20] or a support material [21] in the NSR catalysts. Recent studies have shown that ceria can sacrifice itself to store some of the sulfur in the exhaust that leads to a greater number of barium sites available for NOx storage [22-24]. The
common use of ceria in the three way catalyst (TWC) is based on its oxygen storage capacity. Since the lattice oxygen atoms in ceria are quite mobile, it buffers the exhaust gas composition around the stoichiometric point (A/F =14.5) during the lean-rich cycle [25-28]. Ceria also enhances the precious metal dispersion [29,30] and is known as a promoter material for the water-gas shift (WGS) and steam reforming reactions [31-33] in the exhaust environment.
Although several studies employing FT-IR spectroscopy have been published in the literature, these studies mainly focused on Pt/BaO/Al2O3 type catalysts
[34-45]. Ceria was found to improve NOx storage capacity at low to moderate
temperatures [21]. Philipp et al. [46] worked on NO and NO/O2 co-adsorption on
pure CeO2 via DRIFT spectroscopy. While the NO adsorption leads to nitrite
formation, due to co-adsorption of NO + O2 mainly nitrates are formed. Later,
Philipp et al. reported an extended study of NOx adsorption on BaO/CeO2 [47] and
CeO2 support was found to present a promising activity in reducing nitrates which is
attributed to oxygen vacancies in the ceria lattice [48]. Cerium oxide has been also used as a promoter for the elimination of toxic exhaust gases in automobiles, composed mainly by platinum group metals supported on CeO2/Al2O3[49,50].
Some of the possible routes of nitrite and nitrate formation on alumina surface due to NOx adsorption are presented below[51]:
3NO2 (g) + O2- (surface) 2NO3-(ads) + NO (g)
2NO2 (g) + O2- (surface) NO3-(ads) + NO2- (ads)
Mechanism of reduction of stored nitrate species by the reductants such as CO and H2 during rich period is the following [52,53]:
7
Ba(NO3)2 + 5CO N2 + BaO + 5CO2
Ba(NO3)2 + 5H2 N2 + BaO + 5H2O
The decomposition of Ba nitrites and nitrates may occur according to following stoichiometry:
Ba(NO2)2 2NO + 1/2 O2 + BaO
Ba(NO2)2 2NO + BaO2
Ba(NO3)2 2NO + 3/2 O2 + BaO
Ba(NO3)2 2NO + O2 + BaO2
FTIR investigations also demonstrated that NOx storage in BaO/Al2O3 was enhanced
in the presence of Pt. It was argued that Pt sites provided atomic oxygen to Ba and Al sites which catalyzed the formation of Ba- and Al- nitrates from nitrite species [54]:
Ba(NO2)2 + 2 O-Pt Ba(NO3)2
NO adsorption experiments for Pt-BaO/Al2O3 showed that NO decomposed on Pt
and NO was also oxidized to NO2 via oxygen adatoms by the following possible
reactions [55]: NO + Pt Pt-NO
Pt-NO + Pt Pt-N + Pt-O Pt-NO + Pt-O NO2 + 2Pt
It was also proposed in the literature that during the NO exposure, Pt sites could lose their activity for NO decomposition due to the accumulation of atomic oxygen on the Pt sites. However, BaO sites that are in close proximity of the Pt particles was suggested to facilitate the spillover of the oxygen adatoms from Pt to BaO making Pt sites free of NO [55]. This spillover phenomenon may also lead to the formation of BaO2 species as follows:
8
Some of the major drawbacks of NSR catalysts are the sulfur poisoning and thermal aging that may lead to the formation of BaAl2O4 and BaCeO3, as well as the
growth of Pt particles [56,57].The formation of these undesired side processes leads to a decrease in NOx storage capacity [58,59]. The origin of the sulfur species in the
NSR system is the sulfur that is present in the fuel and engine lubricants. Even though sulfur contamination in the fuel is significantly reduced over the years, complete removal of sulfur has not been achieved. During the combustion of fuel, sulfur present in the fuel is converted into SO2 and oxidized to SO3 through the lean
period via precious metals, such as Pt, Pd, Rh, etc. BaSO4 formation is much slower
than the Ba(NO3)2 formation [60]. However, the storage component (i.e. BaO) has a
greater affinity towards SO3 resulting in the formation of BaSO4 which is
thermodynamically more stable than Ba(NO3)2 [61]. Therefore, NSR catalysts are
poisoned due to the loss of the available adsorption sites. Sulfur poisoning typically leads to the formation of alkaline earth metal and precious metal sulfate or sulfite complexes.
Studies on the deactivation of NOx storage catalysts due to sulfur have also
shown that (i) the deactivation rate increases with increased sulfur exposure [62]; (ii) compounds such as H2S and COS deactivate the NOx storage capacity in a way that
is similar to the way in which SO2 does [63,64]; (iii) between 250 and 450 °C the
exposure to SO2 decreases the catalytic activity for NO oxidation during the lean
cycle and the NOx reduction capacity of the precious metal during the rich cycle due
to sulfur accumulation on the precious metal sites [65]; (iv) sulfur deactivation occurs much quicker under rich conditions than the lean conditions [66]; (v) exposure to SO2 or SO2 + O2 results in the formation of BaSO4 by a gradual removal
of BaCO3 [63,67]; (vi) small BaSO4 particles are more easily decomposed than the
large BaSO4 particles [68]; and (vii) the decomposition of BaSO4 requires a
high-temperature regeneration treatment [69], but the presence of water decreases the decomposition temperature of BaSO4.
The study of oxidative SO2 adsorption on pure Al2O3 and pure CeO2 support
co-9
workers extended their focus on SO2 adsorption by investigating solid mixture of
CeO2-Al2O3 by IR spectroscopy and compared that of pure alumina and ceria with
previous studies [73-75]. Ji et al. [76] showed the effect of ceria addition on the sulfur resistance of NSR systems via DRIFT spectroscopy. Recently, a high surface area Pt/BaO/CeO2 catalyst was prepared, showing higher sulfur tolerance than the
Al2O3 based one [24].
In TWCs, noble metals such as Pt, Pd, Rh play an important role in the nature of sulfate species formed. Bazin et al [77] reported that sulfation on ceria is independent of the presence of Pt. However, previous works have shown that Pt favors the sulfate formation and reduction by H2 on alumina [78-80]. Luo et al. [81]
described the adsorption and reaction of SO2 by using Pd rather than Pt. Similar
results were reported by Yu and Shaw [82] who indicated increased sulfate formation on Pd/Al2O3 with respect to pure alumina. For ceria promoted alumina and pure
ceria, addition of Pd lowers the amount of adsorbed sulfate species [83,84]. Mowery and McCormick [85] suggested that SO2 adsorbed on PdO spillovers from the active
palladium phase to the support leading to PdO sites to stay fresh longer with a relatively limited deactivation. Kylhammar et al. [86] studied adsorption of sulfur dioxide for CeO2 and Pt/ CeO2 samples at two different temperatures, 250 °C and
400 °C. It was shown that the rate of the formation of bulk sulfate for Pt/ CeO2 is
faster at 400 °C rather than 250 °C.
Abdulhamid et al. [87] published an extended article on SO2 interaction with
NSR catalyst and investigate different sulfate species on different samples such as, Al2O3, Pt/Al2O3, BaCO3/Al2O3 and Pt/BaCO3/Al2O3. The influence of the noble
metal on sulfite formation was also investigated in this former study and sulfite formation was found to be enhanced with Pt addition. Su et al. [88] performed very similar SO2 adsorption experiments on Al2O3, Pt/Al2O3 and Pt/BaO/Al2O3.
Difference between two studies is the amount of SO2 exposure. Su has used 1000
ppm SO2 which was an order of magnitude larger than what Abdulhamid used.
Especially for the Pt/Al2O3 catalyst, there is no evidence for sulfite species at higher
10
Despite the numerous studies directed to investigations on the interactions of exhaust gases with different oxide surfaces so far, unfortunately many of the results are contradictory and specific spectroscopic details of the effect of CeO2 on the
storage behavior of the Al2O3, Ba/Al2O3 and Pt/Ba/Al2O3 system remain unclear in
the open literature. Consequently, in the current study, the interactions of exhaust gases with different ceria promoted NOx storage materials and NSR catalysts have been investigated.
11
2 EXPERIMENTAL
:
2.1 Sample Preparation
2.1.1Pt/Al catalyst
Alumina was impregnated with Pt(NH3)2(NO2)2 solution. The sample was dried at
353K overnight, calcined in air at 873 K for 2 hours. 2.1.2 Ba/1Pt/Al catalyst
Alumina was impregnated with Pt(NH3)2(NO2)2 solution. Next, the sample was dried
at 353 K overnight, calcined in air at 873 K for 2 hours. Then sample was impregnated with Ba(NO3)2.
2.1.3 Synthesis of CeO2/Al2O3 Support Materials
Binary oxide CeO2/Al2O3 materials were synthesized by incipient wetness
impregnation of γ-Al2O3 (PURALOX, 200 m2/g, SASOL GmbH, Germany). Support
material was impregnated with aqueous solutions of Ce(NO3)3.6H2O (Fluka,
Cerium(III) nitrate Hexahydrate, France) with different ceria ( 10 and 20 wt % CeO2
) loadings. During the impregnation of the ceria precursor, mixture was constantly stirred and then dried for 8 hours at 353 K. After the removal of water, Ce/Al support material was thermally treated under Ar(g) flow within 323 K-1273 K.
2.1.4 Synthesis of Pt/CeO2/Al2O3
The binary oxide CeO2/Al2O3 is impregnated with a solution of
Pt(NH3)2(NO2)2 (Aldrich, Diamminedinitritoplatinum(II), 3.4 wt.% solution in dilute
NH3). Mixture was stirred and then dried for 8 hours at 353 K. After the removal of
water, Ce/Al support material is thermally treated under Ar(g) flow within 323 K-1273 K.
2.1.5 Synthesis of BaO/CeO2/Al2O3
Different set of NOx storage materials in the form of BaO/CeO2/Al2O3 ternary
oxides with different BaO (8 and 20 wt % BaO) and Ce (10 and 20 wt % CeO2 )
12
oxide material was impregnated by aqueous solutions of barium nitrate (ACS Reagent, ≥ 99 %, Riedel-de Häen, Germany). Synthesized materials were also thermally treated within 323 K and 1273 K in Ar(g) flow. Structural properties of each of the synthesized materials was investigated with ex-situ characterization techniques including Raman spectroscopy, X-ray diffraction (XRD), and BET specific surface area analysis.
2.1.6 Synthesis of BaO/Pt/CeO2/Al2O3
Pt/CeO2/Al2O3 system was impregnated with a solution of Pt(NH3)2(NO2)2
(Aldrich, Diamminedinitritoplatinum(II), 3.4 wt.% solution in dilute NH3). System
was stirred and then dried for 8 hours at 353 K. Next, the synthesized materials were thermally treated within 323 K and 1273 K in Ar(g) flow.
2.1.7 Synthesis of BaO/CeO2
CeO2 (Inframad, nanopowder) support material was impregnated with a
Ba(NO3)2 aqueous solution. Then, material was heated to 873 K for 2 hours under
Ar(g) flow.
Synthesized materials with different loadings are listed in Table 1;
Sample %Ceria %Baria %Pt %Alumina
10Ce/Al 10 - - 90 20Ce/Al 20 - - 80 1Pt/10Ce/Al 10 - 1 90 1Pt/20Ce/Al 20 1 80 8Ba/1Pt/Al - 8 1 92 20Ba/1Pt/Al - 20 1 80 8Ba/10Ce/Al 10 8 - 92 8Ba/1Pt/10Ce/Al 10 8 1 92 20Ba/1Pt/10Ce/Al 10 20 1 80 8Ba/1Pt/20Ce/Al 20 8 1 92
Table 1: Sample compositions of the synthesized materials and the abbreviations used for each sample.
13
2.2 Experimental Techniques
2.2.1 FTIR:
IR spectroscopic measurements were carried in transmission mode in a batch-type spectroscopic reactor. FTIR spectrometer (Bruker Tensor 27) and catalytic reactor is combined with a quadruple mass spectrometer (QMS) (Stanford Research Systems, RGA 200) for temperature programmed reduction (TPD) and residual gas analyzer (RGA) experiments. FTIR data are recorded via Hg-Cd-Te (MCT) detector which operates with liquid nitrogen (LN2) cooling. Each spectrum was obtained by
averaging 128 scans with a 4cm-1 spectral resolution. Powder samples were pressed onto a high conductance and lithographically-etched tungsten grid (P/N PW10379-003). W-grid is attached to copper holder legs assembled to a ceramic vacuum feedthrough. In order to monitor the temperature, a K-type thermocouple which was spot-welded onto a tantalum foil was attached on the W-grid. Sample temperature was controlled between 300 K - 1173 K by an adjustable dc power supply and computer controlled PID electronics. About 20 mg of finely grounded sample was pressed onto the W-grid before the FTIR analysis. After having mounted the sample inside the batch reactor, it was outgassed at 373K for at least 12 hours in order to remove the water from sample surface while simultaneously baking the chamber walls. Prior to each adsorption experiment, samples were activated by flushing the reactor with 10 Torr of O2 followed by evacuation and subsequent heating at 773 K
(with a heating rate of 12 K min-1. This procedure allowed us to obtain sample surfaces that were free of adsorbates/contaminants, sample was flashed to 773 K. Background IR spectrum of the clean and adsorbate free-sample was taken at 323K in vacuum before the acquisition of the sample spectra.
14
Figure 4: Simplified schematic of the custom-designed insitu-FTIR catalytic analysis system coupled to the quadrupole mass spectrometer chamber. Abbreviations used in the scheme are given in the inset. [89]
2.2.1.1 Stepwise NO
2(g) adsorption experiments:
NO2(g) was dosed onto an activated fresh sample. During the NO2(g)
exposure, gas pressure was controlled by a MKS Baratron absolute pressure transducer. In each dosing step, sample was exposed to 0.1 Torr of NO2(g) for 1 min
at 323 K. After the exposure and before taking the sample IR spectrum, gas phase inside the chamber was evacuated with rotary and turbo pumps until ~10-3 Torr is reached inside the reactor, before the next NO2(g) dose. After multiple doses, a final
saturation exposure was performed at 323 K where the sample was exposed to 8.0 Torr NO2(g) for 10 min. All spectra were obtained at 323 K.
15
2.2.1.2 Temperature dependent FTIR experiments:
After the saturation of the freshly prepared samples with NO2(g) (using a 8.0
Torr NO2(g) exposure for 10 min at 323 K), thermal stability of the adsorbed species
has been investigated. For the removal of the adsorbed species from the sample surfaces, temperature was linearly ramped to a certain value within 323 - 773 K. Then, the sample was cooled to 323 K and the FTIR spectrum was acquired in vacuum. This procedure was repeated with 50 K increments between 323 K - 773 K for the thermal stability analysis via FTIR.
2.2.1.3 SO
2(g) + O
2(g) adsorption experiments:
SO2 (g)+O2 (g) mixture was prepared with a SO2/O2 pressure ratio of 1/10.
Before the adsorption experiments, material surface was activated by heating to 773 K in 10 Torr oxygen atmosphere followed by evacuation at 323 K. Then the background spectrum was obtained at 323 K in vacuum. First, the sample spectrum was acquired at 323 K after 10 min SO2 (g)+O2 (g) (PTotal =1.0 Torr) exposure. Next,
the sample was heated at various temperatures (T ≤ 673 K) in the presence of the gas mixture. After each heating step, sample was cooled to 323 K in the presence of the gas mixture for the FTIR data acquisition. Next, IR cell was evacuated at 323 K until a system pressure of 10-3 Torr was reached. This is followed by a similar data collection procedure where the sample was heated to various temperatures in vacuum and after each heating step, the sample was cooled to 323 K for IR data acquisition.
2.2.1.3 NO
xadsorption experiments on pre-poisoned samples:
In these set of experiments, the samples were activated by dosing 2.0 Torr of NO2 over the sample for 10 min and then heated at 973 K to remove the NOx on the
material surface and eliminate other contaminants (such as carbonaceous species, water or pump oil inside the reactor). Poisoning of the materials were achieved by introducing 2.0 Torr SO2 + O2 (SO2:O2, 0.1:1) on the activated sample at 323 K and
further heating in the gaseous mixture to 673 K for 20 min. Then, the system was evacuated at 323 K (Preactor < 1x10⁻³), prior to NO2 adsorption. Next, the poisoned
16
poisoned sample surface with NOx. Finally, the reactor was evacuated (Preactor <
1x10⁻³) at 323 K and FTIR spectrum of the sample was obtained.
2.2.2 BET
A Micromeritics Tristar 3000 surface area and porosity analyzer has been used for the BET specific surface area (SSA) measurements. SSA values were measured via low-temperature (LN2 temperature) isothermal adsorption-desorption
of N2. Before the SSA measurements, 0.1g of the sample material was evacuated at
623 K for 3 hr in order to remove water, CO2 and hydrocarbons from the pores inside
the sample. After the outgassing is completed, the net mass loss of the sample was measured for the SSA calculations.
2.2.3 X-Ray Diffraction (XRD)
The XRD patterns were recorded using a Rigaku Miniflex diffractometer, equip
ed with a Miniflex goniometer and an X-ray source with CuKα radiation, at λ = 1.54 Å, 30 kV and 15 mA. The powder samples were pressed and affixed onto standard-sized glass slides and scanned within the 10–80o, 2θ range with a scan rate of 0.01o s−1. Diffraction patterns were assigned using Joint Committee on Powder Diffraction Standards (JCPDS) cards supplied by the International Centre for Diffraction Database (ICDD).
2.2.4 Raman Spectroscopy
The Raman spectra were recorded under ambient conditions using a HORIBA Jobin Yvon LabRam HR 800 instrument, equipped with a confocal Raman BX41 microscope, spectrograph with an 800 mm focal length and a CCD detector. The Raman spectrometer was equipped with a Nd: YAG laser (λ = 532.1 nm). While the Raman experiments were conducted, the laser power was tuned to 20 mW, measured at the sample position, in order to minimize the sample heating effects. All the powder samples were mechanically dispersed onto a single-crystal Si holder. The
17
incident light source was dispersed by a holographic grating with 600 grooves/mm and focused onto the sample using a 50X objective. The confocal hole and slit entrance were set at 1100 and 200 μm, respectively. The spectrometer was regularly calibrated by adjusting the zero-order position of the grating and comparing the measured Si Raman band frequency with the typical reference value of 520.7 cm-1. All Raman spectra were acquired within 100-4000 cm-1 with an acquisition time of 213 s and a spectral resolution of 4 cm-1.
2.2.5 Temperature Programmed Desorption (TPD)
2.2.5.1 Thermal Stability of NOx species on Fresh Materials
TPD experiments were acquired by using a QMS, which was directly connected to the vacuum chamber through a pneumatic gate valve. The powder sample (mass = c.a. 20 mg) was pressed onto a tungsten grid which was mounted in the IR/TPD cell, as described above. Prior to each TPD data, oxidation-resistant thoria coated iridium filament of the mass spectrometer was outgassed for 30 min. After cooling to 323 K, the sample was exposed to 8 Torr of NO2 for 20 min until the
equilibrium was reached. Next, the system was outgassed at 1 x 10⁻⁶ Torr in order to remove the weakly physisorbed molecules. Subsequently, TPD experiments were carried out. Thermally evolving NOx species during the desorption sequence were
monitored by recording the QMS signals with mass to charge ratios (m/z) equal to 18 (H2O), 28 (N2/CO), 30 (NO), 32 (O2), 44 (N2O/CO2) and 46 (NO2) in pressure vs.
time mode. A linear temperature ramp within the range of 323 – 1023 K was used during the TPD experiments where the ramp rate was 12 K/min. In order to ensure the reproducibility of the results, TPD experiments were performed multiple times for each sample.
18
3. RESULTS AND DISCUSSION
3.1 Structural Characterization
3.1.1 XRD Experiments
Structures of the Pt/Al, Pt/Ba/Al, Ce/Al, Ba/Ce/Al and Pt/Ba/Ce/Al were investigated via XRD. Selected examples from these data sets are presented in the current text, in order to emphasize some of the structural variations among the synthesized materials.
XRD patterns shown in Figure 5 correspond to the 1Pt/Al sample. Two different phases were observed in these XRD patterns which were associated with Pt and γ-Al2O3. No other phases were discernible. The peaks at 2θ = 39.66o, 46.72o and
67.33o were assigned to the Pt phase while the peaks at 2θ = 31.21o, 32.76o, 36.72o, 39.66o, 45.34o, 46.12o, 50.60o, 60.00o and 67.33o were assigned to the γ-Al2O3 phase.
It is important to note that the Pt diffraction features grew and became sharper at elevated annealing temperatures, indicating crystallographic ordering and sintering of the Pt clusters on the alumina surface. Furthermore, no corundum formation was observed at T≤ 1273 K .
19 10 20 30 40 50 60 70 80 5000 10000 15000 In te nsi ty 2 theta 1273 K 1073 K 873 K 623 K 423 K 323 K Al2O3 Pt 1Pt/Al
Figure 5: X-ray diffraction patterns of 1Pt/Al after annealing at various temperatures.
10 20 30 40 50 60 70 80 5000 10000 15000 8Ba/1Pt/Al In te n si ty 2 theta b -Al2O3 Pt Ba(NO3)2 BaAl2O4 1273 K 1073 K 873 623 K 423 K 323 K 10 20 30 40 50 60 70 80 5000 10000 15000 20Ba/1Pt/Al In te n si ty 2 theta c 1273 K 1073 K 873 K 623 K 423 K 323 K -Al2O3 Pt Ba(NO3)2 BaAl2O4
Figure 6: Ex-situ XRD patterns of (a) 8Ba/Al, (b) 8Ba/1Pt/Al, (c) 20Ba/1Pt/Al after annealing at 323 K – 1273 K.
20
We also examined the 1Pt/Al samples functionalized with different BaO loadings (i.e. 1Pt/8Ba/Aland 1Pt/20Ba/Al) in Figure 6. Unlike the 1Pt/Alsample, we
observed two additional sets of signals for the 1Pt/8(20)Ba/Al samples which correspond to Ba(NO3)2 and BaAl2O4 phases. At T<823 K, Ba(NO3)2 peaks were
readily observed for both samples. The intensities of these Ba(NO3)2 features
gradually decreased upon further increase in the annealing temperature, eventually vanishing at T> 873 K. As expected, Ba(NO3)2 features are stronger and sharper for
the 1Pt/20Ba/Al sample at all temperatures below 873 K, due to the higher Ba loading in the 1Pt/20Ba/Al sample leading to larger and more ordered Ba(NO3)2
domains. BaAl2O4 phase started to appear at T > 873 K. BaAl2O4 is an undesired
phase due to its negative impact on the NOx trapping ability of the NSR systems
[90]. It is worth mentioning that although BaAl2O4 formation was not visible within
323-1273 K on 8Ba/Al sample, it was clearly visible for 1Pt/8Ba/Al sample at T ≥ 1073 K suggesting that the presence of Pt sites facilitates the diffusion of the BaO domains into the alumina matrix and the formation of the BaAl2O4 spinnel structure.
Formation of the BaAl2O4 was observed at T ≥ 873 K and also with a larger extent
21 10 20 30 40 50 60 70 80 15000 8Ba/1Pt/Al In te nsi ty 2 theta a -Al2O3 Pt Ba(NO3)2 BaAl2O4 1273 K 1073 K 873 623 K 423 K 323 K 10 20 30 40 50 60 70 80 15000 8Ba/1Pt/10Ce/Al BaAl2O4 Ba(NO3)2 Pt -Al2O3 In te nsi ty 2 theta b 1273 K 1073 K 873 K 623 K 423 K 323 K CeO2 10 20 30 40 50 60 70 80 15000 8Ba/1Pt/20Ce/Al In te nsi ty 2 theta c 1273 K 1073 K 873 K 623 K 423 K 323K BaAl2O4 Ba(NO3)2 Pt -Al2O3 CeO2
Figure 7: Ex-situ XRD patterns of (a) 8Ba/1Pt/Al, (b) 8Ba/1Pt /10Ce /Al and (c) 8Ba/1Pt/20Ce /Al samples at temperatures between (323 K - 1273 K).
10 20 30 40 50 60 70 80 15000 20Ba/1Pt/Al In te nsi ty 2 theta a 1273 K 1073 K 873 K 623 K 423 K 323K -Al2O3 Pt Ba(NO3)2 BaAl2O4 10 20 30 40 50 60 70 80 15000 423 K 623 K 873 K 1073 K 20Ba/1Pt/10Ce/Al In te nsi ty 2 theta B BaAl2O4 Ba(NO3)2 Pt -Al2O3CeO2 1273 K 323 K 10 20 30 40 50 60 70 80 15000 In te nsi ty 2 theta C BaAl2O4 Ba(NO3)2 Pt -Al2O3 CeO2 1273 K 1073 K 873 K 623 K 423 K 323 K 20Ba/1Pt/20Ce/Al
Figure 8: Ex-situ XRD patterns of (a) 20Ba/1Pt/Al, (b) 20Ba/1Pt/10Ce/Al and(c) 20Ba/1Pt//20Ce/Al samples at temperatures between (323 K - 1273 K).
22
The effect of the ceria loading on the Pt/BaO/Al2O3 system was investigated
via XRD within 323 K to 1273 K, as shown in Figures 7 and 8. γ-Al2O3, Pt, BaAl2O4
and CeO2 were the main phases that were observed for the Pt/Ce/Ba/Al samples.
Two observations are worth emphasizing in Figures 7 and 8. Firstly, it is seen that increasing the Ce loading leads to smaller Pt signal intensities for the Pt/Ce/Ba/Al samples, in comparison to the Pt/Ba/Al counterpart which lacks Ce. This may be explained by the presence of smaller and less ordered Pt clusters in the case of Pt/Ce/Ba/Al, where CeO2 promoter enhances the Pt dispersion by suppressing the
sintering of Pt clusters and limiting their surface diffusion [91]. Secondly, increasing the Ce loading also suppressed the growth of the undesired BaAl2O4 phase to a
certain extent. Although this effect is not very strong, it is still visible. Possible explanation is that some of the CeO2 domains residing below the BaO clusters
provide a diffusion barrier for the BaO phase and hinder the intermixing of the Al2O3
support material and the BaO phase, preventing the formation of the BaAl2O4
23
3.1.2 Raman Spectroscopy Experiments
Structural properties of Pt/Al, Pt/Ba/Al, Ce/Al, Ba/Ce/Al and Pt/Ba/Ce/Al were also investigated via Raman spectroscopy. Selected examples from these data sets are presented in the current text in order to emphasize some of the structural variations among the synthesized materials.
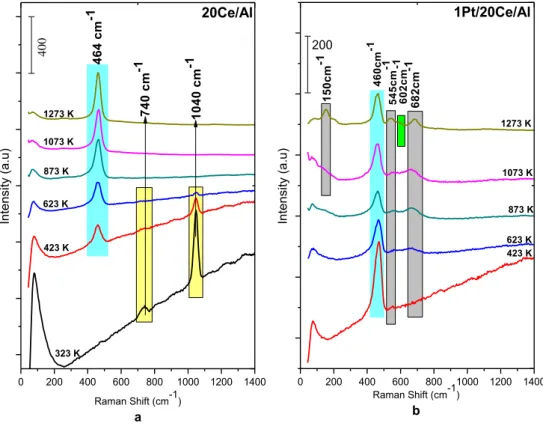
Figure 9 presents the Raman spectra for 20Ce/Al and 1Pt/20Ce/Al samples revealing the influence of Pt addition to the (promoted) Ce/Al support material. Raman spectrum of CeO2 has been previously investigated by Shyu et al. [92], who
assigned the 462 cm-1 band to the Raman active t2g mode of the fluorite structure.
Such a feature is also readily visible in Figure 9a and 9b corresponding to the 20Ce/Al and 1Pt/20Ce/Al samples, respectively. In Figure 9b, additional bands appear at 150, 550, 603, 690 cm-1 due to the incorporation of Pt sites onto the 20Ce/Al structure. It is worth mentioning that bands appearing at 550 and 690 cm-1 become more intense with increasing ceria loadings (data not shown). These bands can be assigned to the Pt-O-CeO2 species on the surface which are formed due to the
strong metal support interaction (SMSI) between the Pt sites and the underlying CeO2 domains [93].
A weak feature located at 601cm-1 increases upon thermal treatment at 1273 K in Figure 9b. It is known that noble metals can promote reduction of Ce(IV) to Ce(III) [94]. Reduction of Ce sites (accompanied by the oxidation of Pt sites) is favored at higher temperatures as ceria loses some oxide ions from its lattice structure forming a non-stoichiometric CeO2-x. Therefore, the band at 601cm-1 in
Figure 9b can be associated with intrinsic oxygen vacancies in the defective ceria structure [95]. The feature that is located at 150 cm-1 in Figure 9b (1Pt/20Ce/Al) which is not present in Figure 9a (20Ce/Al) is tentatively attributed to the presence of CeO2 domains that are in the close proximity of the Pt sites or directly linked to the
24 0 200 400 600 800 1000 1200 1400 1 0 4 0 c m -1 4 6 4 c m -1 In te n si ty (a .u ) Raman Shift (cm-1) a 1273 K 1073 K 873 K 623 K 423 K 323 K 7 4 0 c m -1 400 20Ce/Al 0 200 400 600 800 1000 1200 1400 150cm -1 602cm -1 Raman Shift (cm-1) b In te n si ty (a .u ) 545cm -1 682cm -1 460cm -1 1273 K 1073 K 873 K 623 K 423 K 1Pt/20Ce/Al 200
Figure 9: Ex-situ Raman spectra for the (a) 20Ce/Al and (b) 1Pt/20Ce/Al samples that were annealed in Ar(g) at the given temperatures within 323 K – 1273 K.
Another important aspect of Figure 9 is the Raman signals located at 740 and 1040 cm-1 which correspond to the bending and the symmetric stretching modes of NO3-, respectively [95]. These nitrate groups originate from the ceria precursor used
in the synthesis (i.e. Ce(NO3)3.6H2O). It is seen in Figure 9a that nitrate
decomposition is completed on the 20Ce/Al surface within 873 K >T> 623 K. On the other hand, when the 20Ce/Al system is functionalized with Pt to obtain the 1Pt/20Ce/Al material, nitrate decomposition is completed at 423 K. Thus, it is apparent that the presence of Pt sites facilitates the decomposition of Ce(NO3)3.
25 200 400 600 800 1000 1200 1400 10 46 c m -1 467 c m-1 8Ba/20Ce/Al In te nsi ty Raman Shift(cm-1) b 1273 K 1073 K 873 K 623 K 423 K 323 K 200 0 200 400 600 800 1000 1200 1400 1049cm -1 8Ba/10Ce/Al In te nsi ty Raman Shift(cm-1) a 1273 K 1073 K 873 K 623 K 423 K 323K 100 467 c m-1 73 6 cm -1
Figure 10: Ex-situ Raman spectra for the (a) 8Ba/10Ce/Al and (b) 8Ba/20Ce/Al samples that were annealed in Ar(g) at the given temperatures within 323 K – 1273 K.
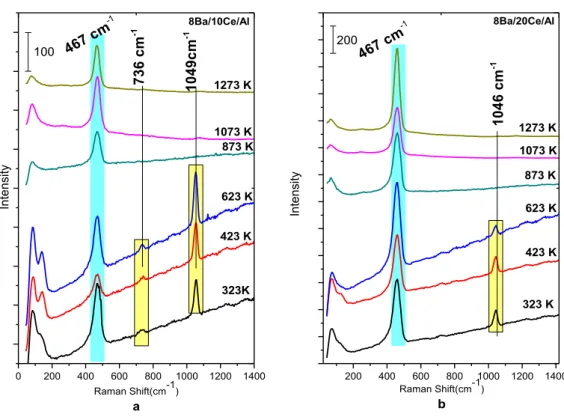
The Raman spectra given in Figure 10 reveal the effect of ceria addition to a conventional NOx storage material in the form of BaO/Al2O3. The feature located at
143 cm-1 associated with the lattice phonon excitation of Ba(NO3)2 indicates the
presence of crystalline Ba(NO3)2 domains. This band is a characteristic feature of all
of the synthesized materials where Ba(NO3)2 was used as a precursor. Increasing the
ceria loading causes the band at 467 cm-1 to become more visible due to the formation of larger and more ordered CeO2 domains with increasing Ce loading. It is
also visible in Figure 10 that all of the nitrate species coming from the Ce and Ba precursors decompose at T< 873 K from the Ba/Ce/Al samples.
26 0 200 400 600 800 1000 1200 1400 155cm -1 1049cm -1 542cm -1 601cm -1 688cm -1 8Ba/1Pt/10Ce/Al 100 In te nsi ty (a .u ) Raman Shift (cm-1) a 1273 K 1073 K 873 K 623 K 423 K 323 K 467cm -1 0 200 400 600 800 1000 1200 1400 602cm -1 548cm -1 100 8Ba/1Pt/20Ce/Al 680cm -1 464cm -1 1048cm -1 In te nsi ty (a .u ) Raman Shift(cm-1) b 1273 K 1073 K 873 K 623 K 423 K 323 K
Figure 11: Ex-situ Raman spectra for the (a) 8Ba/1Pt/10Ce/Al and (b)
8Ba/1Pt/20Ce/Al samples that were annealed in Ar(g) at the given temperatures within 323 K – 1273 K.
After having performed Raman analysis of the benchmark samples that are discussed above, similar analysis were also performed for complete ceria promoted NSR catalysts in the form of 1Pt/10(20Ce)/8Ba/Al. Results of such experiments are presented in Figure 11. The bands located at 150, 550, 603, 690 cm-1 are observed to increase with increasing ceria loading and increasing annealing temperatures. These bands are attributed to the CeO2 domains that are directly interacting with the Pt
sites. However it is worth emphasizing that, these bands do not uniquely correspond to a single Pt-CeO2 surface species as the intensity ratio of the 545 cm-1 signal to the
682 cm-1 signal is not constant and shows some variance at increasing annealing temperatures.
27
3.1.3 BET
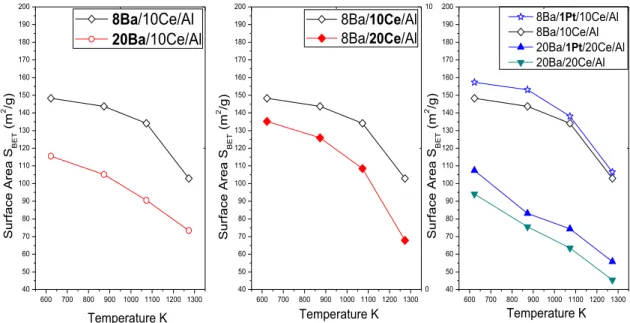
Specific surface areas corresponding to the synthesized samples were found to be significantly affected by the thermal treatments and as an outcome, the SSA values tend to decrease in a monotonic fashion with increasing temperature and increasing both CeO2 and BaO loading. Such a behavior is rather common for
thermal processes leading to sintering. On the other hand, addition of platinum was found to increase the SSA values by a small extent.
600 700 800 900 1000 1100 1200 1300 40 50 60 70 80 90 100 110 120 130 140 150 160 170 180 190 200 S urfac e A rea SBET (m 2 /g) Temperature K 8Ba/10Ce/Al 20Ba/10Ce/Al 600 700 800 900 1000 1100 1200 1300 40 50 60 70 80 90 100 110 120 130 140 150 160 170 180 190 200 S urfac e A rea SBET (m 2 /g) Temperature K
8Ba/10Ce/Al
8Ba/20Ce/Al
0 10 600 700 800 900 1000 1100 1200 1300 40 50 60 70 80 90 100 110 120 130 140 150 160 170 180 190 200 S urfac e A rea SBET (m 2 /g) Temperature K 8Ba/1Pt/10Ce/Al 8Ba/10Ce/Al 20Ba/1Pt/20Ce/Al 20Ba/20Ce/Al
28
3.2 FTIR Spectroscopic Analysis of NO
xAdsorption on Synthesized
Materials
3.2.1 Stepwise NOx adsorption on pure γ-Alumina and CeO2
2400 2200 2000 1800 1600 1400 1200 1000 800 2218 1917 1075 794 944 15 80 b ide nt at e 16 17 b ridg ed 1695 14 82 m on od en ta te 12 73 b ide nt at e 12 28 b ridg ed 10 10 0 .2 5 Wavenumber (cm-1) b ab so rb an ce ( a. u .) CeO2 2400 2200 2000 1800 1600 1400 1200 1000 12 97 b ide nta te NO X Uptake 14 65 m on od en ta te 1379 1323 2349 2257 1963 Al -N2 O3 12 59 b rid ge d 25th ab so rb an ce ( a. u .) wavenumber (cm-1) a 16 21 b ridg ed 15 97 b ide nta te 15 61 bide nta te 1229 1041 1080 1st 0 .2 5
-Al
2O
3Figure 13: FTIR spectra of stepwise NO2(g) adsorption on a) γ-Alumina and b) ceria
at 323 K.
The FTIR spectra obtained after NO2 adsorption on pure γ-Al2O3 and pure
ceria, at 323 K is presented in Figure 13. It is visible in Figure 13a and 13b that the general aspects of the vibrational spectra corresponding to these two surfaces show significant resemblances, revealing similar types of adsorbed NOx species. Ozensoy
et al. [96] has studied NO2 adsorption mechanism on γ-Al2O3 by FTIR spectroscopy.
Figure 13 can be interpreted in the light of these former studies. Some of the IR bands given in Figure 13 can be assigned to different types of nitrates formed on the alumina and ceria support such as: bridging (1606–1630 cm−1 and 1211–1266 cm−1), bidentate (1571–1612 cm−1 and 1249–1293 cm−1), monodentate (1575–1588 and
29
1292–1297 cm−1), and linear (1479 cm−1) nitrates [97,98]. The band at 1230 cm−1 is also assigned to a bridged nitrite species [99].
Bands are also observed near 2250 cm-1 and 2220 cm-1 for alumina and ceria, respectively. These can be attributed to the weakly adsorbed N2O species. This
feature disappears after outgassing at increasing temperatures [100]. Furthermore, the development of a broad feature in the range of 1920-1980 cm-1 can readily be assigned to adsorbed N2O3 and/or NO+ [101].
30
3.2.2 Ce/Al Binary System
3.2.2.1 Stepwise NOx adsorption on Ce/Al binary system
2000 1800 1600 1400 1200 1000 1590 Bidantate Nitrite Linear Nitrite Bridged Nitrite Bridged Nitrate 1232 1292 1258 1012 C e r iu m N itr ate 1043 A lu m in u m N itr ate 1083 A lu m in u m N itr ate 1620 1460 a b so rb a n c e a .u . wavenumber (cm-1) a 0 .2 5
10CeAl
1560 Monodentate Nitrate NOx Uptake 2000 1800 1600 1400 1200 1000 1590 1086 A lu m in u m N itr ate 1006 C e r iu m N itr ate 1035 A lu m in u m N itr ate 1621 1562 1288 1230 1260 145720CeAl
0 .2 5 a b so rb a n c e a .u . wavenumber (cm-1) b NOx UptakeFigure 14: FTIR spectra of stepwise NO2(g) adsorption on (a) 10Ce/Al and (b)
20Ce/Al at 323 K.
NO2 uptake properties of ceria promoted alumina support materials (i.e.
10Ce/Al and 20Ce/Al) are also investigated in stepwise NO2 adsorption experiments
via FTIR spectroscopy at 323 K. These results are presented in Figure 14. It is apparent that increasing the ceria loading from w%10 to w%20 does not have a significant influence on neither types of the adsorbed NOx species nor their relative
surface coverages. During the very early stages of the NO2(g) uptake, the most
dominant signal is located 1230 cm-1 which is associated with the bridging nitrites [99]. Further increase in the NO2 exposure leads to the oxidation of these nitrite
species to form various types of nitrates as a result of the disproportionation of NO2
31
3.2.2.2 Effect of Pt on the NOx uptake properties of Ce/Al binary system
After having investigated the NOx uptake properties of the simple Al2O3 and
CeO2 support materials as well as promoted support materials in the form of Ce/Al,
influence of the Pt sites on the NOx uptake properties of promoted Ce/Al support
materials were also studied via FTIR spectroscopy. Results of these investigations are shown in Figure 15.
2000 1800 1600 1400 1200 1000
1Pt/10Ce/Al
a b so rb a n c e a .u . wavenumber (cm-1) a 0 .2 5 NOx Uptake 1318 1590 1230 1006 C e r iu m N itr ate 1256 1095 A lu m in u m N itr ate 1298 1040 A lu m in u m N itr ate 1621 1562 2000 1800 1600 1400 1200 1000 1321 1230 1462 1259 12851Pt/20Ce/Al
a b so rb a n c e a .u . wavenumber (cm-1) b NOx Uptake 1590 1621 1560 1003 C e r iu m N itr ate 1037 A lu m in u m N itr ate 0 .2 5Figure 15: FTIR spectra of stepwise NO2(g) adsorption on (a) Pt/10Ce/Al and
32
Comparison of Figure 14 and 15 reveals that upon addition of Pt (Figure 15), an enhancement in the intensities of the bidentate and bridging nitrate signals are apparent while the intensities of the monodentate nitrates decrease to a certain extent. Furthermore, bidentate and bridging nitrate signals seem to be better resolved in Figure 15. In addition , increasing Ce loading in the Ce/Al (Figure 16) and Pt/Ce/Al (Figure 15) systems have a discernible influence on the nitrate band intensities, where the IR signal intensities for the nitrate species increase for 20 wt% Ce loading. Although this effect is less pronounced in the case of 10(20)Ce/Al, it is more readily visible in 1Pt/10(20)Ce/Al.
2000 1800 1600 1400 1200 1000 1254 1290 1590 1559 1490 1631 0 .2 5 wavenumber (cm-1) a ab so rb an ce a .u . 1Pt/20CeAl 20CeAl 1Pt/10CeAl 10Ce/Al 1Pt/10Ce/Al 20Ce/Al 1Pt/20Ce/Al 10CeAl 2000 1800 1600 1400 1200 1000 1591 1561 1491 1290 1256 1040 1003 1630 ab so rb an ce a .u . wavenumber (cm-1) b 1Pt/10Ce/Al 1Pt/20Ce/Al 0 .2 5
Figure 16: A comparative analysis of the FTIR spectra corresponding to stepwise NO2(g) adsorption on Ce/Al and Pt/Ce/Al systems at 323 K, revealing the influence
33
In order to clearly demonstrate the influence of the Pt sites on the total NOx
uptake capacity of the promoted Ce/Al support materials, FTIR data given in Figures 16 and 15 are analyzed in a comparative fashion as shown in Figure 16. Figure 16a, reveals that Pt addition to the promoted Ce/Al support material results in a significant enhancement of the NOx uptake capacity where this enhancement is more discernible
for the 20Ce/Al case. The increase in NOx uptake capacity are also in line with the
presence of the bands at 550 and 690 cm-1 in the corresponding Raman spectra of these materials suggesting the existence of Pt-O-CeO2 surface species and a strong
metal support interaction between Pt and CeO2 [93]. Thus, it is apparent that these Pt
sites which are in close proximity of the CeO2 domains catalyze the nitrate formation
process and increase the quantity of the nitrate species stored by the Pt/Ce/Al system. As mentioned above, although Ce loading has a minor influence on the NOx uptake
capacity in the case of Ce/Al, NOx uptake capacity becomes quite sensitive to Ce
loading in the case of Pt/Ce/Al system indicating that the Pt sites can readily activate some of the CeO2 domains on the surface which are not active for NOx uptake in the
absence of Pt sites. The catalytic function of the Pt sites in the nitrate formation process can be associated with the facile NO2 activation on the Pt surface yielding
atomic oxygen species which readily spill over from the Pt surface to the neighboring CeO2 and Al2O3 sites enabling the nitrate formation on the oxide domains. In other
words, Pt sites may function as atomic oxygen transporters. Alternatively, nitrate species may also be forming directly on the Pt sites followed by a facile spill-over towards the alumina and ceria domains.
34
3.2.2.3 Effect of Pt on the Thermal Stability of Adsorbed NOx on the Ce/Al
Binary System
Thermal stability of the adsorbed NOx species were also investigated via TPD
technique. After having studied the chemical nature and the vibrational properties of the adsorbed NOx species on the standard support materials (i.e. γ-Al2O3 and CeO2),
promoted support materials (i.e. Ce/Al) and their Pt functionalized forms, we have also investigated their TPD profiles after NO2 adsorption. Figure 17 shows such TPD
experiments obtained after saturating the given surfaces with NO2 at 323 K as
described above. 300 400 500 600 700 800 900 1000 0,0000 0,0006 870 K 6 8 0 K 6 5 0 K 20CeAl Temperature K b Q M S I n te n si ty N2 NO O2 N2O NO2 N 375 K 300 400 500 600 700 800 900 0,0000 0,0006 760 K 550 K 1Pt/10Ce/Al Temperature K C Q M S I n te n si ty N2 NO O2 N2O NO2 N 375 K 300 400 500 600 700 800 900 1000 0,0000 0,0006 6 8 0 K 870 K 6 5 0 K N2 NO O2 N2O NO2 N Q M S I n te n si ty Temperature K a 10Ce/Al 375 K 300 400 500 600 700 800 900 0,0000 0,0006 550 K 375 K Temperature K d Q M S I n te n si ty N2 NO O2 N2O NO2 N 1Pt20CeAl
Figure 17: TPD profiles obtained after NO2 saturation at 323 K of (a) 10Ce/Al, (b)
35
We previously investigated the thermal desorption profiles of γ-Al2O3 surface
after saturation with NO2 at 323 K (data not shown) which yielded two major NOx
desorption peaks at 389 K and 625 K [109]. The first NOx desorption has been assigned to weakly bound N2O3/NO+or monodentate nitrate species [101-103]. The second feature, which was also the most prominent desorption signal, has been attributed to bridging and bidentate nitrates [102,103]. TPD profiles in Figures 17a and 17b demonstrate a major desorption band which has two overlapping desorption signals located at 630 K and 680 K. The former signal at 630 K can be assigned to desorption of bridging and bidentate nitrates from γ-Al2O3 surface [104]. The latter
signal at 680 K, which becomes better resolved upon increasing Ce loading, can be tentatively assigned to the desorption of slightly more stable surface nitrates bound to CeO2. Desorption feature at 870 K is associated with the decomposition of bulk
and/or ionic nitrates resulting from Ce(NO3)3 and/or Ce(NO3)4 with a characteristic
N2O desorption accompanying the NO and O2 desorption signals. The most striking
aspect of the TPD profiles given in Figure 17 is seen in Figures 17c and 17d corresponding to the Pt containing 1Pt/10(20)Ce/Al samples. It is evident that the addition of Pt to the Ce/Al system has a very drastic impact on the thermal stability of the bulk cerium nitrate species (i.e. desorption signals located at 760 - 870 K) indicating a strong interaction between the Pt sites and the underlying CeO2/Ce(NO3)x system, in very good agreement with the current Raman
spectroscopic, XRD and FTIR results, indicating that Pt sites catalyze the nitrate decomposition. Such a catalytic behavior of the Pt sites is not limited to the Ce sites and was also observed for the nitrates on the γ-Al2O3 sites which seem to be
desorbing at temperatures that are about 100 K lower than that of the Ce/Al system (650 K vs 550 K). Furthermore, the catalytic effect of the Pt sites also seem to be altering the nitrate decomposition mechanism particularly for the bulk cerium nitrates as the characteristic N2O desorption signal observed for these species in case
of 10(20)Ce/Al samples (Figures 17a and 17b) is lost after the addition of Pt (Figures 17c and 17d).
![Figure 1: Fuel consumption and three-way performance of gasoline engines [3].](https://thumb-eu.123doks.com/thumbv2/9libnet/5625345.111519/14.892.177.810.630.913/figure-fuel-consumption-way-performance-gasoline-engines.webp)
![Figure 3: Fluorite structure of CeO 2 [9]](https://thumb-eu.123doks.com/thumbv2/9libnet/5625345.111519/17.892.312.694.537.917/figure-fluorite-structure-of-ceo.webp)