2:15pm
-
2:30pm WT3Highly
D i r e c t i o n a l Resonant Antennas
Built
Around Photonic
C r y s t a l s
b Ekmel dzbay", Burak Temelkurana,
Mehmet
B a y i n d i r a , R . Bisaras,
M . M . S i g a l a s b , G . T u t t l e b , and K . M . Hob Photonic crystals are 3D periodic structures, in
which electromagnetic (EM) wave propagation is forbidden in all directions for a certain range of frequencies [ 1,2]. Various applications of these structures were proposed and experimentally demonstrated at frequencies extending from microwave to optical frequencies [3,4]. Among these applications, there is a great deal of growing interest for photonic crystal-based antennas operating at microwave ffequencies [5]. Although high directivities which could be achieved using array antennas on photonic crystals were suggested [6] the maximum directivity that was demonstrated by Brown and McMahon using a photonic crystal-based single dipole antenna was 10, along with a radiative gain of 8 [7].
The reported experimental and theoretical studies on the antenna applications mostly made use of the total reflection property of photonic crystals [7,
81. Resonant cavities around these structures can be created by breaking the periodicity of the crystal. Resonant cavity enhanced detectors [9] and waveguide applications [ 101 were recently demonstrated using localized modes of the cavities built around photonic crystals. In this letter, we report a photonic crystal-based resonant antenna with a very high directivity and gain.
The layer-by-layer dielectric photonic crystal we used in our experiments was designed to have a three- dimensional band gap with a mid-gap frequency around 12 GHz. We used the output port of a microwave network analyzer and a monopole antenna to obtain EM waves. Input port of the network analyzer and a standard gain horn antenna were used to receive the radiated EM field from the monopole antenna. The receiver was kept free to rotate around the antenna as shown in Fig. 1.
We investigated the radiation characteristics of
this monopole antenna, which was inserted into the
planar defect structures built around a photonic crystal that consisted of 20 layers. The planar defect was formed by separating the 8th and 9th layers of the structure. In order to suppress the radiation in the backward direction, we intentionally chose one of the mirrors of the cavity to have a higher reflectivity (-1 8- 20 dB) than the front mirror.
In the H-plane measurements, the antenna and the polarization axis of the receiver horn antenna was kept vertical, and were parallel to each other. We then rotated the antenna, photonic crystals and the horn
antenna 90 degrees to measure the radiation pattern in the perpendicular plane @-plane).
Figure 1 Experimental setup
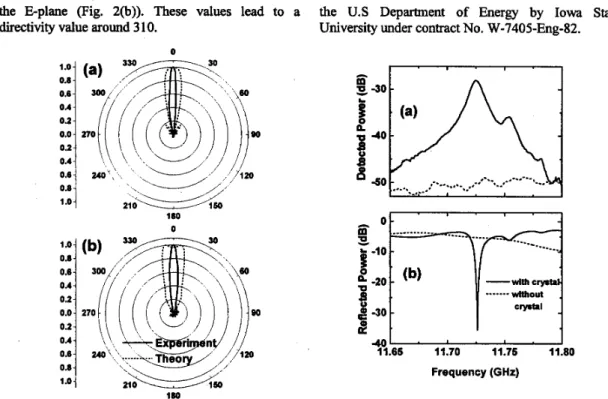
We first measured the detected power at the resonance ffequency of the cavity as a function of angle. Figure 2(a) (solid line) shows the normalized radiation pattern in H-plane. We observed a strong radiation around 8=0", where the radiation along other directions is highly suppressed. The measurements performed in the other plane (E-plane, Fig. 2(b), solid line) also resulted in a similar radiation pattern.
Antenna radiation patterns were simulated with the widely used finite-difference-time-domain (FDTD) technique [8]. To reduce the FDTD computational space, a short dipole antenna was used in the simulations which should approximate well the monopole antenna. The time dependent Maxwell's equations were numerically integrated with the fixed frequency dipole source inside the defect volume of the photonic crystal, to obtain the far-field radiation pattern. As shown in Fig. 2, the measured (solid lines) and calculated (dotted lines) radiation patterns for both planes agree qualitatively well. The broader pattern in the simulations may be due to the finite time of the simulations not allowing the system to fully reach a steady state.
For antennas with one narrow major lobe and very negligible minor lobes in the radiation pattern, the directivity can be approximated as D0=4x/0~02, where
O1 is the half-power beamwidth in one plane and 0,
in the perpendicular plane to the first, in radians. The measured half-power beamwidth along the H-plane (Fig. 2(a)) was 12 degrees, and was 11 degrees along
a Department of Physics, Bilkent University, Bilkent, Ankara 06533, Turkey.
Ames Laboratory and Microelectronics Research Center, Iowa State University, Ames, IA 5001 1, USA.
the E-plane (Fig. 2(b)). These values lead to a directivity value around 3 10.
0 1.0- 0.8 - 0.6 - OA- 0.2 - 0.0 - 0.2 - 1.0- 0.8 - 0.6 - 0.4 - 0.2 - 0.0 - 0.2 - 180
Figure 2 The measured (solid lines) and calculated (dotted lines) radiation patterns of the monopole antenna for (a) H-field and (b) E-field.
Figure 3(a) (solid line) shows the detected power as a function of frequency at 04". The dotted line displays the detected power at the same angle in the absence of the photonic crystal. At resonance fiequency, we observed a power enhancement factor of 180 (22.6
dB)
at a defect frequency of 1 1.725 GHz. The Q-factor (quality factor), defined as the center fiequency divided by the full width at half maximum, was measured to be 895.In order to understand the effect of the resonator to the efficiency of the monopole antenna, we also measured the S-parameters of
our
antema structure. Figure 3@) shows the reflection power coefficient(SI,) which is 30% (-5
dB)
for the monopole antennastanding alone in air. When the antenna was inserted inside the cavity, we observed a very sharp drop (-35
dB)
at resonance fiequency in the reflection spectra (Fig. 3(b), solid line). This drop indicates that most of the power (99.97%) is radiated out in the presence of the cavity. The maximum radiation gain for our antenna is related to the maximum directivity by Go=(l-R)(l-A)Do, where R is the reflected power (0.0003) and A is the absorptivity of the antenna. Assuming that the absorption in the antenna has a negligible value, the maximum gain has a value -300.This work is supported by NATO Grant No. SfP971970, National Science Foundation Grant No. INT-9812322, and NATO-Collaborative Research Grant No. 950079. Ames Laboratory is operated for
the U S Department of Energy by Iowa State University under contract No. W-7405-Eng-82.
4 0 1
.
' I11.65 11.70 11.75 11.00
Frequency (GHz)
Figure 3 The detected power at
8=0"
(a) and reflection power coefficient S11 (b) of the monopole antenna around resonance fiequency.REFERENCES
[l] K. M. Ho, C. T. Chan, and C. M. Soukoulis, Phys. Rev. Lett. 65,3 152 (1 990).
[2] E. Yablonovitch, T. J. Gmitter, and K. M. Leung, Phys. Rev. Lett. 67,2295 (1991).
[3] J. D. Joannopoulos, P. R Villeneuve, and S. Fan, Nature 386,143 (1 997).
[4] S. Fan, P. R Villeneuve, J.
D.
Joannopoulos, H. A. Haus, Phys. Rev. Lett. 80,960 (1 998).[5] E. R Brown, C. D. Parker, and E. Yablonovitch, J.
Opt. Soc. Am. B 10,404 (1993).
[6] G. Poilasne, P. Pouliguen, K. Mahdjoubi, J. Lenormand, C. Terret, and P h Gelih, Micro. Opt. Tech. Lett. 18,32 (1998).
[7] E. R Brown and 0. B. McMahon, Appl. Phys. Lett. 68, 1300 (1 996).
[8] M. M. Sigalas, R Biswas, Q. Li, D. Crouch, W. Leung, R Jacobs-Woodbury, B. Lough, S. Nielsen, S. McCalmont, G. Tuttle, and K.-M Ho, Micro. Opt. Tech. Lett. 15,153 (1 997).
[9] B. T e m e h a n , E. Ozbay, J. P. Kavanaugh, and G. Tuttle, Appl. Phys. Lett. 72,2376 (1998).
[lo] S. Y. Lm, E. Chow, V. Hietala, P. R Villeneuve, J. D. Joannopoulos, Science 282,274 (1 998).