IDENTIFICATION OF ATP8A2 GENE MUTATION IN A
CONSANGUINEOUS FAMILY SEGREGATING
CEREBELLAR ATROPHY AND QUADRUPEDAL GAIT
A THESIS
SUBMITTED TO THE DEPARTMENT OF MOLECULAR BIOLOGY AND GENETICS
AND THE GRADUATE SCHOOL OF ENGINEERING AND SCIENCE OF BILKENT UNIVERSITY
IN PARTIAL FULFILLMENT OF THE REQUIREMENTS FOR THE DEGREE OF
DOCTOR OF PHILOSOPHY
By
Onur Emre Onat
December, 2012
ii
I certify that I have read this thesis and that in my opinion it is fully adequate, in scope and in quality, as a thesis for the degree of Doctor of Philosophy.
Prof. Dr. Tayfun Özçelik (Advisor)
I certify that I have read this thesis and that in my opinion it is fully adequate, in scope and in quality, as a thesis for the degree of Doctor of Philosophy.
Assoc. Prof. Dr. Işık Yuluğ
I certify that I have read this thesis and that in my opinion it is fully adequate, in scope and in quality, as a thesis for the degree of Doctor of Philosophy.
iii
I certify that I have read this thesis and that in my opinion it is fully adequate, in scope and in quality, as a thesis for the degree of Doctor of Philosophy.
Assoc. Prof. Dr. Hilal Özdağ
I certify that I have read this thesis and that in my opinion it is fully adequate, in scope and in quality, as a thesis for the degree of Doctor of Philosophy.
Assist. Prof. Dr. Katja Doerschner
Approved for the Graduate School of Engineering and Science
Prof. Dr. Levent Onural Director of the Graduate School
iv
ABSTRACT
IDENTIFICATION OF ATP8A2 GENE MUTATION IN A
CONSANGUINEOUS FAMILY SEGREGATING
CEREBELLAR ATROPHY AND QUADRUPEDAL GAIT
Onur Emre Onat
Ph.D. in Molecular Biology and Genetics Supervisor: Prof. Dr. Tayfun Özçelik
December, 2012
Cerebellar ataxia, mental retardation, and dysequilibrium syndrome is a rare and heterogeneous neurodevelopmental disorder characterized by cerebellar atrophy, dysarthric speech, and quadrupedal locomotion. Here, a consanguineous family with four affected individuals which suggest an autosomal recessive inheritance was investigated. Homozygosity mapping analysis using high-resolution genotyping arrays in two affected individuals revealed four shared homozygous regions on 13q12, 19p13.3, 19q13.2, and 20q12. Target enrichment and next-generation sequencing of these regions in an affected individual was uncovered 11 novel protein altering variants which were filtered against dbSNP132 and 1000 genomes databases. Further population filtering using personal genome databases and previous exome sequencing datasets, segregation analysis, geographically-matched population screening, and prediction approaches revealed a novel missense mutation, p.I376M, in ATP8A2 segregated with the phenotype in the family. The mutation resides in a highly conserved C-terminal transmembrane region of E1-E2 ATPase domain. ATP8A2 is mainly expressed in brain, in particular with the highest levels at cerebellum which is a crucial organ for motor coordination. Mice deficient with Atp8a2 revealed impaired axonal transport in the motor neurons associated with severe cerebellar ataxia and body tremors. Recently, an unrelated individual with a de novo t(10;13) balanced translocation whose one of the ATP8A2 allele was disrupted has been identified. This patient shares similar neurological phenotypes including severe mental retardation and hypotonia. These findings suggest a role for ATP8A2 in the neurodevelopment, especially in the development of cerebro-cerebellar structures required for posture and gait in humans.
Keywords: Quadrupedal locomotion, CAMRQ, cerebellar atrophy, next-generation sequencing, ATP8A2.
v
ÖZET
EL AYAK ÜZERİNDE YÜRÜYÜŞ VE SEREBELLAR ATROFİ
AKTARILAN AKRABA EVLİLİĞİ YAPMIŞ BİR AİLEDE
ATP8A2 GEN MUTASYONU SAPTANMASI
Onur Emre Onat
Moleküler Biyoloji ve Genetik, Doktora Tez Yöneticisi: Prof. Dr. Tayfun Özçelik
Aralık, 2012
Serebellar ataksi, mental retardasyon ve dengesizlik sendromu, serebellar atrofi, dizartirik konuşma ve el ayak üzerinde yürüme ile tanımlanan nadir heterojen bir sinir-gelişimsel hastalıktır. Burada, hastalığın otozomal resesif olarak aktarıldığı bir ailede, ebeveynleri arasında akraba evliliği bulunan etkilenmiş dört bireyin durumu tanımlanmıştır. Etkilenmiş iki bireyde yüksek çözünürlüklü genotipleme yöntemi ile yapılan homozigotluk haritalaması sonucu 13q12, 19p13.3, 19q13.2 ve 20q12 üzerinde dört adet ortak homozigot bölge tespit edilmiştir. Bu bölgelerin etkilenmiş bir bireyde hedefe yönelik yeni nesil dizilemesi sonucu bulunan varyantlar, “dbSNP132” ve “1000 genomes” veri tabanlarında filtrelenmiş ve 11 adet yeni protein yapısını değiştiren varyant belirlenmiştir. Bu varyantların, kişisel genom veri tabanlarında ve eksom dizileme veri setlerinde filtrelenmesi, segregasyon analizi, aynı bölgeden bireylerde toplum taraması ve öngörü yaklaşımları ile elenmesi sonucu olarak, ailede hastalığın kalıtımı ile uygun ATP8A2 üzerinde yeni bir yanlış anlam mutasyonu, p.I376M, ortaya çıkmıştır. Mutasyon E1-E2 ATPaz etki alanında evrimsel olarak son derece korunmuş C-terminal transmembran bölgesinde yer almaktadır. ATP8A2 en çok beyinde ifade edilir, özellikle motor koordinasyondan sorumlu serebellumda en yüksek seviyededir. Atp8a2 geni eksik farelerde motor nöronlarda bozuk aksonal transporttan kaynaklı ciddi serebellar ataksi ve vücut titremesi görülmüştür. Yakın zamanlarda, t(10;13) dengeli translokasyon taşıyan alakasız bir bireyin ATP8A2 bozulması sonucu ciddi mental retardasyon ve hipotoni gibi benzer nörolojik fenotipleri taşıdığı gösterilmiştir. Bu bulgular, insanlarda duruş ve yürüyüş için gereken serebro-serebellar yapıların gelişmesinde ATP8A2’nin bir rolü olduğunu düşündürmektedir.
Ahahtar Sözcükler: ATP8A2, serebellar hipoplazi, hedefe yönelik yeni nesil dizileme, el ayak üzerinde yürüme, CAMRQ
vi
To my family… Gülseren and İsmail Onat
vii
Acknowledgement
Foremost, from the depth of my heart I express my deep sincere gratitude and heartfelt thanks to my supervisor, Prof. Tayfun Özçelik, who extended all facilities and opportunities throughout my Ph.D. study and research and provided continuous support, immense knowledge, inspiring guidance, motivation, and encouragement for the successful completion of my research work and the improvement of my academic career. I deem it as my chance to work under his able guidance. I will forever remain grateful to him.
Besides my advisor, I am thankful to my committee members, Assoc. Prof. Işık Yuluğ and Assist. Prof. Katja Doerschner for providing valuable guidance and suggestions, Assoc. Prof. Rengül Çetin-Atalay and Assoc. Prof. Hilal Özdağ for serving on my dissertation committee, and all other faculty members for their inspiration, help and suggestions.
I am also thankful to Dr. Süleyman Gülsuner for his effort and help in research and for his valuable guidance in bioinformatics approaches.
I would like to thank Prof. Murat Günel and Dr. Kaya Bilgüvar for their effort and support in next generation sequencing experiments and providing access to the published and unpublished exome sequencing datasets. I also would like to thank Prof. Salim Çıracı for providing access to computer facilities and servers.
I would like to thank Prof. Uner Tan and Prof. Meliha Tan for identifying and recruitment of the patients and other pedigree members, for brain imaging studies and for clinical tests.
viii
I would like to thank Prof. Ayşe Nazlı Başak and Prof. Haluk Topaloğlu for providing control subjects and collect their blood samples.
I also record my appreciation to the senior researchers of our group, Dr. Chigdem Aydın Mustafa, Gülşah Dal, and Füsun Doldur Balcı, senior students, and all other lab members for their pleasant association and help in various forms.
The financial, academic and technical support of the Bilkent University and its staff and the financial support of the TUBİTAK are gratefully acknowledged.
I would like to offer special thanks to İclal Özçelik for her kind and valuable support, for the careful review and many suggestions that she provided on the manuscripts and for her behind-the-scenes efforts.
I would like to express my deep thanks to İnci Şimşek for her constant support, generous care, love and patience during writing of this thesis.
I think of my parents Gülseren and İsmail Onat, my spiritual mother Güler Uğurlu, my sister Emel Göllü and her family Eyyüp, Bade Naz, Ela Berfin, all my uncles, aunts, and cousins whose spiritual support, understanding, love and unceasing prayers has enabled me to reach the present position in life. I will be forever indebted for having such a large and lovely family.
Thank You.
ix
Contents
1. Introduction 1
1.1 Quadrupedal Locomotion in Humans ... 1
1.2 Cerebellum and Motor Coordinates ... 2
1.2.1 Function of the cerebellum ... 2
1.2.2 Anatomy of the cerebellum and pathology characteristics ... 3
1.2.3 Cellular components of the cerebellum and neuronal circuits ... 4
1.2.3.1 Purkinje cells ... 4
1.2.3.2 Granule cells ... 5
1.2.3.3 Deep nuclei ... 6
1.2.3.4 Mossy fibers ... 6
1.2.4.5 Climbing fibers ... 7
x
1.3 Cerebellar Dysfunction and Ataxia ... 9
1.4 Autosomal Recessive Cerebellar Ataxias ... 10
1.5 Cerebellar Ataxia, Mental Retardation, and Disequilibrium Syndrome ... 10
1.5.1 Genetic heterogeneity ... 11
1.5.1.1 Very low-density lipoprotein receptor ... 12
1.5.1.2 Carbonic anhydrase VIII ... 16
1.5.1.3 WD repeat domain 81 ... 16
1.6 Gene Identification in Mendelian Disorders ... 18
1.6.1 Genetic mapping in autosomal recessive disorders ... 19
1.6.2 Consanguinity ... 21
1.6.3 Genetic heterogeneity ... 23
1.6.4 Targeted next generation sequencing ... 24
1.6.5 Identification of the causal mutation in CAMRQ ... 25
1.7 Subject and outline of the Thesis ... 18
2. Materials and Methods 27
2.1 Recruitment of Patients and Controls ... 27
2.2 Clinical Investigations ... 28
2.3 DNA Isolation from the Family Members ... 28
2.4 Genetic Mapping Techniques ... 29
xi
2.4.2 Homozygosity mapping analysis and haplotype construction ... 30
2.5 The Candidate Gene Approach ... 32
2.5.1 Selecting a candidate gene ... 32
2.5.2 Testing the Candidate Gene ... 33
2.5.2.1 Determination of the coding regions of the candidate genes . 33 2.5.2.2 Primer design and quality ... 33
2.5.2.3 Amplification of the coding regions ... 33
2.5.2.4 Visualization of the PCR products ... 34
2.5.2.5 Sequencing of the candidate genes ... 34
2.5.2.6 Visualization and analysis of the sequencing data ... 35
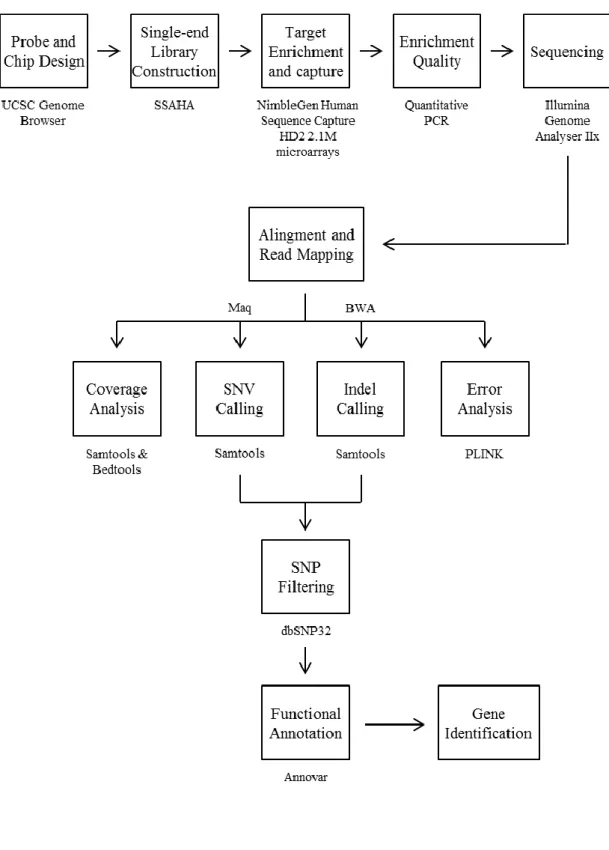
2.6 Targeted next generation sequencing analysis ... 36
2.6.1 Probe and Chip design ... 36
2.6.2 Single-end library construction and sequence capture ... 38
2.6.3 Analysis of the targeted NGS data ... 38
2.6.3.1 Alignment and read mapping ... 40
2.6.3.2 Genotype and variant calling ... 40
2.6.3.3 Fold enrichment and coverage analysis ... 41
2.6.3.4 Genotype calling error analysis ... 42
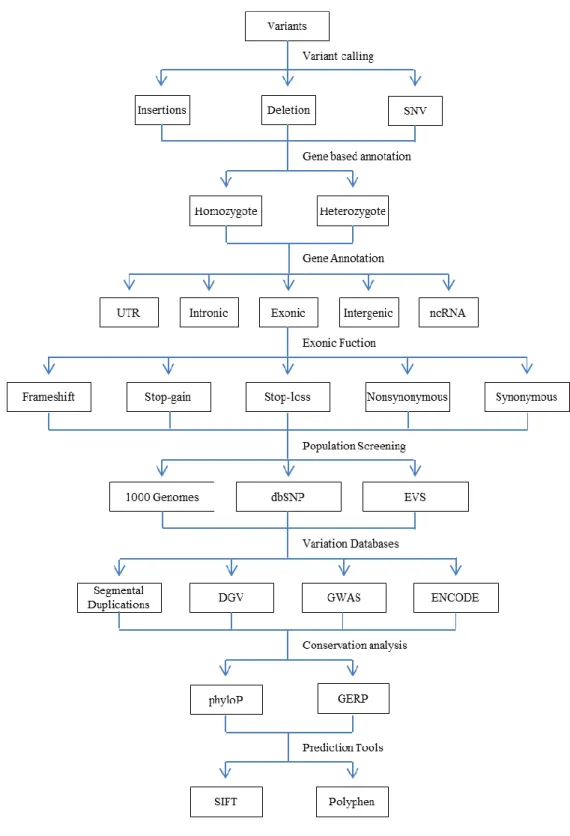
2.6.3.5 Positional and functional annotation of the variants ... 43
xii
2.7 Identification of the disease causing mutation ... 45
2.7.1 Population screening ... 46
2.7.1.1 Population datasets ... 46
2.7.1.2 Alleles specific PCR analysis ... 47
2.7.1.3 Restriction fragment length polymorphism analysis ... 47
2.7.2 Confirmation of the candidate variants ... 47
2.7.3 Segregation analysis of the candidate variants ... 48
2.8 Screening the candidate genes in neurological disease cohorts ... 48
2.9 Functional Characterization of ATP8A2 ... 49
2.9.1 Prediction tools and databases ... 49
2.9.2 Expression analysis ... 50
2.9.2.1 cDNA libraries construction ... 50
2.9.2.2 Semi-quantitative RT-PCR analysis ... 52
2.9.2.3 Real time Quantitative RT-PCR analysis ... 52
2.9.2.4 Data mining from published expression datasets ... 53
2.10 Enzymes, Chemicals, and Reagents ... 54
2.10.1 Enzymes ... 54
2.10.2 Solutions and buffers ... 55
2.10.3 Chemicals and reagents... 56
xiii
2.12 Web Sources ... 59
3. Results 60
3.1. Clinical Assessment of the Family ... 60
3.2. Genetic Mapping ... 64
3.2.1. Homozygosity mapping using Affymetrix arrays... 64
3.2.2. Candidate gene sequencing ... 65
3.2.3. Homozygosity mapping using high-resolution Illimuna arrays... 69
3.3 Targeted next generation sequencing of the homozygous regions ... 72
3.3.1 Sample Preparation ... 72
3.3.2 Capture and sequence enrichment ... 76
3.3.3 Data Analysis ... 76
3.3.3.1 Variant calling and error rates ... 76
3.3.3.2 Analysis of the low-coverage regions ... 78
3.4 Identification of the Disease-Causing Determinants ... 79
3.4.1 Genotype calling and analysis ... 83
3.4.2 SNP calling and filtering ... 83
3.4.3 Functional annotation of the novel homozygous variants ... 85
3.4.4 Population Screening ... 87
3.4.5 Exclusion of the variants ... 88
xiv
3.4.5.2 Segregation Analysis by haplotype construction ... 96
3.4.5.3 Exclusion of the APBA3 as the disease causing gene ... 102
3.4.5.4 Exclusion of the PCP2 as the disease causing gene ... 106
3.4.6 ATP8A2 p.I376M as the disease causing mutation ... 109
3.5 Characterization of ATP8A2 ... 115
3.6 Expression of ATP8A2 ... 116
3.6.1 Real time RT-PCR analysis ... 116
3.6.2 Annotation clustering of early embryonic mouse brain genes... 116
4. Discussion 122
4.1 Disease Gene Identification ... 122
4.2 Overview of Variant Filtration and Prioritization ... 124
4.3 ATP8A2 is associated with CAMRQ ... 127
4.3.1 Biochemical properties of P-type ATPases ... 127
4.3.2 Clinical phenotypes associated with P4-type ATPases ... 128
4.3.3 Clinical phenotypes associated with ATP8A2 ... 129
4.3.4 ATP8A2 p.I376M mutation ... 131
4.3.5 Expression of ATP8A2 ... 132
4.3.6 Association with other CAMRQ genes... 133
xv 5. Future Perspectives 136 6. References 138 7. Appendices 154 Appendix A ... 155 Appendix B ... 162 Appendix C ... 170 Appendix D ... 174 Appendix E ... 176 8. Publications 18107
xvi
List of Figures
1.1 Schematic representation of the major functional and anatomical divisions
of the cerebellum ... 5
1.2 Neuronal circuits and cellular components of the cerebellum ... 8
1.3 Genetic heterogeneity in CAMRQ ... 13
1.4 Pedigree of the Family A ... 15
1.5 Pedigree of the Family D ... 15
1.6 Pedigree of the Family B... 17
1.7 Schematic representation of the gene identification in Mendelian diseases .... 20
1.8 Homozygosity mapping of recessive disease genes... 22
1.9 Prevalence of the consanguineous marriages in the world ... 24
2.1 DNA Markers used in the study ... 35
xvii
2.3 Representation of the library construction and sequence capture ... 39
2.4 Algorithm of the ANNOVAR annotation pipeline ... 44
3.1 Family pedigree of the affected individuals ... 62
3.2 Quadrupedal walking of patients ... 63
3.3 Standing postures of the quadrupedal and bipedal ataxic man ... 64
3.4 Homozygosity mapping analysis using Affymetrix arrays ... 65
3.5 Homozygosity mapping analysis using high-resolution Illimuna arrays ... 70
3.6 Comparison of the Affymetrix and Illimuna arrays………....71
3.7 Density measurements using agarose gel electrophoresis ... 73
3.8 Linear regression graph of PicoGreen assay ... 75
3.9 Graphical representation of the coverage analysis of the NGS data ... 80
3.10 Schematic representation of the disease-causing gene identification method . 82 3.11 Functional annotation of the novel homozygous coding variants ... 87
3.12 Schematical representation of the analysis, annotation, and exclusion of the genetic variants ... 90
3.13 Haplotype structure of the disease interval on chromosome 13q12 ... 97
3.14 Haplotype structure of homozygous region on chromosome 19 ... 98
3.15 Haplotype structure of homozygous region on chromosome 20 ... 99
xviii
3.17 Amino acid sequence homology of the APBA3 protein ... 103
3.18 Conservation analysis of the APBA3 protein ... 104
3.19 The PSIPRED protein secondary structure prediction of APBA3 ... 105
3.20 Pfam domain analysis of the APBA3 ... 105
3.21 Confirmation of the PCP2 p.E2del variant by Sanger sequencing ... 107
3.22 Amino acid sequence homology of the PCP2 protein ... 108
3.23 Conservation analysis of the PCP2 protein ... 108
3.24 Graphical representation of the predicted functional and structural elements of ATP8A2 protein ... 109
3.25 The secondary protein structures of the wild-type and mutant ATP8A2... 111
3.26 Multiple amino acid sequence alignments of ATP8A2 protein ... 112
3.27 Conservation analysis of the ATP8A2 protein... 113
3.28 Phylogenetic tree analysis of multiple sequence alignments of ATP8A2 ... 113
3.29 Expression profiles of ATP8A2 in multiple human tissues ... 117
3.30 Real-time expression profiles of ATP8A2 in multiple human tissues ... 117
3.31 Real-time expression profiles of ATP8A2 in different human brain regions... 118
3.32 Schematic representation of the functional annotation clustering ... 119
3.33 Graphical representation of the expression profiles of the filtered differentially expressed genes within day groups…...120
xix
List of Tables
1.1 Classification of the most common autosomal recessive ataxia syndromes .... 11
1.2 Clinical characteristics of the families with VLDLR deficiency ... 14
1.3 Clinical characteristics of the family with WDR81 deficiency. ... 18
2.1 Databases used to evaluate novel homozygous protein altering candidate variants ... 51
2.2 Enzymes used in the experiments ... 54
2.3 Solutions and buffers used in the experiment ... 55
2.4 Reagents and chemicals used in the experiment ... 56
2.5 Accession codes and locations of the ortholog sequences of the candidate genes ... 57
xx
3.1 Physical, radiological, and genetic characteristics of the patients. ... 61
3.2 Shared homozygous regions of Affymetrix 250K data ... 66
3.3 Genes located on the 13q candidate homozygous region ... 67
3.4 Gene prioritization using GeneWanderer... 68
3.5 Statistics of the sequencing results of the 13q region ... 69
3.6 Shared homozygous regions of Illimuna arrays ... 70
3.7 DNA concentrations as a result of densitometric measurements ... 73
3.8 DNA concentrations as a result of spectrophotometric measurements ... 74
3.9 DNA concentrations as a result of PicoGreen analysis ... 74
3.10 Average concentrations of samples of PicoGreen measurements ... 75
3.11 Statistics of targeted next generation sequence data ... 77
3.12 Coverage analysis of the next generation sequencing data ... 79
3.13 List of genes corresponding to low and zero coverage regions ... 81
3.14 Statistics of the genetic variants after base calling and positional annotations ... 84
3.15 Statistics of the novel genetic variants filtered by using dbSNP32 database .. 86
3.16 Novel homozygous protein altering variants at the targeted region ... 89
3.17 Database annotation of the novel homozygous protein altering variants ... 91
xxi
3.19 Novel coding variants identified by targeted next-generation sequencing
of 05-996 ... 101
3.20 Locations and orientations of the predicted transmembrane helices of ATP8A2 ... 110
3.21 Mutation screening of ATP8A2 p.I376M in isolated cases, healthy controls, patients with non-neurological phenotypes and databases. ... 115
3.22 Transcripts of ATP8A2 according to Ensembl database ... 115
3.23 Genes associated with human diseases which are co-expressed with Atp8a2 ... 121
4.1 Clinical phenotypes associated with P4-type ATPases ... 130
A.1 Primers for candidate gene sequencing ... 155
A.2 Sanger sequencing primers for segregation analysis of protein altering variants ... 160
A.3 AS-PCR primers for population screening ... 161
A.4 Real time RT-PCR primers expression analysis ... 161
A.5 STR markers for haplotype construction of chromosome 13q12 ... 161
B.1 Full list of the candidate genes located at the shared homozygous regions . 162 C.1 Full list of novel homozygous variants at the homozygous regions ... 170
D.1 Exons of longest transcript of ATP8A2 isoform 1 ... 174
E.1 DAVID analysis to determine enrichment for genes whose expression profiles correlated with ATP8A2 ... 176
xxii
Abbreviations
ACTB Beta-Actin
ALFRED The Allele Frequency Database
APBA3 Amyloid Beta (A4) Precursor Protein-Binding, Family A, Member 3
APOER2 Apolipoprotein E Receptor 2
APTX Aprataxin
AS-PCR Allele Specific PCR
ATM Ataxia Telangiectasia Mutated
ATP12A Atpase, Na+/K+ Transporting, Alpha Polypeptide-Like 1 ATP8A2 Atpase, Class I, Type 8a, Member 2
BRIC Benign Recurrent Intrahepatic Cholestasis Type 1
BWA Burrows-Wheeler Aligner
BWT Burrows-Wheeler Transform
CA8 Carbonic Anhydrase VIII
CAMRQ Cerebellar Ataxia, Mental Retardation, and Disequilibrium Syndrome
CCAS Cerebellar Cognitive Affective Syndrome CENPJ Centromeric Protein J
CGAP-GAI Cancer Genome Anatomy Project-Genetic Annotation Initiative
CNS Central Nervous System
CT Computed Tomography
DAB1 Disabled, Drosophila, Homolog of 1
DAVID Database for Annotation, Visualization and Integrated Discovery
xxiii
DCX Doublecortin
DES-H Disequilibrium Syndrome
DGV Database of Genomic Variants
EtBr Ethidium Bromide
EVS Exome Sequencing Project
F-SNP Functional SNPs
FXN Frataxin
GA Genome Analyzer
GAPDH Glyceraldehyde 3-Phosphate Dehydrogenase
GEO Gene Expression Omnibus
GERP Genomic Evolutionary Rate Profiling
GO Gene Ontology
GWAS Genome-Wide Association
HAD Haloacid Dehalogenase-Like Hydrolase
HMMs Hidden Markov Models
HOPE Have yOur Protein Explained
IGV Integrative Genomics Viewer
ILOCA Idiopathic Late Onset Cerebellar Ataxia IP3 Inositol 1,4,5-Triphosphate
IRB Institutional Review Boards
ITPR1 Inositol 1,4,5-Triphosphate Receptor, Type 1 indel Insertion and Deletion
JAX KO The Jackson Laboratory Knock-Out
JSNP Japanese SNP
KEGG Kyoto Encyclopedia of Genes and Genome
LD Linkage Disequilibrium
LIS2 Lissencephaly 2
LISX1 Lissencephaly, X-Linked
MAF Minor Allele Frequency
Maq Mapping And Assembly with Qualities
MGI Mouse Genome Informatics
MIM Mendelian Inheritance Of Man
MMSE Mini Mental State Examination
xxiv
MSA Multiple System Atrophy
MTMR6 Myotubularin-related Protein 6
NGS Next Generation Sequencing
NHGRI National Human Genome Research Institute
NUPL1 Nucleoporin-like 1
OMIM Online Mendelian Inheritance in Man PCP2 Purkinje Cell Protein-2
PFIC1 Progressive Familial Intrahepatic Cholestasis Type 1 phyloP Phylogenetic p-Value
PNS Peripheral Nervous System
POLG Polymerase Gamma
QRT- PCR Real-Time Quantitative RT-PCR
RELN Reelin
RFLP Restriction Fragment Length Polymorphism
SACS Sacsin
SAMtools Sequence Alignment/Map Tools SCA15 Spinocerebellar Ataxia 15
SETX Senataxin
SNP Single Nucleotide Polymorphism SNV Single Nucleotide Variants
SSAHA Sequence Search and Alignment Hashing Algorithm
STRs Short Tandem Repeats
TDE1 Tumor Differentially Expressed
Tm Melting Temperatures
TMpred Web-based Transmembrane Prediction UniProt Universal Protein Resource
UPGMA Unweighted Pair Group Method With Arithmetic Mean
UTRs Untranslated Regions
VLDLR Very Low-Density Lipoprotein Receptor
1
Chapter 1
Introduction
1.1 Quadrupedal Locomotion in Humans
Quadrupedalism is the form of locomotion of the majority of vertebrates and mammals. It uses limbs and legs. Bipedalism is the fundamental adaptation of hominids which separate them from other primates. However, bipedal gait including long-distance walking and running is one of the key characteristics of humans.[1-3] Actually, humans begin life with crawling on all fours but do not retain quadrupedal gait and continue life with up-right posture.[2, 4] The origin of human bipedalism is still on debate since its genetic background is poorly understood, but a century of research of fossil and comparative anatomy studies give valuable information about the development of the bipedal locomotion.[1-6]
Bipedal walking in humans is controlled by central nervous system which transmits the signals to peripheral nervous system.[7] Detailed functional analysis of the brain regions revealed that cerebellum, cerebral cortex, occipital cortex, and basal ganglia are the crucial parts in controlling locomotion.[8] Especially, recent studies on
2
cerebellar disorders revealed that cerebellum has a particular role in controlling motor movements and balance in humans.[9, 10]
1.2 Cerebellum and Motor Coordinates
1.2.1 Function of the cerebellum
The cerebellum is a brain region involved in motor control. Lesions in cerebellum are associated with loss of coordination (asynergia), drunk-like movement (ataxia), inability to perform rapid movements (adiadochokinesia), poor articulation (dysarthria), movement tremors (intention tremor), inability to decide when to stop (dysmetria), weak muscle tone (hypotonia), and abnormal eye movement (nystagmus).[11]
The role of cerebellum in cognitive functions such as articulation, emotion, and mental behavior has not been elucidated yet. The evidence underlying the causes of the cognitive function of the cerebellum comes from the anatomical investigations, clinical manifestation of the cerebellar disorders, and functional neuroimaging approaches, but genetic evidence is still missing.[12] Recent improvements in brain imaging techniques, genetics, and mouse genomics have provided identification of many genes involved in cerebellar malformations which in turn provided information about the function of the cerebellum.[13]
The strongest clues about the function of the cerebellum have come from animals and humans with cerebellar dysfunction. The essential role of the cerebellum is the coordinating motor movements such as typing, running, and talking. Patients with completely damaged or loss of the cerebellum continue to generate motor movements but they loses precision, coordination, and accurate timing.[14]
3
The cerebellum functionally locates between the central nervous system (CNS) and peripheral nervous system (PNS). The PNS connects the CNS with the rest of the body by network of nerves. The input signals from the sensory organs unite with the input signals from the motor pathways.[15] These inputs transmitted to the CNS via sensory pathways and to muscles and glands via motor pathways. The signals from various parts of the spinal cord and brain integrated to the cerebellum via spinal and cranial nerves, respectively. Cerebellum analyzes these inputs, corrects mismatches between predicted and actual movements, calculates timing, and decides the action quickly.[16] These predictions are learnt according to past experiences which is called motor learning.[17] There are some evidence that the cerebellum participates in some types of motor learning with basal ganglia and cerebral cortex.[18] Cerebellum also helps to motor cortex in planning the next movement while controlling a motor movement.[19]
1.2.2 Anatomy of the cerebellum and pathology characteristics
The cerebellum constitutes 10% of the total volume of the brain locating at the bottom between the cerebral cortex and pons which is the part of brainstem.[20] It is separated from the cerebrum by a layer called dura mater. More than half of all neurons reside at the cerebellum with a regular repeating manner because of the presence of the granule cells. Cerebellum is divided into several distinct regions (Figure 1.1). First, it is divided into two hemispheres each of which divided into intermediate and lateral regions where vermis located at the middle line. According to its standing position, cerebellum classified in three regions: the anterior (front), posterior (behind) , and flocculonoduler lobes.[21]
The volume of the cerebellum is occupied by gray matter, also called the cerebral cortex at the outside, the internal white matter, and the deep nuclei. The gray and white matters are made up myelinated nerve fibers and the deep nucleus is composed of branched nerve bodies. The cerebellar output originates from the deep nuclei and is transmitted to white and gray matter.[22]
4
The cerebellum coordinates motor functions at three levels: vestibulocerebellum, spinocerebellum, and cerebrocerebellum (Figure 1.1). Vestibulocerebellum consist of flocculonoduler lobes and a small portion of the vermis. Evolutionary it is the oldest part of the cerebellum. This region plays a role in the coordination of the balance of the movements with the help of vestibular system and also in the eye movements.[22] The spinocerebellum composed of most portions of the vermis and medial zone of the anterior and posterior lobes. This region involves in the coordination of the movements at the distal part of the body, especially hands and fingers. It receives input signals from the spinal cord, visual and auditory systems and transmits these signals to the cerebral cortex and brainstem. The cerebrocerebellum is the largest functional part including the both hemispheres and it provides connection with the cerebral motor cortex and cerebrum. The input signals from the motor and sensory pathways are received by cerebrocerebellum and the output signals are transmitted back to the ventrolateral thalamus and red nuclei where the cerebellum functions in the planning and coordination of the sequential voluntary movements.[19, 20]
1.2.3 Cellular components of the cerebellum and neuronal circuits
At cellular level cerebellum composed of three types of neuronal cells which are Purkinje, granule and deep nuclei cells and three types of axon fibers which are mossy, climbing and parallel fibers.
1.2.3.1 Purkinje cells
Purkinje cells are evolutionary the earliest cell types and are packed in the cerebral cortex, called Purkinje layer. These cells are one of the largest neurons in the human brain composed of dendritic bodies which are branched perpendicular to the cerebellar folds. These dendrites receive signals from the fibers which then travel into the deep cerebellar nuclei via axons.[23]
5
Figure 1.1: Schematic representation of the major functional and anatomical divisions of the cerebellum
Purkinje cells are at the heart of cerebellar circuits connected with two layers. The dendrites of the Purkinje cells reach to the cerebellar nuclei through parallel fibers and to the inferior olivary nucleus through climbing fibers. They send inhibitory (GABAergic) signals to the deep nuclei to provide motor coordination in the cerebral cortex.[23]
1.2.3.2 Granule cells
Granule cells are the smallest but the most numerous neurons in the brain. They account for the half of the neurons in the CNS. These cells are packed at the bottom of
6
the cerebral cortex forming the dendritic claw. These dendritic claws receive excitatory signals from the mossy fibers originating at the pontei nuclei and inhibitory signals from the Golgi cells. The axons of the granule cells reach to the upper layer of the cerebral cortex and split into parallel fibers through dendritic bodies of the Purkinje cells. At this level, granule cells and the Purkinje cells contact each other at every 3-5 parallel fibers forming synapses using glutamate as a neurotransmitter so it is excitatory.[22] These parallel fibers of the granule cells fire synchronization which results in the only excitatory signals present in the cortex. The synapse between Purkinje cells and granule cells has a role in motor learning.[24]
1.2.3.3 Deep nuclei
The deep nucleus is the center of the output signals from the cerebellum that resides at the core region within the gray matter. It consists of three nuclei: dentate nucleus communicates with the lateral parts of the cerebellar cortex; interpositus and fastigial nuclei communicate with the spinocerebellum. The neurons at the deep nuclei have large cell bodies and dendrites. Most of them use glutamate neurotransmitter which target several regions outside the cerebellum. A little portion of the neurons use GABA neurotransmitter and target the olivary nucleus which is the source of climbing fibers.[21]
The deep nuclei always receive excitatory signals from mossy and climbing fiber pathways and inhibitory signals from Purkinje cells in the cerebellar cortex. The deep nuclei inhibited by the Purkinje cells when the motor cortex is activated after a short delay with a negative feedback signal which prevent the overreaction and oscillation of the muscles.[23]
1.2.3.4 Mossy fibers
Mossy fibers are the major inputs to the cerebellum. They originate from many regions: most of them from pontei nuclei of the cerebral cortex and remaining fibers from vestibular nuclei, spinal cord, reticular formation, and the deep nuclei. These
7
fibers make synapses with the dendritic claws of the granule cells at the deep nuclei forming fiber rosettes within the structures called glomeruli. Mossy fibers function in the sensory pathway by transmitting the information from pontine nuclei to the granule cells, which is then transmitted to the Purkinje cells through the parallel fibers.[23]
1.2.3.5 Climbing fibers
Climbing fibers are the neuronal projections that transmit signals from inferior olivary nucleus to the brainstem. A climbing fiber emerging from the olivary nucleus passes through pons and enters the cerebellum. Then it forms synapses with the deep cerebellar nuclei and Purkinje cells. During the development of the cerebellum the Purkinje cells are surrounded by several climbing fibers which are then eliminated as the cerebellum matures resulting in a single powerful climbing fiber. In this way they function in the motor coordination, especially in timing.[23]
1.2.3.6 Neuronal circuits of the cerebellum
In summary, Purkinje cells and the deep nuclei are the major functional units of the cerebellum. They receive input signals from motor and sensory pathways. Motor signals activate deep nuclei which adjust the movement by increasing and decreasing the signal. The sensory signals activated with the movement and the resulting output signals reach the Purkinje cells and are corrected if wrong by negative feedback (Figure 1.2).
The cerebellum receives input motor signals from several parts of the brain using four tracts: the corticopontocerebella, olivocerebellar, vestibulocerebellar, and reticulocerebellar tracts. The sensory signals from the peripheral body regions enter to the cerebellum by using dorsal and ventral spinocerebellar tracts. These spinocerebellar tracts are the ones where the most rapid signal conduction since rapid cerebellar response to rapid muscle movements occurs via these tracts.
8
9
1.3 Cerebellar Dysfunction and Ataxia
There are several diseases involving dysfunction of the cerebellum and producing ataxia. The clinical symptoms of the ataxic motor syndromes involve body disequilibrium, uncoordinated movement, tremor, dysarthria, extremity and eye movements. A small proportion of the diseases with cerebellar lesion do not result in ataxia. Patients with the cerebellar cognitive affective syndrome (CCAS) have defects in executive, visual, and linguistic abilities.[25]
The lesions on the different regions of the cerebellum have distinct consequences. Patients with cerebellar lesions without any damage to the central core of the cerebellum, which is called deep nuclei, can still perform motor functions but in slow rate. [21] The dysfunction of the vestibulocerebellum results in impairment in the balance and the eye control. The dysfunction of the spinocerebellum including vermis results in truncal ataxia which is drunk-like movement. The dysfunction of the cerebrocerebellum results in appendicular ataxia which is the inability to achieve voluntary and planned movements. These patients represent intention tremor, dysarthria, dysdiadochokinesia, and dysmetria.[25]
The cerebellar ataxias are a very diverse group of disorders according to the clinical representation and causes. The ataxic disorders caused by cerebellar dysfunction divided into three groups. First group involves acquired ataxias which are mostly caused by stroke, trauma, and intoxication such as alcohol induced degeneration, radiation poisoning, and vitamin B12 deficiency.[26] The second group is degenerative ataxias, which are caused by de novo mutations, including idiopathic late onset cerebellar ataxia (ILOCA) and multiple system atrophy (MSA).[27] The last group consists of the hereditary ataxias caused by genetic mutations segregated in the family with Mendelian inheritance. Hereditary ataxias include autosomal dominant cerebellar ataxias such as episodic ataxias and spinocerebellar ataxias; autosomal recessive cerebellar ataxias such as Friedreich’s ataxia, ataxia telangiectasia, and
10
Niemann Pick disease; and X-linked cerebellar ataxias such as fragile X-associated tremor/ataxia syndrome.[26]
The genetic ataxias are both genetically and phenotypically heterogeneous where they can be caused by mutations in several different genes or different mutations in the same gene can cause different phenotypes.[26]
1.4 Autosomal Recessive Cerebellar Ataxias
Autosomal recessive cerebellar ataxias are neurodegenerative diseases. Most of them are heterogeneous with respect to age of onset, severity, and the frequency of the disease. They are associated with both CNS and PNS. Several autosomal recessive cerebellar ataxia disorders may have the same phenotype, whereas mutations in the same genes may lead to distinct phenotype such as frataxin (FXN), polymerase gamma (POLG), aprataxin (APTX), ataxia telangiectasia (ATM) or senataxin (SETX).[10] Therefore, the clinical classification is still remains controversial.
Palau and Espinos classified autosomal recessive cerebellar ataxias in four groups depending on the molecular mechanism as congenital and developmental ataxias, metabolic ataxias, , degenerative and progressive ataxias, ataxias due to DNA repair defects.[9] The examples of these subgroups are described in Table 1.1
1.5 Cerebellar Ataxia, Mental Retardation, and Disequilibrium
Syndrome
Cerebellar ataxia, mental retardation, and disequilibrium syndrome (CAMRQ) is a genetically heterogeneous disorder characterized by cerebellar atrophy, mental retardation, dysarthric speech, and hypotonia with or without quadrupedal gait.
11
Table 1.1: Classification of the most common autosomal recessive ataxia syndromes. Adopted from Palau and Espinós (2006).[9]
Classification Gene Locus
Congenital ataxias
Joubert syndrome JBTS4 NPHP1 2q13
Cayman ataxia ATCAY 19p13.3
Metabolic ataxias
Ataxia with isolated vitamin E deficiency α-TTP 8q13
Refsum disease PhyH 10pter-p11.2
DNA repair defects
Spinocerebellar ataxia with axonal neuropathy TDP1 14q31 Ataxia with oculomotor apraxia 1 APTX 9p13
Ataxia telangiectasia ATM 11q22.3
Xeroderma Pigmentosum A XPA 9q22.3
Degenerative ataxias
Infantile onset spinocerebellar ataxia C10orf2 10q22.3-q24.1 Charlevoix-Saguenay spastic ataxia SACS 13q12
Friedreich’s ataxia FXN 9q13
Marinesco-Sjögren syndrome SIL1 5q32
1.5.1 Genetic heterogeneity
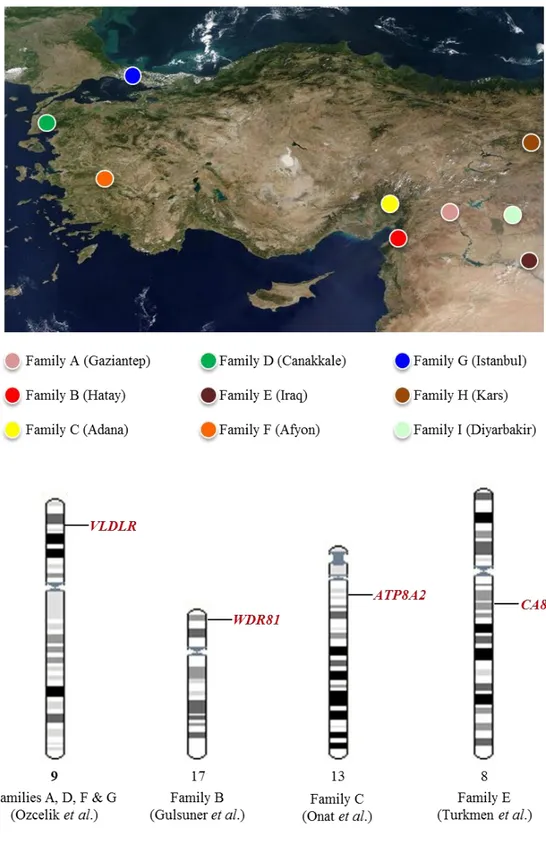
This form of ataxia is first described by Tan in a large consanguineous family in Turkey.[28] Since then multiple consanguineous families with CAMRQ syndrome with autosomal recessive inheritance have been reported. Genetic analysis revealed a genetically heterogeneous condition (Figure 1.3).
The first locus of CAMRQ was mapped on the locus 17p13 and a missense mutation was reported on WDR81 (WD repeat domain 81) [CAMRQ2; MIM: 610185; also referred to as Uner Tan syndrome].[29-31] VLDLR (very low-density lipoprotein receptor) is the first gene identified as a cause of CAMRQ syndrome [CAMRQ1;
12
MIM: 224050] by using linkage mapping followed by candidate gene sequencing.[31-34] Furthermore, CA8 (Carbonic anhydrase VIII) gene [CAMRQ3; MIM: 613227] identified in another consanguineous family using the same methodology.[35]
1.5.1.1 Very low-density lipoprotein receptor
VLDLR has a role in the neural positioning in the cortical brain and neuronal migration by forming complex with reelin (RELN), apolipoprotein E receptor 2 (APOER2), and the adaptor protein, disabled, drosophila, homolog of 1 (DAB1) [36], which regulates Purkinje cell alignment in the cerebellum.[37] RELN is responsible for Lissencephaly 2 which is associated with cerebellum, hippocampus, and brainstem abnormalities [LIS2; MIM: 257320].[38] Mice knock-outs of reelin represent ataxic gait and trembling [38], whereas mice knock-outs of VLDLR appear normal with small cerebellum.[36]
In humans VLDR is first identified in the North American Hutterite population as a cause of Disequilibrium syndrome [DES-H, MIM: 224050] with truncal ataxia, mental retardation, delayed ambulation, and cerebral gyral simplification (Table 1.2).[39] However, none of the disequilibrium syndromes including DES-H have been characterized with quadrupedal gait in the literature.[32] VLDLR is the first gene reported by our group as responsible for CAMRQ1 with quadrupedal locomotion in two unrelated consanguineous Turkish families. During the course, two additional families with CAMRQ1 with VLDLR mutation identified (Figure 1.3).
Family A is a consanguineous family from southeastern Turkey with seven affected individuals (Figure 1.4) and Family D is another consanguineous family from western Turkey with three affected individuals (Figure 1.5).[32, 40] Family A and D have distinct clinical characteristics (Table 1.2). Genome wide linkage analysis in the family linked the disease locus at chromosomal locus 9p24.2. Following candidate gene sequencing identified a nonsense mutation (p.R257X) and a single nucleotide deletion (c.2339delT) in VLDLR gene in Family A and D, respectively.[32]
13
Figure 1.3: Genetic heterogeneity in CAMRQ. Four different loci identified in seven families with CAMRQ, so far. The candidate gene research furthers for two more families (represented on top). The genes carrying the causal mutations were shown at the bottom.
14
Table 1.2: Clinical characteristics of the families with VLDLR deficiency
Family A Family D DES-H
Locus 9p24 9p24 9p24
Gene VLDLR VLDLR VLDLR
Gait Quadrupedal Quadrupedal Bipedal
Mental retardation Profound Profound Moderate to profound
Inferior cerebellum Hypoplasia Hypoplasia Hypoplasia
Hypotonia Absent Absent Present
Speech Dysarthric Dysarthric Dysarthric
Corpus callosum Normal Normal Normal
Barany caloric nystagmus Normal Not done Not done
Tremor Very Present Absent
Cortical gyri Mild simplification Mild simplification Mild simplification
Ambulation Delayed Delayed Delayed
Inferior vermis Absent Absent Absent
Seizures Very rare Absent Various degree
Strabismus Present Present Present
Truncal ataxia Severe Severe Severe
Upper extremity reflexes Vivid Vivid Vivid
Lower leg reflexes Hyperactive Hyperactive Hyperactive
Pes-planus Present Present Present
Furthermore, in recent studies, VLDLR was found to be associated with very similar phenotypes. Another consanguineous family from Iran with eight affected individuals with a homozygous truncating mutation in the VLDLR gene (p.R448X) represents a phenotype with cerebellar ataxia, disturbed equilibrium, strabismus, and short stature.[33] In addition, a 21-kb long homozygous deletion in the VLDR gene is reported in unrelated consanguineous Turkish family with two affected sibs who had delayed psychomotor development, cerebellar atrophy, speech delay, severely ataxic bipedal gait, dysarthria, dysmetria, dysdiadochokinesis, and hyperreflexia.[34]
15
Figure 1.4: Pedigree of the Family A. Seven individuals in the consanguineous Turkish family are affected by CAMRQ1.
Figure 1.5: Pedigree of the Family D. Three individuals in the consanguineous Turkish family are affected by CAMRQ1.
16 1.5.1.2 Carbonic anhydrase VIII
CA8 gene encodes carbonic anhydrase VIII which binds to inositol 1,4,5-triphosphate (IP3) receptor, type 1 (ITPR1). Mutations in the ITPR1 is responsible for autosomal dominant spinocerebellar ataxia 15 [SCA15; MIM 606658] in humans.[41] CA8 inhibits binding of IP3 to ITPR1 which inhibits calcium release from the endoplasmic reticulum.[42] Mice deficient with both Ip3r1 and Ca8 represents ataxia but not cerebellar atrophy.[43]
In humans, homozygous mutation (S100P) in CA8 gene detected by genome-wide linkage analysis and following candidate gene sequencing reported as the cause of CAMRQ3 in a consanguineous Iraqi family with four affected sibs. All of the patients represent quadrupedal gait, ataxia and mild mental retardation.[35] Another missense mutation in CA8 was detected by using homozygosity mapping followed by exon sequencing in an unrelated consanguineous family with CAMRQ3 in four affected individuals.[44]
1.5.1.3 WD repeat domain 81
Family B is the first consanguineous family in the literature with quadrupedal gait (Figure 1.6). The family lives in the southeastern Turkey and consists of six affected sibs with cerebellar hypoplasia, dysarthric speech, mental retardation, truncal ataxia and quadrupedal locomotion (Table 1.3).[28]
The disease locus was mapped to chromosomal region 17p13 by linkage analysis [32]. Homozygosity mapping of the affected individuals broaden the region and following targeted next generation sequencing revealed a homozygous missense mutation (p.P856L) at WDR81 gene segregated with the autosomal recessive inheritance of the family.[29] The analysis of multiple brain regions of the affected individuals using Magnetic Resonance Imaging (MRI) revealed cerebellar atrophy and abnormalities in corpus callosum, precentral gyrus, and Brodmann areas.[29]
17
Figure 1.6: Pedigree of the Family B. Six of the 19 sibs of a first cousin marriage are affected by CAMRQ2.
WDR81 was a predicted uncharacterized gene with unknown function. In a very recent study, Gulsuner et al. (2011) stated that the WDR81 encodes a uncharacterized protein which is predicted to be a membrane-spaning transmembrane protein with six domains.[29] WDR81 expression is analyzed in different parts of the brain regions and the highest level of expression is detected in the cerebellum and corpus callosum. Analysis of the expression profiles of the mouse embryos using published expression datasets revealed that mouse Wdr81 is detected at the Purkinje cells in the cerebellum. Functional clustering analysis of the genes which are coexpressed with the Wdr81 revealed that these genes are especieally enriched in neurodevelopmental processes including neuronal differentiation, axonogenesis, and cell morphogenesis.[29] This suggested a role of WDR81 in nervous system development.
18
Table 1.3: Clinical characteristics of the family with WDR81 deficiency. Family B
Locus 17p13
Gene WDR81
Gait Quadrupedal
Mental retardation Severe to profound
Inferior cerebellum Hypoplasia
Hypotonia Absent
Speech Dysarthric
Corpus callosum Reduced
Ambulation Delayed
Truncal ataxia Severe
Upper extremity reflexes Vivid
Tremor rare
Pes-planus Present
Strabismus Present
Seizures Rare
Barany caloric nystagmus Cvs defect
Lower leg reflexes Hyperactive
Inferior vermis Absent
Cortical gyri Mild simplification
1.6 Gene Identification in Mendelian Disorders
The human genome consists of thousands of genes and finding a particular gene responsible for a given phenotype is literally defined as “needles in stacks of needles”.[45] Traditionally, disease gene identification begins with family-based linkage analysis. However, this analysis has difficulties in identifying disease causing de novo mutations. This problem was overcome with the development of high-resolution microarrays for Genome-Wide Association (GWAS) and Next Generation Sequencing (NGS) technologies and as a consequence, family-based linkage studies in Mendelian disorders have become the focus of genetic studies.[46]
19
Over the past decade, association studies in large cohorts with cases and controls using genome-wide single nucleotide polymorphism (SNP) microarrays were used to identify common risk factors in common diseases. However, association studies had weaknesses in identifying rare disease causing mutations through linkage disequilibrium (LD) with common SNPs.[47] Family-based linkage analysis using genome-wide SNP microarrays made it possible to identify genetic loci that encompass the rare variants. This approach using genome-wide SNP microarrays also contributed to overcome population stratification and heterogeneity problems.[48] Thus, combination of next generation sequencing technology with family-based linkage analysis become the most powerful and robust approach to identify disease causing rare variants (Figure 1.7).[49]
1.6.1 Genetic mapping in autosomal recessive disorders
Identification of familial disorder with autosomal recessive inheritance pattern is the first step in understanding the pathobiological events and certain pathways underlying the disease. The most commonly used method to map the disease causing loci in autosomal recessive case is the linkage analysis. Linkage analysis is suitable when a family with multiple generations including multiple affected and unaffected individuals is found. Under these circumstances, the disease loci can be detected by genotyping certain markers, which are genetically variable, in the family.[50]
However, the disease locus identification is not this simple in every case. The most important limitation is the number of the genetic markers surrounding the locus, which is recently overcome with the use of high-throughput genome-wide SNP genotyping arrays. With the use of this technology thousands to millions of SNPs can be genotyped in many individuals at one step. The disease causing locus can be identified by determining which alleles were present only in affected individuals in large families.[49]
20
Figure 1.7: Schematic representation of the gene identification in Mendelian diseases. The methods used to identify the causal genes responsible for autosomal recessive disorders are represented. In this study homozygosity mapping and next generation sequencing is used to identify disease causing genes.
21
Most often families with multiple affected and unaffected individuals can not be obtained so mapping of gene locus involved in rare autosomal recessive disorders would be a difficult task. In such cases, homozygosity mapping analysis using genome-wide SNP arrays is the best way to identify disease locus. Homozygosity mapping is the detection of the regions which would probably be homozygous only in patients because of the presence of the homozygous mutation inherited from each parent (Figure 1.8). One of the overlapping homozygous blocks in the genomes of the each patient should contain the disease causing mutation. This procedure can give information in families with two or three affected individuals from the same kindred.[51] These homozygous intervals can be searched for disease causing gene by conventional Sanger sequencing.
The rate limiting step of the identification of the disease causing gene using homozygosity mapping is the total length of the intervals determined by the analysis. These regions can be several megabases long and can contain several genes. At these circumstances Sanger sequencing of the entire genes would be time consuming and expensive. Bioinformatics approaches try to prioritize the candidate genes at the intervals by their probability of involvement in a disease phenotype using functional predictions and online databases. However, this is not applicable when the functional information or characterization of a protein is absent or hypothetical genes present at the locus. With the advent of targeted capture of the determined homozygous regions and next generation sequencing technology, it is now possible to search the regions at single nucleotide resolution.[52-54]
1.6.2 Consanguinity
Homozygosity mapping is an efficient method when searching for a mutation segregating within a small and closed population with a small gene pool due to founder effect. In such a population the mutation would probably come from each carrier parent by segregating on the same haplotype. Co-efficiency of inbreeding increases with the
22
Figure 1.8: Homozygosity mapping of recessive disease genes. Rare mutations can be identified in autosomal recessive disorders in consanguineous families based on the fact that, the disease locus will not have tendency to recombine and will be identical by decent. So it is likely that these regions contain the disease gene.
23
level of consanguinity. Thus, homozygosity mapping is the most robust technique in consanguineous families with autosomal recessive disorders.
Homozygosity mapping method depends on the fact that the regions adjacent to the disease causing mutation will be identical in affected individuals coming from a common ancestor in an inbred family. Percentage of homozygous regions, also called as inbreeding coefficient, of the siblings in consanguineous families, differs from 0.4 to 12.5% depending on the degree of consanguinity.[55]
At the randomly mated populations the occurrence of a recessive disease is proportional to the square of disease allele frequency. The rate of consanguineous marriages increases in the southern and eastern rims of the Mediterranean basin (Figure 1.9). In some regions such as Saudi Arabia and Pakistan, the consanguinity rate reaches to 50% of the population. At such regions the occurrence of the recessive diseases is directly proportional to the disease allele frequency.[56]
1.6.3 Genetic heterogeneity
A Mendelian genetic disorder caused by more than a single gene or allele is defined as genetically heterogeneous. The increased usage of the next generation sequencing technologies revealed that Mendelian disorders with genetic heterogeneity is far greater than expected.[57]
As a result of next generation sequencing experiments, millions of variants with no phenotypic effect were identified whereas individually rare mutations with deleterious effect were at very small proportional. These rare deleterious mutations were implicated in several genetically heterogeneous Mendelian disorders and also in common diseases such as breast cancer [58], inherited hearing loss [59], autism and schizophrenia.[60, 61]
24
Figure 1.9: Prevalence of the consanguineous marriages in the world. Consanguinity increases at the southern and eastern rims of the Mediterranean basin. (Copyright © 2009, National Academy of Sciences. From Bittles et al., 2010 with permission]
1.6.4 Targeted next generation sequencing
Disease gene identification studies in consanguineous families with genetically heterogeneous autosomal recessive diseases were greatly improved with the combined use of homozygosity mapping, target-enrichment, and next generation sequencing. Such a sequencing reaction could generate thousands of genetic variations including structural variations, single nucleotide variants (SNVs), and small insertions or deletions (indels). More than 95% of these variants would be phenotypically neutral and identified in healthy populations. The critical point here is the identification of the causal mutation among the remaining suspicious variants.[45, 62]
25
The identification of the recessive causal mutation involves several steps depending on the exclusion of the irrelevant variants. As a first step, novel variants should be identified by discrete filtering of the variants against a set of polymorphisms with minor allele frequencies higher than 0.1% using databases or datasets such as NCBI dbSNP, 1000 Genomes Project, and NHLBI GO Exome Sequencing Project. The next step would be stratification of the candidate variants on the basis of their positional and functional impacts by coding (frameshift, stop codon, splice site, missense, silence) or noncoding (intronic, intergenic, UTR). Protein altering variants that reside at the exons, regulatory regions and canonical splice sites should be selected for further analysis. The most important step here is the filtering of the variants which are not segregated with the disease phenotype in the family. Population screening would be last filtering step of the novel homozygous protein altering variants. The remaining variants can be annotated using the computational approaches such as evolution-based conservation analysis as the measure of deleteriousness, constraint-based prediction analysis concerning the effect of variation on the protein-coding sequence and analysis of the curated databases.[45, 62]
As a result of sequencing data annotation, the most likely culprit disease causing mutation is identified. Experimental analysis would provide a support of causality for the given phenotype. The most powerful approach is the identification of the same or different mutations in the same gene in different families or unrelated sporadic cases. However, the phenotype and/or the mutation would be extremely rare in some recessive cases. In such cases, molecular consequences of the causal mutation could be evaluated in vitro or the phenotypic consequences of the causal mutation could be evaluated in vivo in a model organism.
1.6.5 Identification of the causal mutation in CAMRQ
In this thesis, identification of a novel missense causal mutation in a consanguineous Turkish family with a genetically heterogeneous autosomal recessive disorder, Cerebellar Ataxia, Mental Retardation, and disequilibrium syndrome with or without
26
quadrupedal locomotion (CAMRQ), by using homozygosity mapping followed by target enrichment and next generation sequencing will be discussed.
1.7 Subject and outline of the Thesis
CAMRQ syndrome is observed in another consanguineous family (Family C) from southern Turkey with four affected individuals in three branches of the pedigree (Figure 1.3, Figure 3.1, and Table 3.1).[32, 63]
The involvement of previously identified CAMRQ genes VLDLR, WDR81 and CA8 genes were excluded by using Sanger sequencing and homozygosity analysis. Homozygosity mapping analysis revealed four shared homozygous regions on chromosomes 13, 19 and 20 (Table 3.2). In order to identify the culprit gene, all homozygous regions were sequenced using target enrichment followed by next-generation sequencing and all segregated variants were evaluated using structural and functional predictions, and population screening (Table 3.19). In this thesis, the story behind the identification of a missense mutation in ATP8A2, encoding a P4-type transmembrane protein ATPase, aminophospholipid transporter, class I, type 8A, member 2, which is found to be associated with the phenotype in Family C is described.[64]
27
Chapter 2
Materials and Methods
2.1 Recruitment of Patients and Controls
A consanguineous family from southern Turkey, Family C, in which four individuals had CAMRQ syndrome, was investigated (Figure 3.1). The only affected female in the family was withdrawn form the study since her parents did not give consent for publishing the DNA analysis results. The index patient of the study, coded as 05-993, recently died secondary to a respiratory infection. The study was approved by the institutional review boards (IRB) at the Cukurova and Baskent Universities (decision 21/3, 08.11.2005 and KA07/47, 02.04.2007, respectively).
A total of 605 healthy individuals with no family history of movement disorders were used as a control in the study. Two additional cohorts including patients with similar neurological phenotypes were used in the study to find another patient with the candidate mutation: A cohort of 58 patients with cerebellar phenotypes with or without quadrupedal locomotion and a cohort of 750 patients with degenerative
28
neurological disorders or structural cortical malformations. All the participants and/or their parents were asked to sign an informed consent form prior to the study.
2.2 Clinical Investigations
Clinical investigations were performed at Cukurova University while the patients were awake and the clinical description of the family was published elsewhere. [63] All clinical investigations performed were compatible with the Helsinki Declaration (http://www.wma.net).
The “Mini Mental State Examination” (MMSE) test is performed in order to measure mental statuses of the individuals. It measures five cognitive function: language, registration, orientation, recall, and attention/calculation. A score of 23 or lower out of 30 reveals a cognitive problem with varying degrees.[65] Standardized Turkish version of the MMSE test was used for the three of the four patients.[66]
Cranial MRI and full-body computed tomography (CT) screening studies were performed at Cukurova University, Medical Faculty, Adana, Turkey.
2.3 DNA Isolation from the Family Members
Peripheral blood samples obtained from the patients and their parents by a specialist using venipuncture technique. 10 ml venous blood samples were collected in K3-EDTA containing BD Vacutainer® Blood Collection tubes (Becton Drive, NJ, USA). The tubes were transferred to the laboratory at cold chains, quickly divided into 1 ml aliquots in 1.5 ml eppendorf tubes, and stored at -80oC refrigerators.
DNA isolation was performed with 200 µl peripheral blood samples using Nucleospin® Blood kit (Macherey-Nagel Inc., PA, USA) according to protocols
29
manufacturers supplied. A second DNA isolation from patients (05-993, 05-994, and 05-996) were carried out using Phenol-Chloroform DNA extraction method [67] to obtain genomic DNA with high quality and high quantity which is necessary for high-throughput genotyping and sequencing reactions.
The quantities and qualities of the samples were measured by densitometry analysis using horizontal 1% gel electrophoresis, by spectrophotometric reading using NanoDropTM ND-1000 Spectrophotometer (NanoDrop Technologies, Inc., DE, USA), and by fluorometric quantification using PicoGreen® assay.[68]
2.4 Genetic Mapping Techniques
2.4.1 Genome-wide SNP Genotyping
DNA from peripheral blood samples of four patients and their three obligate carrier parents and two siblings were genotyped using the GeneChip® Human Mapping Affymetrix 10K Xba arrays (Affymetrix, Inc., CA, USA) for haplotype construction. SNP genotyping experiments were performed according to the manufacturer's protocol (Affymetrix, Inc., CA, USA). Briefly, 250 nanogram of DNA was digested with XbaI and the fragmented DNA was ligated to the XbaI adaptor. PCR amplification of the fragments carried out using AmpliTaq Gold (Applied Biosystems, CA, USA) enzyme following by array hybridization. Affymetrix GTYPE v4.1 software (Affymetrix, Inc., CA, USA) was used to generate CEL files. Exploration, normalization, and retrieval of genotype calls were achieved using Affymetrix Genotype Console Software v2.1 (Affymetrix, Inc., CA, USA) with the default parameters.
For homozygosity mapping analysis, three patients’ (993, 994, and 05-996) DNA were genotyped by using GeneChip® Human Mapping Affymetrix 250K NspI arrays as in the protocol that the manufacturer supplied (Affymetrix, Inc., CA, USA). Briefly, 250 nanograms of DNA was digested using NspI restriction enzyme
30
followed by linker ligation, PCR amplification, fragmentation, labeling, and array hybridization. Affymetrix GTYPE v4.1 software (Affymetrix, Inc., CA, USA) was used to generate CEL files. Image data were normalized and genotypes were called using Affymetrix Genotype Console Software v2.1 (Affymetrix, Inc., CA, USA) with the default parameters using the BRLMM algorithm.
In addition, a higher resolution Illumina Human610-Quad BeadChip arrays (Illumina, Inc., CA, USA) were used to genotype two affected individuals (05-994 and 05-996) in order to confirm homozygous regions detected by Affymetrix SNP array. The experiments were performed according to manufacturer's instructions. Briefly, 200 nanogram of genomic DNA was whole-genome amplified, fragmented with FMS reagent (Illumina, Inc., CA, USA), precipitated with 2-propanol and resuspended in RA1 hybridization buffer supplied by the manufacturer (Illumina, Inc., CA, USA). After overnight hybridization, the arrays were subjected to single-base extension, labeling, and coating with XC4 (Illumina, Inc., CA, USA). The image data were obtained by Illumina Bead Array Reader (Illumina, Inc., CA, USA). Normalization of the image data and genotype calling were achieved using Bead Studio software (Illumina, Inc., CA, USA) with the default parameters.
2.4.2 Homozygosity mapping analysis and haplotype construction
Homozygosity mapping is used to identify the locus containing the gene underlying recessive diseases. It is based on enrichment of homozygosity in the region harboring the disease causing gene in the affected individuals in a family.[51] Advances in high throughput SNP genotyping made this technique crucial in the identification of the disease causing recessive locus.
Processing and analysis of the Affymetrix and Illimuna SNP genotyping data was carried out using web-based HomozygosityMapper software [69] to identify homozygous regions. Homozygosity mapping using the Affymetrix 250K SNP arrays was performed in the three affected patients. According to array data sheet supplied