c
⃝ T¨UB˙ITAK
doi:10.3906/kim-1412-42 h t t p : / / j o u r n a l s . t u b i t a k . g o v . t r / c h e m /
Research Article
Functional gold nanoparticle coated surfaces for CA 125 cancer biomarker
detection
˙Ilknur TUNC¸1,∗, Hepi Hari SUSAPTO2, Mustafa ¨Ozg¨ur G ¨ULER2
1
Department of Mechanical Engineering, Faculty of Engineering, University of Turkish Aeronautical Association, T¨urkku¸su Campus, Etimesgut, Ankara, Turkey
2
Institute of Materials Science and Nanotechnology, National Nanotechnology Research Center (UNAM), Bilkent University, Ankara, Turkey
Received: 17.12.2014 • Accepted/Published Online: 05.05.2015 • Printed: 28.08.2015
Abstract: Here we describe the detailed characterization of gold nanoparticle (Au Np) functionalized surfaces as a biosensing platform by studying a model streptavidin (SA)–biotin interaction. Conjugation of SA on Au Np immobilized on silicon (Si) and quartz surfaces and its interaction with biotin were characterized by X-ray photoelectron spectroscopy (XPS), UV-Vis spectroscopy, circular dichromism (CD) spectroscopy, and contact angle measurements. The immobiliza-tion method and atomic concentraimmobiliza-tions of Si 2p, Au 4f, S 2p, C 1s, N 1s, and O 1s of the resulting SA–biotin modified Si surface were determined by XPS. The CD spectrum and confocal microscopy imaging confirmed that step-by-step mod-ification and bioconjugation can be monitored successfully. Such detailed and well-defined step-by-step characterization provides good information about the surface properties of biosensor platforms. In addition, the LSPR sensing ability of the Au Np based platforms was studied by using a model SA–biotin system. A 20 nm spectral red shift was detected when 150 nM SA was immobilized on to the Au Nps surface using the direct incubation/binding method on to the dry surface instead of the flow-injection method. The same platforms were also used to detect the CA 125 antibody–antigen system. Large spectral red shifts are very promising in terms of using these surfaces as LSPR biosensors.
Key words: Au Np, bioconjugation, streptavidin, biotin, CA 125, LSPR, biosensor
1. Introduction
Biosensor effectiveness is mainly dependent on the accuracy and reproducibility of the measurements.1,2 Gold
nanoparticles (Au Nps) can contribute to these properties, allowing amplification of signal transduction and
providing improved surface area.3,4 In both cases construction of a homogeneous and densely packed layer of Au
Nps is crucial to ensure an optimal amplification while preserving the reproducible and quantitative response of
transduction techniques.5,6 Au Nps as amplification tags have become objects of research in the fields of gene
analysis and antigen detection.7,8
Au Nps act as transducers converting small changes in the local refractive index into spectral shifts in the
extinction spectrum of the Nps.9 Most organic molecules have a higher refractive index than buffer solution.
Therefore, when organic molecules bind to Nps, the local refractive index increases, leading to a red shift in the plasmon resonance band of the Nps. Molecular binding can be monitored in real time with high sensitivity by using simple and inexpensive transmission spectrometry, which measures extinction, the sum of absorption,
and scattering,10−15 and the real-time binding of conconavalin A to mannose-functionalized nanoparticles was
reported.15 The real-time LSPR-shift assay had a similar response to a surface plasmon resonance (SPR)
instrument whose principle is based on propagating plasmons in a thin gold film. However, LSPR-shift assay demonstrated less interference from the bulk refractive index. In addition, LSPR has greater spatial resolution, which is both lateral and normal, when compared with SPR. In order to confirm the sensitivity capability of
LSPR biosensor model systems of SA–biotin detection have been widely applied.12−16
The interaction between SA and biotin forms a strong, highly specific bond,17 and many reagents for
this bioconjugation technique are readily available.18−20 For LSPR biosensing, the SA–biotin interaction is very
well suited, because biotin is a small organic molecule and can be conjugated to the nanoparticle surface.21 In
contrast to biotin, SA is a relatively giant protein molecule and is easily detected by measuring changes in its
refractive index.22,23 There have been many investigations of SA–biotin interactions using LSPR sensors.24−28
Biotin was attached through a linker to spherical Au Nps that were previously immobilized onto a glass
substrate.29 Detection was performed by monitoring spectral changes using a spectrometer or by detecting color
intensity changes of Au Nps while protein solution was flowing through the Np surface. Single-particle LSPR imaging was reported utilizing transmission grating to generate diffraction spectra from multiple nanoparticles
captured using a CCD camera.28 This system detected SA–biotin interactions with 150 nM SA concentrations
and a spectral shift of 13.5 nm. Kaur et al.25 reported that the SA–biotin interaction is dependent on the
size of nanoparticles compared with IgG and protein A. Their results indicated that nanoparticle size strongly influences the apparent thickness and refractive index of the adsorbed proteins.
The LSPR biosensor platform should be carefully designed to obtain more accurate and reproducible sensing; however, well-defined characterization of surface of the platforms is crucial. XPS is a very sensitive
surface characterization technique widely utilized in order to characterize antibody-modified sensors.30−32
However, to the best of our knowledge, detailed and step-by-step modification of the surface during construction of the sensing platforms has not been studied yet.
In this study, a highly ordered, homogeneous Au Nps film on quartz and silicon substrate was fabricated in order to develop a LSPR biosensor platform. Detailed and well-defined step-by-step XPS analysis of all the surface activations was performed. SA–biotin conjugation on these surfaces was confirmed by circular dichromism (CD) and confocal Raman microscopy. SA binding in the range of nM concentrations led to a 20 nm spectral red shift in the LSPR band of the Au Nps, whereas small molecule biotin did not lead to a significant spectral shift. Such a large spectral shift has not been reported for spherical Au Nps films and appears very promising for detection of large biomolecules such as tumor markers for diagnosing purposes. Therefore, the experiment was performed by using CA 125, which is widely used for serum assays clinically to monitor ovarian cancer. Large spectral shift assures the opportunity to use Au Np film surfaces as LSPR biosensors.
2. Results and discussion
Figure 1a displays representative SEM images of Au Nps with size ca. 12 ± 1 nm self-assembled monolayer
(SAM) films on quartz surfaces, which were obtained with different dipping times (1, 5, 8, 12 h). Only a slight increase in Au Np coverage was recorded even at 24 h dipping time; surface coverage was not increased any more due to particle–particle repulsions. A series of experiments was performed with these surfaces in this study; there was no significant difference between the measurements due to the slight change in surface coverage. Therefore, all of the measurements were performed with the Au Np film surfaces obtained with 1 h dipping time. The surfaces were perfectly stable in that there was no aggregation on the surfaces when examined by
SEM even 3 months after preparation. UV-Vis spectra of the Au Np films also confirmed that Au Nps were stable on the surfaces with time, since there was no red-shift at the surface plasmon band (SPR) band of Au Nps that appears at 516 nm (Figure 1b).
300 400 500 600 700 800 0.000 0.005 0.010 0.015 0.020 0.025 A bs or ba nc e (a .u .) Wavelength (nm)
Au Np film (after 1 hour) Au Np film (after 1 month) Au Np film (after 3 months)
(a) (b)
Figure 1. (a) Representative SEM images of Au Np with size ca. 12 ± 1 nm films obtained with different dipping times (1, 5, 8, 12 h). All images were recorded with the same magnification and voltage values. Scale bar is identical for all images. b) UV-Vis spectra of Au Np films aged after preparation (1 h, 1 months, 3 months later).
XPS is a very sensitive diagnostic technique for the assessment of the chemical state of elements. The XPS analysis of various surfaces including amine, acid groups, or protein molecules provides information on the chemistry of the surface. The binding energies recorded around 84, 99, 163, 285, 400, and 532 eV correspond to the constituents gold (Au 4f), silicon (Si 2p), sulfur (S 2p), carbon (C 1s), nitrogen (N 1s), and oxygen (O 1s). The Table presents the quantifications of the XPS wide scan survey of the surfaces after every modification step until the SA–biotin conjugation step. The atomic concentration of each element was calculated using the peak
areas normalized on the basis of acquisition parameters and of the atomic sensitivity factors.33 A bare Si wafer
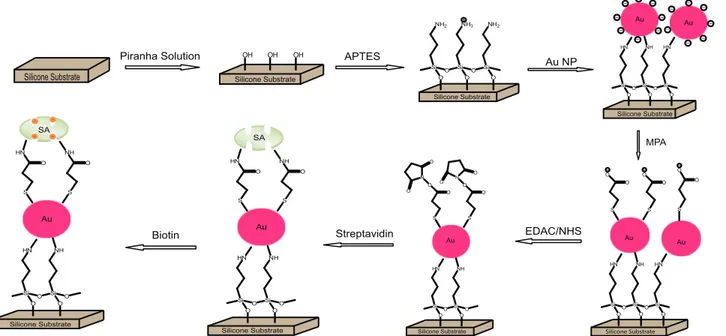
has poor content of C and N (noninherent contaminant) and rich content of Si and O as expected. The bare Si surface was used to react with APTES by the method of SAM for subsequent bioimmobilization. As shown in the proposed reaction scheme (Figure 2), the XPS analysis of the APTES-modified Si wafer provides evidence of the coupling reaction of APTES to the bare Si surface. A significant N component was detected, indicating coupling of APTES and Si surface. Further respective modifications, i.e. Au Np binding, modification of the Au Np surface with MPA, EDAC/NHS activation for SA binding, and biotin conjugations, led to significant changes in the chemical content of the surface. The most drastic change in the chemical composition of the surface was observed after immobilization of SA and conjugated biotin. The SA-immobilized surface reveals large enhancement in C, N, and O at%, and declines in Au and Si at%. The fact that the Au and Si signal is much weaker than that of the other modified surface suggests that the sample of the SA causes attenuation in the XPS signal of Au and Si that increases with depth. At some steps, trace amounts of F 1s, Cl 1s, and Na 2s were also recorded during XPS analysis (not shown in the Table) due to contaminant of chemicals used in surface preparations.
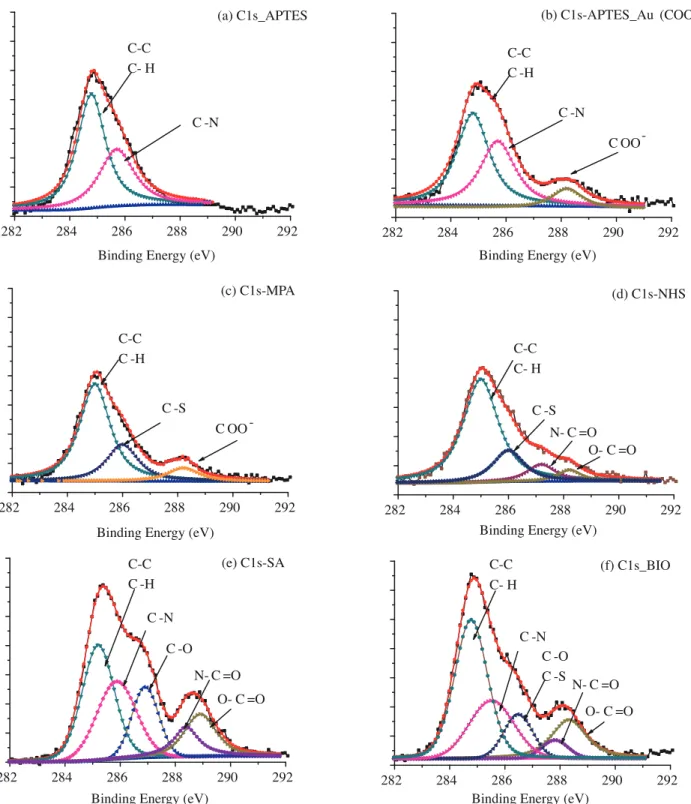
Figure 3 shows the XPS spectra of the C 1s region of the APTES functionalized Si surface, Au Nps tagged APTES functionalized Si surface (Au Nps film), MPA modified Au Nps film, NHS modified Au Nps film, SA immobilized Au Nps film, and biotin conjugated SA immobilized Au Nps film. Step-by-step modification of the
Silicone Substrate Piranha Solution Silicone Substrate Silicone Substrate APTES Silicone Substrate Au NP MPA Silicone Substrate EDAC/NHS Silicone Substrate u Streptavidin Silicone Substrate SA Biotin Silicone Substrate O Si O Si O Si O O NH2 NH3 NH2 OH OH OH O Si O Si O Si O O HN NH HN Au Au O Si O Si O Si O O HN NH HN S S O O O O S O O Au Au O Si O Si O O HN NH S S O O O O N N O O O O Au O Si O Si O O HN NH S S O O HN NH Au SA O Si O Si O O HN NH S S O O HN NH Au
Figure 2. Schematic of the steps involved in the fabrication of the immobilized colloidal Au biosensor platform on silicon. Si substrate was functionalized with APTES to provide an amine-terminated surface for formation of a monolayer of Au Nps. SAM of MPA on Au Nps provide a reactive carboxyl group that can be further modified by NHS to study specific binding of SA and bioconjugation with biotin.
Table. Chemical composition of modified surface before and after conjugation. Atomic concentration of each element was measured from the atomic sensitivity factor of XPS.
XPS (at%) elemental composition
Si 2p C 1s N 1s O 1s Au 4f S 2p
Si wafer 53.6 8.4 2.0 35.0 -
-APTES modified Si 34.4 28.7 6.0 30.7 -
-Au Np tagged APTES modified Si (-Au Np film) 28.5 29.3 5.6 28.3 8.2
MPA modified Au Np film 29.0 26.7 3.5 26.1 6.5 8.1
NHS modified Au Np film 25.7 28.4 6.2 27.4 6.0 5.0
SA immobilized Au Np film 14.5 48.2 11.3 23.0 4.8 1.3
BIO SA conjugated Au Np film 12.8 46.0 7.0 24.3 4.6 4.5
Si surface leads to significant alteration in the C 1s region due to a change in surface chemical structure. In Figure 3a, C 1s due to C–C and C–H bonds appears at 284.8 eV, while that from the C–N bond is separated at
285.5 eV, as expected.32 When Au Nps are tagged to the APTES modified Si surface, C 1s of the COO− bond
shows up explicitly at higher binding energy level of about 288.3 eV (Figure 3b).34,35 Further modification of
the Au Np surface with MPA leads to the appearance of new C1s belonging to the C–S bond in the MPA–Au linkage (Figure 3c). EDAC/NHS activation of the Au Nps surface leads to SA binding to the Au Np surface,
which in turn brings one more C 1s of amide bonding (O=C–N) at 287.5 eV (Figure 3d).32 SA binding to the
Au Np surface leads to significant enhancement in the intensity of C 1s as well as versatility of the functional groups C rich chain of SA (Figure 3e). Biotin conjugation tends to preserve this characteristic. Additional C 1s of the C–S bond in biotin’s chemical structure can be distinguished at 286.4 eV, together with C 1s of the
282 284 286 288 290 292 Binding Energy (eV)
(a) C1s_APTES C-C C- H C -N 282 284 286 288 290 292 O- C =O N- C =O C -O C -S C -N
Binding Energy (eV)
(f) C1s_BIO C-C C- H 282 284 286 288 290 292 C OO -(c) C1s-MPA C-C C -H
Binding Energy (eV) C -S 282 284 286 288 290 292 O- C =O N- C =O C-C C- H (d) C1s-NHS
Binding Energy (eV) C -S 282 284 286 288 290 292 O- C =O N- C =O C -O C -N C-C C -H
Binding Energy (eV)
(e) C1s-SA 282 284 286 288 290 292 C OO -C -N C-C C -H
Binding Energy (eV)
(b) C1s-APTES_Au (COO–)
Figure 3. XPS spectra of the C1S region of APTES functionalized Si surface (a), Au Nps tagged APTES functionalized Si surface (Au Nps film) (b), MPA modified Au Nps film (c), NHS modified Au Nps film (d), SA immobilized Au Nps films (e), biotin conjugated SA immobilized Au Nps films (f).
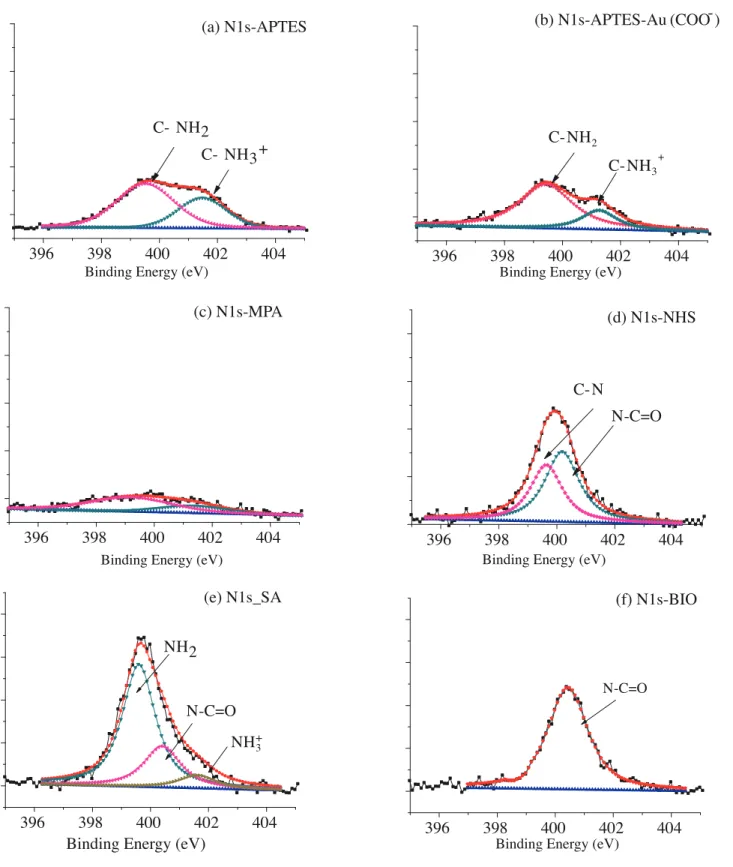
Figure 4 shows XPS spectral regions of N1s of the APTES functionalized Si surface, Au Nps film, MPA modified Au Nps film, NHS modified Au Nps film, SA immobilized Au Nps film, and biotin conjugated
396
398
400
402
404
(f) N1s-BIO
Binding Energy (eV) N-C=O
396
398
400
402
404
Binding Energy (eV)
NH2
N-C=O
NH
+3(e) N1s_SA
396
398
400
402
404
Binding Energy (eV)
(d) N1s-NHS
N-C=O
C- N
396
398
400
402
404
(c) N1s-MPA
Binding Energy (eV)
396
398
400
402
404
C- NH
3+(b) N1s-APTES-Au (COO )
-Binding Energy (eV)
C- NH
2396
398
400
402
404
C- NH2
Binding Energy (eV)
(a) N1s-APTES
C- NH3
+
Figure 4. XPS spectra of N1 S region of APTES functionalized Si surface (a), Au Nps film (b), MPA modified Au Nps film (c), NHS modified Au Nps film (d), SA immobilized Au Nps films (e), biotin conjugated SA immobilized Au Nps films (f).
SA immobilized Au Nps film. N 1s of NH2 and protonated amine (NH+3) can be resolved at 399.5 eV and
401.7 eV,37 respectively, as shown in Figure 4a. When citrate-capped Au Nps are immobilized to APTES
electrostatically, the intensity of the peak at 401.7 eV diminishes explicitly due to attenuation of the N 1s signal of protonated amine with Au Nps (Figure 4b). Successive binding of MPA to Au Nps proves that the N 1s peak was almost completely quenched since there is no N content of MPA (Figure 4c). Next, NHS modification leads to a rise in intensity of the N 1s peak. N 1s, originating from imide binding, can be resolved at 400.5 eV (Figure
4d).32 Like C 1s the XPS spectral region of N 1s shows significant change due to binding of SA (Figure 4e). Both
intensity and versatility increase. Namely, N 1s in the chemical content of SA chain stemming from primary
amine, amide, and protonated amine are convoluted at 339.7 eV, 400.5 eV, and 401.7 eV, respectively.38,39
Biotin conjugation to SA leads to significant change in the N 1s region as in the case of the C 1s spectral region. Hence the symmetrical peak can be fitted as single peak at 400.5 eV corresponding to N 1s of amide bonds in the biotin chemical structure (Figure 4f).
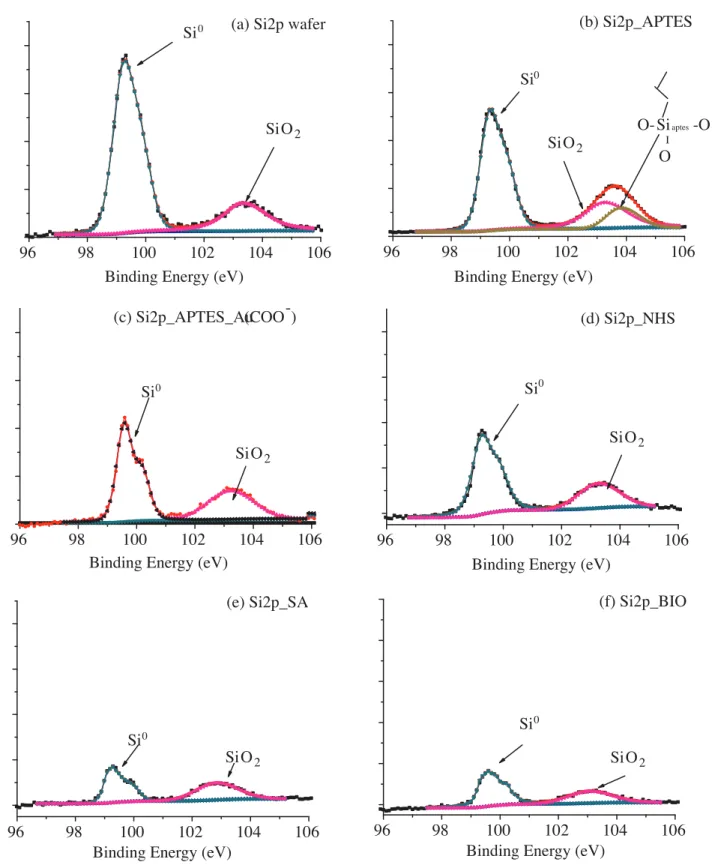
Figure 5 shows the XPS spectra of Si 2p region of Si wafer, APTES functionalized Si surface, Au Nps film, NHS modified Au Nps film, SA immobilized Au Nps film, and biotin conjugated SA immobilized Au Nps
film. Si0 2p stemming from the Si wafer and Si+4 2p of native oxide are recorded at 99.3 and 103.2 eV40 in
Figure 5a. When the surface is modified with APTES, SAM coverage of APTES leads to enhancement of the intensity of Si 2p of the oxide spectral region. Si 2p originates from APTES linkage to the Si surface and is well separated at higher binding energy value, 103.8 eV, because of the oxygen-rich environment of Si (Figure 5b). Au Np binding to APTES attenuates Si 2p of the linkage. Therefore, the Si 2p signal at 103.8 eV disappears.
However, the Si4+ 2p peak at 103.3 eV remains at the same position and intensity. Further modifications result
in decreases in both Si0 2p and Si4+ signals due to attenuations of the corresponding XPS signals (Figures
5c–5f). A drastic intensity drop is observed when SA and biotin are conjugated at the surface and the presence
of the long protein chain attenuates both Si0 2p and Si4+ 2p XPS signals (Figures 5e and 5f). However, when
SA and biotin are conjugated at the surface (final step), small biotin molecules do not affect the intensity of XPS signals compared to the effect of SA binding to the surface (Figure 5f).
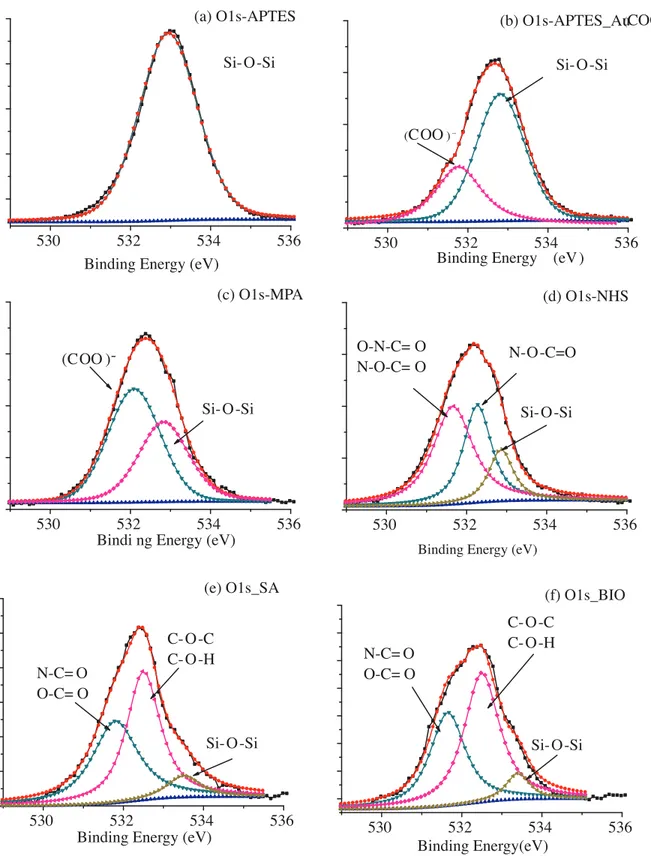
Similar trends reported for C1s and N1s regions are also observed in the O1s XPS spectral regions. Functional groups can be distinguished easily due to deconvolution of the O 1s peak originating from related functionalization of the surface in every step. Moreover, the XPS spectra of the Si 2p regions discussed above offer insight into the characterization of O 1s stemming from the Si–O bond.
Figure 6 displays the XPS spectral regions of O 1s of the APTES functionalized Si surface, Au Nps film, MPA modified Au Nps film, NHS modified Au Nps film, SA immobilized Au Nps film, and biotin conjugated SA immobilized Au Nps film. Figure 6a displays the deconvolution of the O1s peak (at 533.0 eV) covering signals from both oxide layer on Si wafer and the Si–O bond from APTES linkage. Another O 1s peak is separated at 531.8 eV originating from the citrate cap of Au Np tagged to the surface in Figure 6b. The peak intensity decreases proportional to the degradation of the Si 2p spectral area stemming from APTES as compared with Figure 5c. Therefore, it can be concluded that mainly the O 1s signal of the Si–O–Si bond of APTES linkage
is attenuated due to Au Nps tagged to the APTES. However, the SiO2 signal is still present since the surface
was not completely covered with Au Nps (Figure 6c). Further modifications lead to a gradual decrease in the intensity of the O 1s peak of the Si–O bond as seen in Figures 6d–6f. The extent of such a decrease is consistent
with the decrease in the intensity of Si4+ 2p peaks. On the other hand, EDAC/NHS activation of the surface
96
98
100
102
104
106
Si O
2Si
0(f) Si2p_BIO
Binding Energy (eV)
96
98
100
102
104
106
Si O
2Si
0(e) Si2p_SA
Binding Energy (eV)
96
98
100
102
104
106
Si O
2Si
0(d) Si2p_NHS
Binding Energy (eV)
96
98
100
102
104
106
Si O
2Si
0Binding Energy (eV)
(c) Si2p_APTES_Au
(COO
-
)
96
98
100
102
104
106
Si O
2Si
0Binding Energy (eV)
Binding Energy (eV)
O- Si
aptes-O
I(b) Si2p_APTES
O
96
98
100
102
104
106
Si
0Si O
2(a) Si2p wafer
Figure 5. XPS spectra of Si2p region of Si wafer (a), APTES functionalized Si surface (b), Au Nps film (c), NHS modified Au Nps film (d), SA immobilized Au Nps films (e), biotin conjugated SA immobilized Au Nps films (f).
530
532
534
536
C- O-C
C- O-H
N-C= O
O-C= O
Binding Energy(eV)
(f) O1s_BIO Si- O-Si530
532
534
536
Binding Energy (eV)
(e) O1s_SA
N-C= O
O-C= O
C- O-C
C- O-H
Si- O-Si
530
532
534
536
O-N-C= O
N-O-C= O
Binding Energy (eV)
Si- O-Si
N-O-C=O
(d) O1s-NHS
530
532
534
536
Binding Energy (eV)
(a) O1s-APTES
Si- O-Si
530
532
534
536
(b) O1s-APTES_Au
Si- O-Si
(COO
) _Binding Energy (eV )
(
COO
-)530
532
534
536
(c) O1s-MPA
Si- O-Si
(COO
)-Bindi ng Energy (eV)
Figure 6. XPS spectra of O 1S region of APTES functionalized Si surface (a), Au Nps film (b), MPA modified Au Nps film (c), NHS modified Au Nps film (d), SA immobilized Au Nps films (e), biotin conjugated SA immobilized Au Nps films (f).
group (O–N–C=O) of cyclic structure and N–O–(C=O)– linkage that binds cyclic imide to the Au Np surface, respectively (Figure 6d). When SA binds to the surface an apparent change in the O 1s region as in the case of other elemental regions is observed (Figure 6e). O 1s of the all the functional groups is clearly distinguished. Since the contribution of functional groups changes when biotin is conjugated to SA, slight intensity changes are observed in the O 1s deconvoluted peaks (Figure 6f).
Figures 5 and 6 demonstrate the strength of the XPS measurements in order to characterize surface applications. Gradual quenching of Au 4f peaks was also observed due to attenuation of the Au signal upon respective surface modifications. In the case of the S XPS spectral region, the S 2p peak was also first recorded at about 163 eV due to Au–S binding when Au Nps were modified with MPA. Intensity of S 2p decreases upon further surface functionalization. However, an enhancement was also observed after biotin conjugation to SA due to the S content of biotin. Similar XPS characterizations were performed after using CA 125 antibody and antigen instead of SA–biotin couple. The experimental results confirmed bioconjugation of CA 125 antibody and antigen.
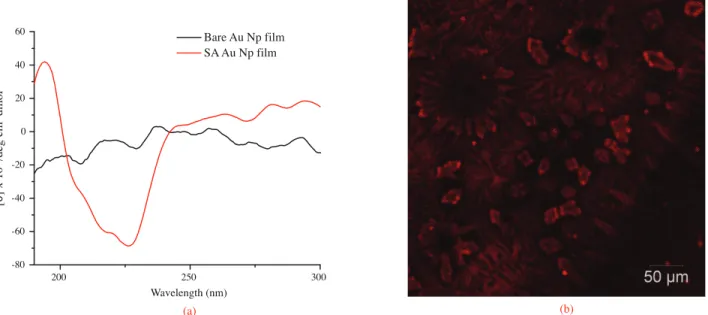
Figure 7 displays the far UV CD spectrum of SA immobilized Au Np film on quartz versus bare Au Np film on the quartz and confocal image of SA fluorescein conjugate (SA-FITC). The CD spectrum in Figure 7a reveals the secondary-structure analysis of SA. Namely, minima around 225 and 210 nm, and a maximum
around 195 nm confirm alpha helical and beta sheet contributions of the SA chain.41 Figure 7b shows the
confocal Raman microscopic image of Au Np film after incubation with SA-FITC. The image gives information about the successful attachment of SA onto the functionalized Au Np film compared to the bare Au Np film, which gives a dark image only.
200 250 300 -80 -60 -40 -20 0 20 40 60 Bare Au Np film SA Au Np film Wavelength (nm) [ θ] x 10 / de g c m d m ol -3 2 -1 (a) (b)
Figure 7. Far UV CD spectrum of SA Au Np film on quartz versus bare Au Np film on quartz (a), confocal image of SA-FITC deposited on Au Nps film (b).
The well-studied SA–biotin system was chosen as a model due to its high binding affinity (Ka∼1013
M−1)17 as well as large molecular mass of SA regarding a distinguishable spectral shift. In fact, the LSPR
band shifts as a response to change in refractive index.10 LSPR spectral shifts can be maximized by optimizing
the mass of the molecule.42−44 Thus, proteins and macromolecules provide larger molecular shifts per molecule than small SAM molecules do.
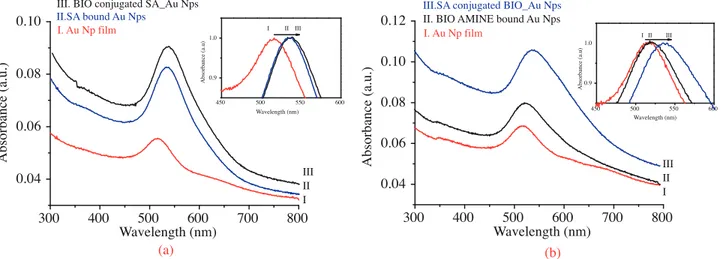
Figure 8a displays the UV-Vis spectra of Au Nps tagged on the quartz surface; SA immobilized Au Nps and biotin conjugated SA immobilized Au Nps on the quartz surface. A LSPR band of bare Au Nps appears at 516 nm. 300 400 500 600 700 800 0.04 0.06 0.08 0.10 0.12 Wavelength (nm) 450 500 550 600 0.9 1.0 Wavelength (nm) A bsorba nc e (a .u) I II III A bs o rb an ce (a .u .)
II. BIO AMINE bound Au Nps I. Au Np film
III.SA conjugated BIO_Au Nps
III II I (b) 300 400 500 600 700 800 0.04 0.06 0.08 0.10 (a) 450 500 550 600 0,9 1,0 A bsorba nc e (a .u) Wavelength (nm) I II III
III. BIO conjugated SA_Au Nps II.SA bound Au Nps I. Au Np film Wavelength (nm) A bs o rb an ce (a .u .) III II I
Figure 8. UV-Vis spectrum of (a) Au Nps film on quartz, SA immobilized Au Nps film on quartz, biotin conjugated SA immobilized Au Nps on quartz. (b) Au Nps film on quartz surface, biotin ethylenediamine (BIO AMINE) immobilized Au Np film on quartz and SA conjugated BIO AMINE immobilized Au Nps on quartz.
When SA is immobilized onto the Au Nps surface, the SPR band shifts 20 nm to a higher wavelength value due to the first amplification method discussed above. On the other hand, small molecule biotin conjugation leads to only 2 to 3 nm red shift, which does not cause significant amplification due to low molecular weight. Figure 8b displays the UV-Vis spectra of Au Nps before and after the conjugation process, which is the same as the procedure applied in Figure 8a. However, the order of binding is backwards. Namely, biotin ethylenediamine is bonded to carboxylated Au Nps first and then SA conjugation is carried out. Binding of biotin ethylenediamine leads to 2 to 3 nm red shift in the SPR band of Au Nps. Afterwards, SA conjugation
causes a 20 nm red shift, as in the case of Figure 8a. In the study by Marinakos et al.,45 a 1 to 10 nm spectral
shift proportional to concentration 0.1 to 1000 nM was recorded using Au nanorod surfaces when bound to SA in solution using the flow injection method. Here we report a 20 nm spectral shift when about 150 nM SA solution was incubated/washed and dried on to the Au Np film compared to bare Au Np films. Due to the reversible interaction between SA and Au Nps surface an even lower concentration of 150 nM SA molecules likely bound to the closely packed, homogeneous Au Nps film surfaces, which leads to such a large shift.
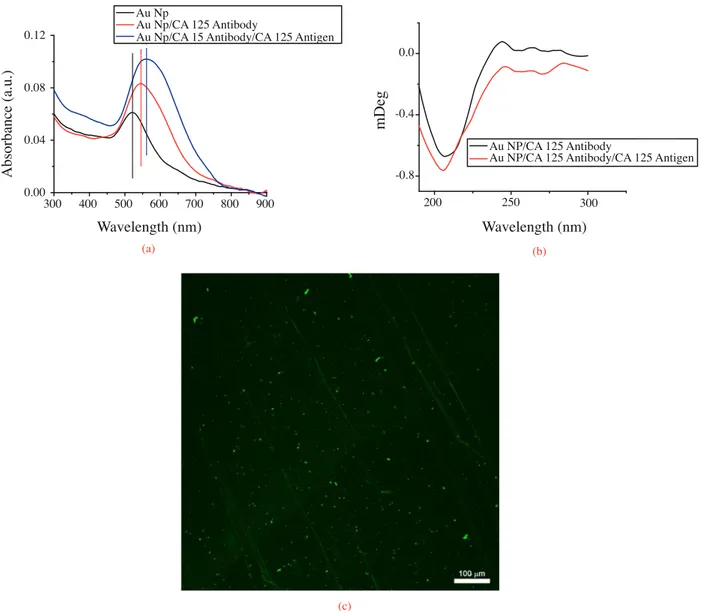
A similar experimental route was used for CA 125 antibody–antigen couple. Figure 9a displays the UV-Vis absorption spectra of Au Np film, CA 125 antibody immobilized Au Nps, and CA 125 antigen bioconjugated to CA 125 antibody on Au Np films. When Au Nps film was incubated in 0.5 mg/mL CA 125 antibody solution, the LSPR band of Au Nps was 22 nm red shifted compared to bare Au Nps film. When 20 µ g/mL antigen was incubated on the CA 125 antibody bound Au Nps film surfaces, 15 nm more red shift was observed due to the effects discussed in detail above. Since the Mw of CA 125 antigen (35 kDa) is lower than that of antibody (135 kDa), it is reasonable to record a smaller red shift. Not only shifting towards longer wavelength in the spectra but also increasing the intensity of the band was recorded. In order to test the selectivity of CA 125
antibody bound Au Np film surface was incubated with SA solution; there was no recordable spectral shift after incubation in the SPR band of Au Nps. Additionally, after incubation with FITC-SA solution there were no bright points under confocal Raman microscopy. The data confirm that CA 125 antibody was specifically bound to the CA 125 antigen.
300 400 500 600 700 800 900 0.00 0.04 0.08 0.12 A bs or ba nc e (a .u.) Wavelength (nm) Wavelength (nm) Au Np Au Np/CA 125 Antibody
Au Np/CA 15 Antibody/CA 125 Antigen
(a) (b) (c) 200 250 300 -0.8 -0.4 0.0 m D eg Au NP/CA 125 Antibody
Au NP/CA 125 Antibody/CA 125 Antigen
Figure 9. UV-Vis spectrum of (a) Au Nps film on quartz, CA 125 antibody immobilized Au Nps film on quartz, CA 125 antigen conjugated CA 125 antibody on Au Nps on quartz, (b) far UV CD spectra of CA 125 antibody immobilized Au Nps film on quartz, CA 125 antigen conjugated CA 125 antibody on Au Nps on quartz, (c) confocal Raman microscopic image of CA 125-FITC antibody immobilized Au Nps film on quartz.
In Figure 9b the CD spectra of CA 125 antibody and antigen are shown. The minima at 200–220 nm belong to the secondary structure of the SEA domain of CA 125, which has a unique α / β sandwich
fold composed of two α helices and four antiparallel β strands.46 Figure 9c displays CA-FITC 125 antibody
immobilized Au Np film on the quartz surface. Bright points confirm CA 125 antibody–antigen bindings to the Au Np surface. To the best of our knowledge, this is the first discussion of CA 125 detection using Au Nps as LSPR biosensor.
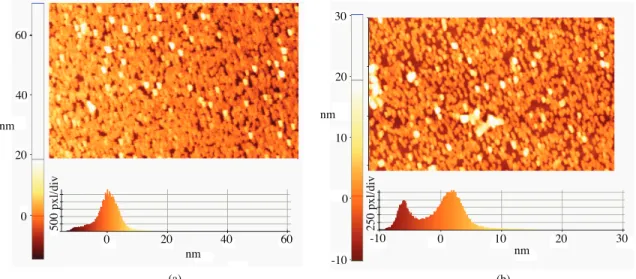
The AFM images in Figure 10 illustrate the surface morphology of bare Au Np film and CA125 antibody– antigen conjugated Au Np film. After CA 125 binding there was no significant change in the surface morphology of Au Nps. Au Nps were regularly arranged at the substrate before and after bioconjugation. There was no aggregation of Au Nps after bioconjugation. It is well known that aggregation of Au Nps leads to a red shift
in the SPR band.47 Therefore, the data confirm that the SPR band shift was a result of high molecular weight
biomolecules. (a) (b) nm nm nm nm 0 20 40 60 0 20 40 60 0 -10 10 20 30 -10 0 10 20 30 500 pxl /di v 250 pxl /di v
Figure 10. AFM topography images of bare Au Np film (a) CA 125 antibody–antigen bound Au Np film (b) (scan area: 5 × 3 µm).
In the present study, well-defined homogeneous and closely packed Au Np films were constructed on quartz and silicon surfaces in order to use the surfaces as biosensor platforms. Streptavidin–biotin bioconjugation was successfully performed on these surfaces. All of the surface functionalization steps and bioconjugation were examined by detailed XPS analysis. Streptavidin binding was also confirmed by CD spectroscopy and confocal Raman microscopic techniques. Additionally, LSPR biosensing ability was measured by using UV-Vis spectroscopy for the streptavidin–biotin system as well as the cancer biomarker marker CA 125 antibody– antigen system. Significant LSPR band shifts were recorded by binding of such large biomolecules. Detailed XPS analysis and the promising LSPR property give useful information for biosensor research.
3. Experimental
(3-Aminoproply)trimetoxysilane (APTES), tetracholoroauric acid (HAuCl4) , trisodium citrate dehydrate
(C6H5O7Na3.2H2O), 3-mercapto propionic acid (MPA), N−hydroxysulfosuccinimide (NHS),
1-ethyl-3-(3-dimethylaminopropyl)carbodiimide (EDAC), 2-( N -morpholino)ethanesulfonic acid (MES), potassium
chlo-ride (KCl), sodium chlochlo-ride (NaCl), disodium hydrogen phosphate (Na2HPO4) , monopotassium phosphate
(KH2PO4) , anhydrous ethanol, and biotin were purchased from Sigma Aldrich. Streptavidin, FITC-streptavidin
(Mw = 66 kDa), CA 125 antibody (monoclonal antibody to Muc16 (Mw = 135 kDa)), CA 125 antigen (protein Muc16 (Mw = 35 kDa), and polyclonal antibody to mouse IgG (H & L) with FITC were purchased from Acris Antibodies. Milli-Q water was used for cleaning and preparations.
3.1. Preparation methods
3.1.1. Au Np solution preparation
Au Np colloid was prepared by the Turkevich method.48 Citrate-capped Au Nps were synthesized by mixing
100 mL of boiling solution of HAuCl−4 (0.5 mM) and 5 mL of preheated sodium citrate (1 wt %) under vigorous
stirring. A fast color change from pale yellow to red wine is evidence of Au Nps with the average particle size ca. 15 nm.
3.1.2. APTES modification of Si wafers
Silicon wafers were cut into 1 cm2 slides and were cleaned by immersion in piranha solution (3:1 sulfuric acid
to hydrogen peroxide) for 30 min. The slides were thoroughly rinsed in DI water and were dried under vacuum. Then they were immersed in 10% of APTES anhydrous ethanolic solution for 30 min. Upon completion of the specified reaction time, slides were removed from the APTES solution and were rinsed with anhydrous ethanol through the surfaces and ultrasonic ethanol bath for 15 min three times in order to remove physisorbed APTES
molecules from the surfaces. Finally, they were placed in an oven at 120 ◦C for 90 min in order to fix APTES
molecules to the surfaces.49
3.1.3. Au Np binding to APTES modified surfaces (Au Np film)
APTES modified Si wafers were immersed in Au Np aqueous solution for 1 h. Then they were removed from the solution and rinsed with DI water for 15 min three times in order to remove unbound Au Nps. They were dried by incubating at room temperature.
3.1.4. MPA modification of Au Np film
Au Np-tagged Si wafers were immersed in 20 mM aqueous solution of MPA for 2 h. Then they were removed from the solution and washed with DI water for 15 min three times. Finally they were dried at room temperature.
3.1.5. EDAC/NHS activation of MPA modified Au Np film
After MPA binding to the Au Np surface, the terminal carboxylate group of thiols was activated with 1:1 mixture of 0.1 M NHS and 0.1 M EDAC in MES buffer solution, by dropping 0.5 mL of the mixture onto the surfaces. After 1 h they were rinsed under the flow of MES buffer solution and DI water for 15 min. They were then dried at room temperature.
3.1.6. SA binding to Au Np film
First 1 mg/mL SA was dissolved in PBS buffer solution and then 20 µ L of the solution was diluted to 1 mL and
0.5 mL of this solution was dropped on the NHS activated surface. The surface was stored at 6 ◦C overnight.
Then it was washed with PBS and DI water three times for 15 min.
3.1.7. Biotin conjugation with SA on Au Np film
First 0.5 mL of 5 mM biotin in PBS was dropped and stored for 2 h at room temperature. The final product was then rinsed with PBS and deionized water and air-dried at room temperature. CA 125 antibody–CA 125 antigen bioconjugation was carried out using the same experimental route.
3.2. Characterization methods
Au Np films and adsorption behavior of SA and biotin were assessed by XPS, CD spectroscopy, confocal Raman microscopy, UV-Vis spectroscopy, SEM, and AFM measurements.
3.2.1. XPS measurements
In order to characterize the chemical composition and the molecular structures of the surface modifications, detailed XPS analyses were performed for every step. A Thermo Scientific XPS spectrometer with an Al–K α
monochromatic (100–400 eV range) X-ray source and ultrahigh vacuum (∼10−9 Torr) was used to identify the
chemical composition of the surfaces. Twenty scans were obtained and averaged. The binding energy scales
in all of the spectra were calibrated by the bulk Si0 2p peak at 99.3 eV. The spectra of the wide scan for the
surveying and narrow scan of each element (such as Si, Au, S, C, N, and O) were collected at a takeoff angle
of 60◦; the takeoff angle is defined as the angle between the substrate surface and the energy analyzer. The
percentage atomic contents and atomic ratios were calculated using sensitivity factors of elements. Spectral deconvolution was performed using Gaussian profiles for each element in the narrow scan.
3.2.2. CD measurements
CD spectra were obtained on a J-715 JASCO spectropolarimeter (Easton, MD, USA) using SA immobilized Au Np film deposited on the quartz surface. The CD spectra were collected between 180 and 300 nm at room temperature. Five scans were obtained and averaged. Scans were collected at 1-nm intervals with a response time of 0.25. SEM measurements were performed by a FEI Quanta 200 FEG using a magnification up to 2.4
× 105 at 10 kV accelerating voltage.
3.2.3. UV-Vis spectroscopy measurements
UV-Vis absorption spectra were collected using a Varian Cary 500 Scan UV-Vis spectrophotometer. UV-Vis spectra in the range from 300 to 900 nm were measured with 1-nm data intervals at the scan rate of 300 nm
min−1. The results are presented as difference spectra obtained by the subtraction of the reference spectrum
of quartz from the spectra of the samples.
3.2.4. Confocal Raman microscopy measurement
A Zeiss LSM 510 laser scanning confocal microscope was used for this characterization. Au NP films incubated with SA-FITC or CA 125-FITC antibodies overnight were imaged using an argon laser. To control the excitation and emission spectra of the FITC attached antibodies, the confocal microscope was set by using HFT 488 for the main beam splitter and BP 505–550 for the emission filter. The collected images were optimized to get good contrast and composition.
3.2.5. AFM measurement
A Park System XE-100 SPM was used for AFM measurements. The topography scans were recorded under ambient conditions with an isolated air table. The instrument was operated in noncontact AFM mode. Our cantilever selection was Tap150 Al-G (Budget Sensors) with 150 kHz resonant frequency and 5 N/m force constant.
3.2.6. SEM measurements
SEM measurements were performed with an FEI Quanta 200 FEG microscope using 240× magnification and
15 kV.
Acknowledgments
This work was supported by the Scientific and Technological Research Council of Turkey (T ¨UB˙ITAK) grant no.
112T850. ˙IT thanks Dr Aykutlu Dana and Ayseg¨ul Abdelal for AFM images, and Dr Mustafa Fatih Geni¸sel
and Dr R¨ukan Gen¸c for their help and support.
References
1. Luppa, P. B.; Sokoll, L. J.; Chan, D. W. Clin. Chim. Acta 2001, 314, 1–26.
2. Boujday, S.; Bantegnie, A.; Briand, E.; Marnet, P. G.; Salmain, M.; Pradier, C. M. J. Phys. Chem. B 2008, 112,
6708–6715.
3. Hutter, E.; Fendler, J. H. Adv. Mater. 2004, 16, 1685–1706.
4. Lalander, C. H.; Zheng, Y.; Dhuey, S.; Cabrini, S.; Bach, U. ACS Nano. 2010, 4, 6153–6161.
5. Morel, A. L.; Boujday, S.; M´ethivier, C.; Krafft, J. M.; Pradier, C. M. Talanta 2011, 85, 35–42.
6. Morel, A. L.; Volmant, R. M.; M´ethivier, C.; Krafft, J. M.; Boujday, S.; Pradier, C. M. Colloid. Surface B 2010,
81, 304–312.
7. He, L.; Musick, M. D.; Nicewarner, S. R.; Salinas, F. G.; Benkovic, S. J.; Natan, M. J.; Keating, C. D. J. Am.
Chem. Soc. 2000, 122, 9071–9077.
8. Ma, Z.; Sui, S. F. Angew. Chem. Int. Edit. 2002, 41, 2176–2179.
9. Chen, H.; Kou, X.; Yang, Z.; Ni, W.; Wang, J. Langmuir 2008, 24, 5233–5237.
10. Willets, K. A.; Van Duyne, R. P. Annu. Rev. Phys. Chem. 2007, 58, 267–297.
11. Yonzon, C. R.; Stuart, D. A.; Zhang, X.; McFarland, A. D.; Haynes, C. L.; Van Duyne, R. P. Talanta 2005, 67,
438–448.
12. Haes, A. J.; Chang, L.; Klein, W. L.; Van Duyne, R. P. J. Am. Chem. Soc. 2005, 127, 2264–2271.
13. Dahlin, A. B.; Tegenfeldt, J. O.; H¨o¨ok, F. Anal. Chem. 2006, 78, 4416–4423.
14. Stuart, D. A.; Haes, A. J.; McFarland, A. D.; Nie, S.; Van Duyne, R. P. Proceedings of SPIE-The International Society for Optical Engineering 2004, 5327, 60–73.
15. Yonzon, C. R.; Jeoung, E.; Zou, S.; Schatz, G. C.; Mrksich, M.; Van Duyne, R. P. J. Am. Chem. Soc. 2004, 126,
12669–12676.
16. Haes, A. J.; Van Duyne, R. P. J. Am. Chem. Soc. 2002, 124, 10596–10604.
17. Green, N. M. In Advances in Protein Chemistry ; Anfinsen, C. B; Edsall, J. T.; Richards, F. M., Eds.; Academic Press: New York, NY, USA, 1975; Vol. 29, p 85–133.
18. Chuang, Y.; Lee, C. Y.; Lu, S. H.; Wang, S. C.; Chau, L. K.; Hsieh, W. H. Anal. Chem. 2010, 82, 1123–1127.
19. Kajiura, M.; Nakanishi, T.; Lida, H.; Takada, H.; Osaka, T. J. Colloid. Interf. Sci. 2009, 335, 140–145.
20. Zhu, S.; Li, F.; Du, C.; Fu, Y. Nanomedicine 2008, 3, 669–677.
21. Wan, M.; Luo, P.; Jin, J.; Xing, J.; Wang, Z.; Wong, S. T. C. Sensors 2010, 10, 6477–6487.
22. Vazquez Mena, O.; Sannomiya, T.; Villanueva, L. G.; Voros, J.; Brugger, J. ACS Nano 2010, 5, 844–853.
23. Lin, Y.; Zou, Y.; Mo, Y.; Guo, J.; Lindquist, R. G. Sensors 2010, 10, 9397–9406.
25. Kaur, K.; Forrest, J. A. Langmuir 2011, 28, 2736–2744.
26. Huang, T.; Nancy Xu, X. Nanoscale 2011, 3, 3567–3572.
27. Xiang, G.; Zhang, N.; Zhou, X. Nanoscale Res. Lett. 2010, 5, 818–822.
28. Chen, K. H.; Hobley, J.; Foo, Y. L.; Su, X. Lab Chip. 2011, 11, 1895–1901.
29. Nath, N.; Chilkoti, A. Anal. Chem. 2001, 74, 504–509.
30. Ahmed, M.; Byrne, J.; McLaughlin, J.; Ahmed, W. J. Biomater. Nanobiotechnol. 2013, 4, 194–203.
31. Ithurbide, A.; Frateur, I.; Galtayries, A.; Marcus, P. Electrochimic. Acta 2007, 53, 1336–1345.
32. Lai, L. J.; Yang, Y. W.; Lin, Y. K.; Huang, L. L.; Hsieh, Y. H. Colloid. Surface B 2009, 68, 130–135.
33. Wagner, C. D.; Riggs, W. M.; Davis, L. E.; Moulder, J. F. Handbook of X-Ray Photoelectron Spectroscopy ; PerkinElmer Corporation: Eden Prairie, MN, USA, 1979.
34. Cossaro, A.; Cvetko, D.; Floreano, L. Phys. Chem. Chem. Phys. 2012, 14, 13154–13162.
35. Ochoa, N.; Bello, M.; Sancrist´obal, J.; Balsamo, V.; Albornoz, A.; Brito, J. L. Mat. Res. 2013, 16, 1209–1219.
36. Tu, Q.; Pang, L.; Chen, Y.; Zhang, Y.; Zhang, R.; Lu, B.; Wang, J. Analyst. 2014, 139, 105-115.
37. Hsu, S. H.; Lin, C. L.; Tseng, C. S. Biofabrication 2012, 4, 015002.
38. Ahmed, M.; Byrne, J.; McLaughlin, J.; Ahmed, W. J. Biomater. Nanobiotechnol. 2013, 4, 194–203.
39. Kim, H.; Bae, I. S.; Cho, S. J.; Boo, J. H.; Lee, B. C.; Heo, J.; Chung, I.; Hong, B. Nanoscale. Res. Lett. 2012, 7, 1–7.
40. Ulgut, B.; Suzer, S. J. Phys. Chem. B. 2003, 107, 2939–2943.
41. Urich, T.; Bandeiras, T. M.; Leal, S. S.; Rachel, R.; Albrecht, T.; Zimmermann, P.; Scholz, C.; Teixeira, M.; Gomes,
C. M.; Kletzin, A. Biochem. J. 2004, 381, 137–146.
42. Haes, A. J.; Zou, S.; Schatz, G. C.; Van Duyne, R. P. J. Phys. Chem. B 2004, 108, 6961–6968.
43. Haes, A. J.; Zou, S.; Schatz, G. C.; Van Duyne, R. P. J. Phys. Chem. B 2003, 108, 109–116.
44. Whitney, A. V.; Elam, J. W.; Zou, S.; Zinovev, A. V.; Stair, P. C.; Schatz, G. C.; Van Duyne, R. P. J. Phys. Chem.
B 2005, 109, 20522–20528.
45. Marinakos, S. M.; Chen, S.; Chilkoti, A. Anal. Chem. 2007, 79, 5278–5283.
46. Maeda, T.; Inoue, M.; Koshiba, S.; Yabuki, T.; Aoki, M.; Nunokawa, E.; Seki, E.; Matsuda, T.; Motoda, Y.;
Kobayashi, A. J. Biol. Chem. 2004, 279, 13174–13182.
47. Huang X.; El Sayed M. J. Advanced Res. 2010, 1, 18–23.
48. Enustun, B. V.; Turkevich, J. J. Am. Chem. Soc. 1963, 85, 3317–3328.