Contents lists available atScienceDirect
Journal of Environmental Management
journal homepage:www.elsevier.com/locate/jenvmanResearch article
Examination of gas and solid products during the preparation of activated
carbon using phosphoric acid
Emine Yagmur
a, I. Isil Gurten Inal
a, Yavuz Gokce
a, T. Gamze Ulusoy Ghobadi
b, Tugce Aktar
a,
Zeki Aktas
a,∗aDepartment of Chemical Engineering, Faculty of Engineering, Ankara University, Tandogan, 06100, Ankara, Turkey
bUNAM– National Nanotechnology Research Center, Institute of Materials Science and Nanotechnology, Bilkent University, 06800, Ankara, Turkey
A R T I C L E I N F O Keywords: Waste tea Chemical activation Microwave pretreatment Phosphoric acid Activated carbon Characterisation A B S T R A C T
Activating agents play significant roles in the preparation of activated carbon (AC) from biomasses and their wastes, which are widely used in AC production. Application methods are also important for the production process. Products give remarkable ideas regarding the method and heat treatment process. The activated carbon was produced from waste tea in accordance with either the conventional method or microwave energy pre-treated method using phosphoric acid (H3PO4) as activating agent. The yields of the activated carbons were
51.8% for conventional method and 46.0% for microwave pretreated method. The acid suppressed the formation of tar and promoted the amount of solid and aromatic structure accordance to sp2hybridisation. Additionally,
the waste tea was directly carbonised (without H3PO4) and the yield was 36.3%. Major gas (H2, CH4, C2H6, C2H4,
CO2and CO) products obtained during heat treatment process in a conventional furnace were examined in terms
of quantity and quality. The solid products were characterised in terms of surface area, pore size and surface properties. The result of gas analysis showed that phosphoric acid affected formation of activated carbon me-chanism and significant reactions occurred during microwave pretreatment process.
1. Introduction
Lignocellulosic biomasses and their wastes are low cost potential raw materials to produce high surface area activated carbon. The cel-lulose, hemicellulose and lignin contents control the porosity develop-ment and surface properties of the activated carbon. The activated carbon is widely used in different fields due to its composition and renewable nature, and plays a significant role in adsorption technolo-gies, battery electrodes, capacitors, and gas storage (Dias et al., 2007; Peláez-Cid et al., 2016;Nabais et al., 2013;Gokce and Aktas, 2014;Inal et al., 2015). A variety of lignocellulosic materials such as waste tea (Yagmur et al., 2008;Gurten et al., 2012;Fadhil et al., 2012), corn cob (Song et al., 2013), rice husk (Somasundaram et al., 2013), sugar cane bagasse (Rufford et al., 2010), palm shell (Arami-Niya et al., 2012), lignin (Gao et al., 2013), and so on have been used as precursors to produce the activated carbon. The activated carbon is prepared by physical activation in an oxidizing atmosphere (such as CO2, H2O, O2) or by chemical activation with chemical reagents such as KOH (Wu et al., 2011;González-García et al., 2013), NaOH (Foo and Hameed, 2012;Islam et al., 2017), ZnCl2(Zyoud et al., 2015), H3PO4(Jagtoyen and Derbyshire, 1998;Yagmur et al., 2008;Gokce and Aktas, 2014) and
K2CO3(Gurten et al., 2012) under different conditions. The activation temperature depends on the type of activating agent, for example, 700–900°С for KOH, NaOH and K2CO3 (Gao et al., 2013; Foo and Hameed, 2012; Gurten et al., 2012), 500–700°С for ZnCl2 ( Molina-Sabio and Rodrıguez-Reinoso, 2004), and 400–500°С for H3PO4 (Jagtoyen and Derbyshire, 1998;Yagmur et al., 2008).
H3PO4is widely used for the production of activated carbon from lignocellulosic materials (Jagtoyen and Derbyshire, 1998; Yagmur et al., 2008;Gokce and Aktas, 2014;Hared et al., 2007;Dobele et al., 1999;Zuo et al., 2009). Phosphoric acid integrates in the interior of cell walls of the lignocellulosic materials during heating process. Eventually the biomass is converted into a solid product with a highly developed pore structure. The amount of solid product increases due to the crosslinking reactions (above 300°С) as results of hydrolysis and de-hydration by H3PO4 (Jagtoyen and Derbyshire, 1998; Solum et al., 1995;Zuo et al., 2010).Jagtoyen and Derbyshire (1998) stated that phosphoric acid has two functions in the process. Thefirst is to promote bond cleavage reactions and the creation of crosslinks by means of processes, for example cyclisation and condensation. The second is to combine with organic species to form phosphate and polyphosphate bridges that connect and crosslink biopolymer fragments.Zuo et al.
https://doi.org/10.1016/j.jenvman.2018.09.046
Received 16 January 2018; Received in revised form 17 August 2018; Accepted 13 September 2018
∗Corresponding author.
E-mail address:[email protected](Z. Aktas).
Available online 18 September 2018
0301-4797/ © 2018 Elsevier Ltd. All rights reserved.
(2012) reported that the presence of phosphoric acid noticeably de-pressed the evolution of CO, CO2and CH4and promoted H2.
As reported above many studies are available in the existing lit-erature relating to the preparation of activated carbon from lig-nocellulosic biomasses in the presence of phosphoric acid. In the ma-jority of these studies, attention has been focused on the solids and their characteristics. The literature investigating both the gas and solid products at the same time during heat treatment process (Zuo et al., 2012) is very limited. Research investigating the relationship between the gas evolution and the solid product characteristics would provide significant knowledge regarding the mechanism of the process.
Microwave heating method has been recently used for the pre-paration of the activated carbon as well as the conventional heating processes (Yagmur et al., 2008,2013;Yagmur, 2012;Foo and Hameed, 2012). Our previous studies (Yagmur et al., 2008) showed that micro-wave pretreatment enhanced surface properties (particularly total sur-face area increased nearly 10–24%) of the activated carbon compared to the conventional method. In this research, experiments were per-formed to prepare activated carbons from factory waste tea according to the conventional and microwave pretreatment methods using phos-phoric acid.
The objective of the study is to examine the gas and solid products and to establish the relationship between the gas and solid products. It is also to show the effects of microwave pretreatment in the presence of phosphoric acid on the amounts and properties of gas and solid pro-duced.
2. Experimental
2.1. Materials and material fabrication
Factory waste tea (WT, particle size: less than 500μm) was chosen as a raw material to prepare activated carbon in the presence of phosphoric acid (Merck, 85%) which was used as an activating agent. The waste tea was collected from a tea plant located in Eastern Black Sea region in Turkey.
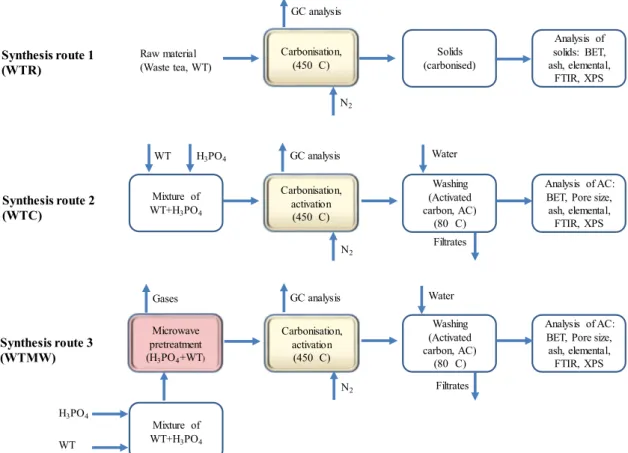
Three sets of experiments were performed. Thefirst involved direct carbonisation of the raw material (WTR). The second used a conven-tional method where the mixture of the raw material and phosphoric acid was carbonised-activated (WTC). Unlike our previous works (Yagmur et al., 2008), a temperature programmable rotary tube furnace was used to be able to collect properly gaseous product. The third one utilised a microwave pretreatment process (WTMW). In this third case, the acid-raw material mixture was pretreated first in a domestic mi-crowave oven and then the mixture was carbonised-activated in the same furnace as specified above. The whole process is schematically presented inFig. 1.
Heat treatment of the samples was conducted in a quartz tube re-actor placed in the furnace. Pure nitrogen gas was provided as an inert gas atmosphere and theflow rate of nitrogen was 150 ml/min. For each sample (the raw material, mixture of raw material + H3PO4) was he-ated to temperature of 450 °C at the constant heating rate (10 °C/min). The solids in the reactor were held at 450 °C for 1 h. Gaseous material was collected in Tedlar sample bags during the heat treatment process at different temperature intervals (Table 1).
The raw material (waste tea, WTR) was directly carbonised in the furnace without using any activating agent. Activated carbon was produced in two ways: conventional (WTC) and microwave pretreat-ment (WTMW) methods. In the conventional method (WTC), the waste tea was mixed with H3PO4(85%, wt) at the acid/waste tea ratio of 2/1 (wt/wt). The mixture was loaded to the rotary tube furnace for the heat treatment process. In the microwave pretreatment method (WTMW) the mixture was directly subjected to microwave radiation for 30 s before loading the furnace (Yagmur et al., 2008). A domestic microwave oven (Vestel, MDG-620) was used for the pretreatment process. The fre-quency and the input power of the microwave oven were 2.45 GHz and
900 W, respectively. The microwave pretreated sample was placed in the rotary tube furnace for further activation/carbonisation process as described for the conventional method (seeFig. 1). Following treatment in the furnace in the presence of phosphoric acid, the sample was re-moved and mixed with hot distilled water (500 ml, 80 °C) and held in the water for 12 h and then washed andfiltered. The solid fraction was dried in an oven at 110 °C overnight. The sample was then turned in a mill (IKA, M20 Universal Mill) at 20 000 rpm for 3 min, in order to liberate trapped acid. The milled sample was re-washed with distilled water until thefiltrate became neutral and the solid fraction was dried for analyses.
2.2. Analyses 2.2.1. Gas analysis
The gases collected in Tedlar sample bags were analysed in a gas chromatograph (Micro GC T3000, SRA Instruments) equipped with a dual-column (MS 5A and PPU) and micro thermal conductivity detec-tors. The SOPRANE software package was used to identify the collected data by quantifying the peak areas. The collection temperatures of the gas samples are tabulated inTable 1. Gas analysis details and micro-GC conditions (Table S1) are reported in the Supplementary Information. 2.2.2. Solid analysis
The carbon, hydrogen, nitrogen and sulphur contents of the raw materials and the solids were analysed using a LECO CHNS 932 Elemental Analyser. The oxygen content was calculated by difference. The BET surface area and pore size distributions (the Non Local Density Functional Theory, NLDFT, method) of the samples were determined using a Quantachrome NOVA 2200 series volumetric gas adsorption instrument (Evans and Tarazona, 1984). The analysis details are pre-sented in the Supplementary Information.
2.2.3. FTIR analysis
FTIR (Fourier Transform Infrared Spectroscopy) analyses of the solids were performed using a Shimadzu FTIR - 8040 spectro-photometer. The spectra were completed in the range of 400–4000 cm−1. Thin KBr pellets have been prepared with the mass ratio of 300:1 (KBr:Sample) for the samples.
2.2.4. XPS analysis
X-ray photoelectron spectroscopy (XPS) measurements were con-ducted using a Thermo Scientific, K-Alpha, x-ray photoelectron spec-trophotometer with Al Kα x-ray source (1486.6 eV). The binding energy scales of the high resolution spectra were calibrated by shifting C1s peak position to 284.8 eV. Peak deconvolution was carried out using Gaussian-Lorentzian curves. The survey scans were obtained using the pass energy of 200 eV and a step size of 1 eV. High resolution scans were performed using a pass energy of 30 eV and a step size of 0.1 eV. 3. Results and discussion
3.1. Analysis of gases
Thermal decomposition of lignocellulosic materials (hemicellulose, cellulose and lignin) occurs at two different temperature steps; high (> 300 °C) and lower (< 300 °C) temperatures. Major noncondensable gases such as CO, CO2, H2, and CH4are released during the carboni-sation process of these materials (Ronsse et al., 2015;Li et al., 2015; Ferrera-Lorenzo et al., 2014a). However, it is well known and com-monly reported that phosphoric acid changes the depolymerisation and dehydration mechanisms during the heat treatment process (Jagtoyen and Derbyshire, 1993, 1998; Dobele et al., 1999). According to Jagtoyen and Derbyshire (1998), phosphate esters form on cellulose side chains at < 450 °C in the presence of phosphoric acid. The acid is eliminated at higher temperature (> 450 °C). In this process,
aromaticity and loss of aliphatic, carboxyl, and carbonyl groups in-crease (Solum et al., 1995).
Fig. 2 represents the amount of hydrogen evolved during heat treatment process for the experiments. The raw material (WTR) without H3PO4, conventional (WTC) and microwave pretreated (WTMW) methods in the presence of the acid produced similar amounts of H2. The amount of hydrogen was insignificant up to 400–420 °C, however it increased sharply at 450 °C, which was the final temperature of the process, and reached to a maximum when the material was held in the furnace for 30 min at the samefinal temperature. The amount of gas sharply declined after 30 min holding time at 450 °C. The presence of phosphoric acid did not significantly change the amount of hydrogen released.
Fig. 3shows the amounts of methane in the gas samples at different temperature ranges. Direct carbonisation of the raw material (WTR) produced significant amount of CH4compared to the samples WTC and WTMW. CH4is released mainly from the cracking of methoxyl groups and the C─C bond cleavage in aliphatic chains at relatively lower temperatures (Ferdous et al., 2001). Lower amounts of CH4produced from WTC and WTMW are attributed to presence of the acid which
possibly changes decomposition mechanism of biomass. The gas re-leased with temperature increased sharply reaching a maximum at 450 °C and then sharply decreased with time at the constant tempera-ture (450 °C). Microwave pretreated samples produced less methane compared to the WTC. The reason is that some of methane released during microwave pretreatment process (30 s). A similar trend is ob-served for ethane that is shown inFig. 4. This supports that aliphatic structure significantly decomposes due to cleavage of aliphatic side chains in the presence of H3PO4during heating process (Jagtoyen and Derbyshire, 1998).
The situation is slightly different for ethylene as shown inFig. 5. The maximum amounts of ethylene were produced at lower temperatures than 450 °C for the activated carbons prepared in the presence of H3PO4. Phosphoric acid in the mixture shifted the maxima to a lower temperature. Due to microwave pretreatment, less ethylene formed
Fig. 1. Schematic of the processes used to produce gases and solids.
Table 1
Data for gas samples collected.
Sample no Temperature (ºC) Collecting time, (min.) Notes
1 180–200 16–18 2 250–270 23–25 3 300–320 28–30 4 350–370 33–35 5 400–420 38–40 6 450 (1) 43–45 1stmin. at 450 °C 7 450 (30) 73–75 30thmin. at 450 °C 8 450 (60) 103–105 60thmin. at 450 °C Ambient temperature: 20 °C.
during the process.
Figs. 6 and 7show the amounts of CO2and CO released during the heat treatment processes, respectively. The release of CO2and CO starts at a lower temperature range between 180 and 200 °C and is almost completed at 450 °C after 30 min. The maxima of the gases shift to lower temperatures for the samples treated (WTC, WTMW) in the presence of H3PO4. Majority of the gases were released at higher tem-perature for the raw material (WTR). Therefore, its maxima moved to the right, which corresponds to a higher temperature when compared to the samples treated in the presence of acid. CO2and CO were most likely generated from the degradation of hemicellulose and the pyr-olysis of cellulose (aromatic and aliphatic carboxyl groups), respec-tively (Lv and Wu, 2012). It was also reported byYang et al. (2007)that
the presence of C═O groups in hemicellulose caused formation of CO2. The presence of H3PO4in the mixture significantly affected the re-action mechanism. CO, CO2and ethylene gases that were released at lower temperature compared to the experiment performed using WTR (in the absence of acid). In general, the amounts of gases which were produced in the presence of the acid were lower than that of the gases obtained from the raw material. In brief, phosphoric acid caused pro-duced less gases (except CO) and repro-duced the decomposition tem-perature for the gases CO, CO2and ethylene. Thesefindings are con-sistent with the studies reported in the literature; it is reported that phosphoric acid catalysed the thermal decomposition of the nocellulosic raw material and hydrolysed glycosidic linkages in lig-nocellulosic and depressed the evolution of the gases. It is also reported that the acid cleaved aryl ether bond in lignin in the raw material (Jagtoyen and Derbyshire, 1993,1998;Dobele et al., 1999,2001;Zuo et al., 2012;Nowakowski et al., 2008). The gases are produced from carboxyl, carbonyl and ether groups in the structure as a result of the cracking and reforming reactions (Wang et al., 2009;Liu et al., 2008). Several decomposition reactions also take place during the micro-wave pretreatment process in the micromicro-wave oven (Ferrera-Lorenzo et al., 2014b). The release of gas product was observed in the fume cupboard in the course of microwave irradiation process.
3.2. Analysis of solids
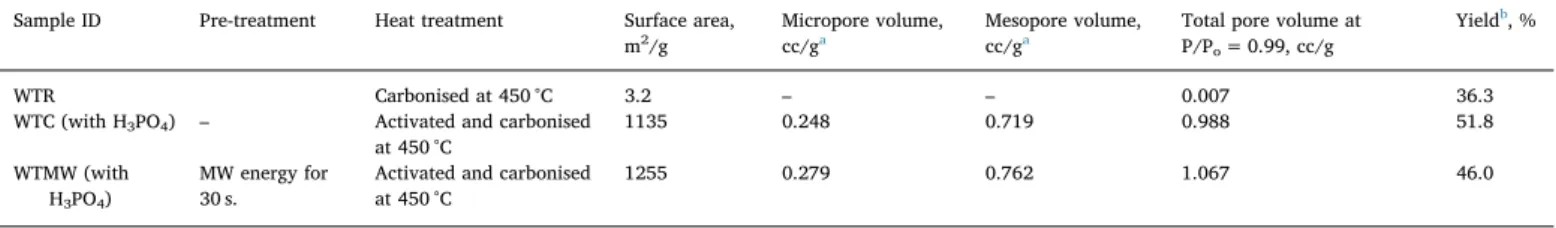
The BET surface area, pore volume and yield of the solids were reported inTable 2. As reported in the experimental section, the waste tea was directly carbonised (WTR) under nitrogen atmosphere in the absence of activating agent. The BET surface area and pore volume of WTR were 3.2 m2/g and 0.007 cc/g, respectively. The activated carbons
Fig. 3. Methane contents of the gas fractions.
Fig. 4. Ethane contents of the gas fractions.
Fig. 5. Ethylene contents of the gas fractions.
Fig. 6. Carbon dioxide contents of the gas fractions.
obtained according to conventional (WTC) and microwave pretreat-ment (WTMW) methods have significantly higher surface areas. As the BET surface area of microwave pretreated sample was 1255 m2/g, the surface area of the activated carbon obtained from conventional method was 1135 m2/g. Similarfindings were reported in our previous studies (Yagmur et al., 2008;Gokce and Aktas, 2014). High surface area is attributed to microwave heating mechanism that occurs from the core of material to outer surface (Yagmur et al., 2008). This process most probably forms new pores and therefore generates higher surface area. The pore volumes and yields of these samples were reported in last two columns ofTable 2. The yields of solids were higher for the experiments (WTC, WTMW) performed in the presence of phosphoric acid. On the other hand, the yield of solid is substantially low for the sample WTR (pyrolysed without phosphoric acid). The yield of WTR is consistent with TGA analysis of the same waste tea reported in our previous work (Tiryaki et al., 2014). As reported in Section3.1, the amount of gas product was highest for WTR compared to the samples WTC and WTMW treated in the presence of acid. This is evidence that phosphoric acid suppresses formation of tar and increases the yield of solid due to crosslinking reactions (Zuo et al., 2012). It is better to point out that the amount of gases is higher for WTR than the others. This clearly shows that significant fraction of the raw material is converted into gaseous product in the absence of the acid.
The adsorption/desorption isotherms of the samples, WTC and WTMW, are presented inFig. 8. The isotherms of the activated carbon samples are similar and have hysteresis, which is indicative of meso-porosity. The isotherms and hysteresis are Type IV and Type H4, re-spectively, according to the IUPAC classification (Thommes et al., 2015). The volume of gas adsorbed by WTR (direct carbonised) was very low, therefore the isotherms of this sample was not inserted in Fig. 8.
Fig. 9 shows the pore size distributions of the activated carbon samples obtained from NLDFT method. There is no significant differ-ence in the distribution curves. As pore size distribution of the samples is slightly different between 1.1 and 7 nm, their distributions are very similar beyond 7 nm.
3.3. Ultimate analyses of the heat treated samples
Table 3reports the results of ultimate analyses and ash contents of the heat treated samples. Additional data about elemental composition of microwave treated-30 sample is reported inTable S2. The carbon contents of the samples; WT, WTC and WTMW are shown in the second column of the table. The ash contents of the solid samples are not sig-nificantly different; however, their oxygen contents are dissimilar. The sample WTMW has the lowest oxygen content. This is attributed to the microwave pretreatment causing the release of oxygen rich groups as gases during process. This statement is supported by the study carried out byDominguez et al. (2007). They reported that microwave olysis caused more deoxygenated chars than that of conventional pyr-olysis. The nitrogen content is lower for the samples obtained in the presence of acid. Apparently phosphoric acid promotes the decom-position of nitrogen containing groups in the structure and turns into the gases (Kumar and Jena, 2016). There is no significant difference in the contents of hydrogen of the activated carbons. However, hydrogen content is markedly lower than that of the raw material. This indicates that most of hydrogen is converted to gas products during heat treat-ment processes. For example, this statetreat-ment is consistent with the FTIR results (reported in Section 3.3.), intensities of the band at 2800-3000 cm−1(aliphatic C─H groups) are significantly weak in the spectra of the activated carbons.
Table 2
BET surface area, pore volume and yield of the solids.
Sample ID Pre-treatment Heat treatment Surface area, m2/g
Micropore volume, cc/ga
Mesopore volume, cc/ga
Total pore volume at P/Po= 0.99, cc/g
Yieldb, %
WTR Carbonised at 450 °C 3.2 – – 0.007 36.3
WTC (with H3PO4) – Activated and carbonised
at 450 °C 1135 0.248 0.719 0.988 51.8 WTMW (with H3PO4) MW energy for 30 s.
Activated and carbonised at 450 °C
1255 0.279 0.762 1.067 46.0
a Micropore and mesopore volumes were calculated according to the NLDFT method. b
Yield, % = [(activated carbon (dry), g)/(precursor (dry), g)]×100.
Fig. 8. Adsorption/desorption isotherms of the activated carbon samples.
Fig. 9. Pore size distribution and cumulative pore volumes of the activated carbon samples.
Table 3
The ultimate analyses (dry-ash free) and ash contents of the raw and heat treated samples.
Sample ID C, % H, % N, % S, % Oa, % O/C Ash, %
WT 51.21 6.05 2.24 0.17 40.33 0.788 3.84 WTR 74.91 3.73 2.55 – 18.81 0.251 8.56 WTC 79.86 3.21 1.04 – 15.89 0.199 9.16 WTMW 83.71 3.10 1.36 – 11.83 0.141 8.95
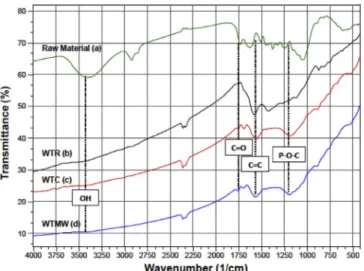
3.4. FTIR analysis
Fig. 10shows the FTIR spectra of the raw material, WTR, WTC and WTMW samples. In addition, the FTIR spectra of the raw material, microwave pretreated-30 s and WTMW samples are presented inFig. S1 to show the effect microwave pretreatment. It is apparent from the spectra that the surface functionalities are very sensitive to heat treat-ment. The raw material contained several oxygen functional groups, however the majority of these groups were partly or completely re-moved during the heat treatment processes. The broad band at 3100-3600 cm−1 corresponds to O─H stretching vibrations from alcohols, phenols and absorbed water. The stretching vibrations of aliphatic C─H groups (2800-3000 cm−1) are observed in the raw material. However, the bands at 1375 cm−1for the raw material and 1450 cm−1for the WTR are associated with aliphatic C─H stretching (Lladó et al., 2015). The peaks in the range of 1050–1740 cm−1for the waste tea (ethers, lactone, carboxyl) were significantly reduced after heat treatment process (Zielke et al., 1996). The new peaks observed in the WTC and WTMW samples in the same region indicate increasing aromaticity of the carbon in the addition of phosphoric acid (Sych et al., 2012). The absorption band at 1740 cm−1is ascribed to C═O stretching vibrations of conjugated carbonyl groups (carboxylic acid and lactone groups) (Gokce and Aktas, 2014). This peak has a lower intensity for the treated samples and is shifted to a higher wavenumber of 1755 cm−1. The peak in the 1560 -1680 cm−1region consists of two overlapped absorption bands, non-conjugated carbonyl groups at 1661 cm−1and highly con-jugated carbonyls (quinone groups) and/or C═C stretching vibrations in the aromatic ring at 1600 cm−1, respectively. After the activation and carbonisation processes, the combined peak in the region of 1560–1680 cm−1is observed in the samples WTC and WTMW as two distinct peaks. The bands associated to non-conjugated carbonyl groups and aromatic ring vibrations have shifted to 1694 cm−1 and 1590 cm−1, respectively. The peak at 1180 cm−1for phosphoric acid activated carbons can be assigned to the stretching vibration of hy-drogen-bonded P─O groups from phosphates or polyphosphates, to the O─C stretching vibration in the P─O─C (aromatic) linkage, and to P─OOH (Puziy et al., 2005). It is deduced from the FTIR spectra that most of the oxygen containing functional groups were removed from the lignocellulosic structure as results of heat treatment process.
3.5. XPS analyses
XPS analyses were performed to investigate the surface chemical characteristics of the samples (Fig. 11) and to evaluate how the pro-duction methods affected the surface functionalities of solid samples.
Determination the type of the surface functional groups and the changes in the amount of these groups would be helpful for the ex-amination of the gas product. The surface composition (atomic %) of the activated carbon samples were determined by using the peak area of each elements and the total peak area obtained by survey scan (Figs. S2–S4). According to survey scans, all the samples contain carbon, oxygen, nitrogen and phosphorus and carbon is the major element lo-cated on the surface. The oxygen content is considered to be the in-dicator of the presence of the surface functional groups and higher O/C ratio refers to hydrophilic surface character. The elemental composition and the O/C ratios of the samples obtained from XPS analysis are presented inTable 4.
As given inTable 4, there is no significant difference in the ele-mental compositions of WTC and WTMW (produced in presence of H3PO4) however the values for WTR are different compared to the WTC and WTMW. The results reported in the same table are different from those obtained by ultimate analysis (Table 3). Different values may be due to analysis methods applied. In the XPS analysis, x-rays can only access to a limited depth of the surface (a few nm), so the XPS analysis results cannot represent the overall chemical composition. Apparently activation in the presence of phosphoric acid causes decreases in the contents of nitrogen and oxygen. This may be ascribed to production of heat sensitive surface functional groups in the presence of H3PO4during the activation process. Because of the higher heat resistance char-acteristics of graphitic carbon structure, the removal of nitrogen and oxygen containing surface groups leads to an increase in the carbon content. The phosphorus content of the activated samples inTable 4is attributed to the phosphate linkages produced by the reaction of H3PO4 with the carbon skeleton or entrapped H3PO4molecules in the pores. These results are consistent with the FTIR analysis data. The phos-phorus content of WTR might be inherent material of the raw waste tea. As shown inFig. 11, C1s XPS spectra have an asymmetric shape suggested the existence of different carbon species. The deconvolution of the carbon spectra exhibited four peaks for the sample WTR andfive peaks for the samples WTC and WTMW at different binding energies (BE). Peak deconvolution of C1s spectra can be used for the identi fi-cation and the quantitative determination of the carbon containing surface functional groups. Type and the relative content of the surface functionalities obtained by C1s XPS spectra are tabulated inTable S3. The C═C/C─C sp2
peaks observed at 284.6 ± 0.2 eV for all samples were assigned to graphitic carbon structure. Beside C─C sp2
peaks, the activated samples contained C─C sp3peaks (285.5 ± 0.2) on the solid surfaces. The dominant sp2hybridisation and relatively mild sp3 hy-bridisation of carbon atoms correspond to degree of graphitisation or highly graphitic structure having limited defects and disorders (Tai et al., 2006;Aria et al., 2013). According to C1s spectra, the carbonised sample exhibited the lowest C─C sp2
structure (19.16%) but has the highest C─C sp3structure (59.73%). The graphitic structure contents of WTC and WTMW samples are 60.88% and 64.02%, respectively. The increase in the graphitic carbon content and the formation of the─C═O and O═C─O─ groups is most probably due to the impregnation of raw material with H3PO4and its oxidative effects.
The signal obtained at 286.6 ± 0.2 eV refers to the existence of ─C─O type structures in the form of hydroxyl, phenol, ether or phos-phorus complexes. As reported in FTIR analysis, the sample WTR did not contain─C─O type functional groups and these functional groups were not detected in XPS analysis as well. The peak at 287.4 ± 0.1 for WTR implies that carbon-oxygen double bonds occurs as quinonic or ketonic groups at the surface. Taking into account of the FTIR results, this peak can be assigned to highly conjugated quinone groups. On the other hand, the signal at 288.9 ± 0.1 eV is associated with carboxyl, ester, anhydride or lactone type surface groups. It is clear that the impregnation of the raw material with H3PO4inhibits the formation of C─O single bonds to some extent but promotes the development of O═C groups on the surface. The formation of the double bonded carbon-oxygen complexes mainly depends on the interaction between the raw
material and phosphoric acid. The signals observed at 291.2 ± 0.2 eV and 293.2 ± 0.1 are originated from theπ-π* shake up satellite in aromatic rings for the samples WTR, WTC and WTMW, respectively.
4. Conclusions
Substantial changes were observed in the gas and solid products with and without phosphoric acid during heat treatment processes. The decomposition mechanism strongly depends on the presence of phos-phoric acid. Phosphos-phoric acid causes a shift in the gas release
temperature to a lower level for CO, CO2and C2H4. The GC analyses showed that the amounts of gases obtained from WTC and WTMW were lower when compared with the sample WTR (without phosphoric acid). The yields of solid products obtained in the presence of the acid are significantly higher for the samples WTC (51.8%) and WTMW (46.0%) than that of the solid produced (36.3% for the sample WTR) in the absence of the acid. High solid yields are evidence that the formation of tar is suppressed by the addition of phosphoric acid.
Although the microwave pretreatment period is short (30 s), several decomposition reactions take place much faster if there is phosphoric acid in the mixture. The majority of oxygen containing functional groups is removed during heat treatment process. Phosphoric acid promotes aromatic structure as a result of sp2hybridisation.
Acknowledgements
The authors gratefully acknowledge the support of The Scientific and Technological Research Council of Turkey (TUBITAK), Turkey, for this research (Project No. 109M400). We also express our appreciation to Prof. Dr. Ali Sinag, Department of Chemistry, Ankara University,
Fig. 11. XPS spectra of the solids.
Table 4
Elemental composition of the solid samples obtained from XPS analysis.
Sample ID Atomic, %
C N O P O/C
WTR 84.13 2.83 12.36 0.68 0.137
WTC 85.98 1.65 10.54 1.83 0.113
Turkey, for the Micro GC Analysis. Appendix A. Supplementary data
Supplementary data to this article can be found online athttps:// doi.org/10.1016/j.jenvman.2018.09.046.
References
Arami-Niya, A., Daud, W.M.A.W., Mjalli, F.S., Abnisa, F., Shafeeyan, M.S., 2012. Production of microporous palm shell based activated carbon for methane adsorp-tion: modeling and optimization using response surface methodology. Chem. Eng. Res. Des. 90 (6), 776–784.
Aria, A.I., Guittet, M., Gharib, M., 2013. Use of vertically aligned carbon nanotubes for electrochemical double-layer capacitors. In: Morris, J.E., Iniewski, K. (Eds.), Nanoelectronic Device Applications Handbook. CRC Press, Taylor & Francis, Boca Raton, FL, pp. 445–456.
Dias, J.M., Alvim-Ferraz, M.C., Almeida, M.F., Rivera-Utrilla, J., Sánchez-Polo, M., 2007. Waste materials for activated carbon preparation and its use in aqueous-phase treatment: a review. J. Environ. Manag. 85 (4), 833–846.
Dobele, G., Meier, D., Faix, O., Radtke, S., Rossinskaja, G., Telysheva, G., 2001. Volatile products of catalyticflash pyrolysis of celluloses. J. Anal. Appl. Pyrolysis 58, 453–463.
Dobele, G., Rossinskaja, G., Telysheva, G., Meier, D., Faix, O., 1999. Cellulose dehydra-tion and depolymerizadehydra-tion reacdehydra-tions during pyrolysis in the presence of phosphoric acid. J. Anal. Appl. Pyrolysis 49 (1), 307–317.
Dominguez, A., Menéndez, J.A., Fernandez, Y., Pis, J.J., Nabais, J.V., Carrott, P.J.M., Carrott, M.R., 2007. Conventional and microwave induced pyrolysis of coffee hulls for the production of a hydrogen rich fuel gas. J. Anal. Appl. Pyrolysis 79 (1–2), 128–135.
Evans, R., Tarazona, P., 1984. Theory of condensation in narrow capillaries. Phys. Rev. Lett. 52 (7), 557–560.
Fadhil, A.B., Dheyab, M.M., Abdul-Qader, A.Y., 2012. Purification of biodiesel using ac-tivated carbons produced from spent tea waste. J. Assoc. Arab. Univ. Basic. Appl. Res. 11, 45–49.
Ferdous, D., Dalai, A.K., Bej, S.K., Thring, R.W., Bakhshi, N.N., 2001. Production of H2 and medium Btu gas via pyrolysis of lignins in afixed-bed reactor. Fuel Process. Technol. 70 (1), 9–26.
Ferrera-Lorenzo, N., Fuente, E., Suárez-Ruiz, I., Gil, R.R., Ruiz, B., 2014a. Pyrolysis characteristics of a macroalgae solid waste generated by the industrial production of Agar-Agar. J. Anal. Appl. Pyrolysis (105), 209–216.
Ferrera-Lorenzo, N., Fuente, E., Bermúdez, J.M., Suárez-Ruiz, I., Ruiz, B., 2014b. Conventional and microwave pyrolysis of a macroalgae waste from Agar-Agar in-dustry. Prospects for bio-fuel production. Bioresour. Technol. 151, 199–206.
Foo, K.Y., Hameed, B.H., 2012. Textural porosity, surface chemistry and adsorptive properties of durian shell derived activated carbon prepared by microwave assisted NaOH activation. Chem. Eng. J. 187, 53–62.
Gao, Y., Yue, Q., Gao, B., Sun, Y., Wang, W., Li, Q., Wang, Y., 2013. Preparation of high surface area-activated carbon from lignin of papermaking black liquor by KOH ac-tivation for Ni (II) adsorption. Chem. Eng. J. 217, 345–353.
Gokce, Y., Aktas, Z., 2014. Nitric acid modification of activated carbon produced from waste tea and adsorption of methylene blue and phenol. Appl. Surf. Sci. 313, 352–359.
González-García, P., Centeno, T.A., Urones-Garrote, E., Ávila-Brande, D., Otero-Díaz, L.C., 2013. Microstructure and surface properties of lignocellulosic-based activated car-bons. Appl. Surf. Sci. 265, 731–737.
Gurten, I.I., Ozmak, M., Yagmur, E., Aktas, Z., 2012. Preparation and characterisation of activated carbon from waste tea using K2CO3. Biomass Bioenergy 37, 73–81.
Hared, I.A., Dirion, J.L., Salvador, S., Lacroix, M., Rio, S., 2007. Pyrolysis of wood im-pregnated with phosphoric acid for the production of activated carbon: kinetics and porosity development studies. J. Anal. Appl. Pyrolysis 79 (1), 101–105.
Inal, I.I.G., Holmes, S.M., Banford, A., Aktas, Z., 2015. The performance of supercapacitor electrodes developed from chemically activated carbon produced from waste tea. Appl. Surf. Sci. 357, 696–703.
Islam, M.A., Ahmed, M.J., Khanday, W.A., Asif, M., Hameed, B.H., 2017. Mesoporous activated coconut shell-derived hydrochar prepared via hydrothermal carbonization-NaOH activation for methylene blue adsorption. J. Environ. Manag. 203, 237–244.
Jagtoyen, M., Derbyshire, F., 1993. Some considerations of the origins of porosity in carbons from chemically activated wood. Carbon 31 (7), 1185–1192.
Jagtoyen, M., Derbyshire, F., 1998. Activated carbons from yellow poplar and white oak by H3PO4activation. Carbon 36 (7–8), 1085–1097.
Kumar, A., Jena, H.M., 2016. Preparation and characterization of high surface area ac-tivated carbon from Fox nut (Euryale ferox) shell by chemical activation with H3PO4. Results Phys. 6, 651–658.
Li, Y., Zhang, X., Yang, R., Li, G., Hu, C., 2015. The role of H3PO4in the preparation of
activated carbon from NaOH-treated rice husk residue. RSC Adv. 5 (41), 32626–32636.
Liu, Q., Wang, S., Zheng, Y., Luo, Z., Cen, K., 2008. Mechanism study of wood lignin pyrolysis by using TG–FTIR analysis. J. Anal. Appl. Pyrolysis 82 (1), 170–177.
Lladó, J., Lao-Luque, C., Ruiz, B., Fuente, E., Solé-Sardans, M., Dorado, A.D., 2015. Role of activated carbon properties in atrazine and paracetamol adsorption equilibrium and kinetics. Process Saf. Environ. Protect. 95, 51–59.
Lv, G., Wu, S., 2012. Analytical pyrolysis studies of corn stalk and its three main com-ponents by TG-MS and Py-GC/MS. J. Anal. Appl. Pyrolysis 97, 11–18.
Molina-Sabio, M., Rodrıguez-Reinoso, F., 2004. Role of chemical activation in the de-velopment of carbon porosity. Colloids Surf., A 241 (1), 15–25.
Nabais, J.V., Laginhas, C., Carrott, M.R., Carrott, P.J.M., Amorós, J.C., Gisbert, A.N., 2013. Surface and porous characterisation of activated carbons made from a novel biomass precursor, the esparto grass. Appl. Surf. Sci. 265, 919–924.
Nowakowski, D.J., Woodbridge, C.R., Jones, J.M., 2008. Phosphorus catalysis in the pyrolysis behaviour of biomass. J. Anal. Appl. Pyrolysis (2), 197–204.
Peláez-Cid, A.A., Herrera-González, A.M., Salazar-Villanueva, M., Bautista-Hernández, A., 2016. Elimination of textile dyes using activated carbons prepared from vegetable residues and their characterization. J. Environ. Manag. 181, 269–278.
Puziy, A.M., Poddubnaya, O.I., Martínez-Alonso, A., Suárez-García, F., Tascón, J.M., 2005. Surface chemistry of phosphorus-containing carbons of lignocellulosic origin. Carbon 43 (14), 2857–2868.
Ronsse, F., Nachenius, R.W., Prins, W., 2015. Carbonization of biomass. In: Pandey, A., Bhaskar, T., Stöcker, M., Sukumaran, R. (Eds.), Recent Advances in Thermochemical Conversion of Biomass. Elsevier, pp. 293–324.
Rufford, T.E., Hulicova-Jurcakova, D., Khosla, K., Zhu, Z., Lu, G.Q., 2010. Microstructure and electrochemical double-layer capacitance of carbon electrodes prepared by zinc chloride activation of sugar cane bagasse. J. Power Sources 195 (3), 912–918.
Solum, M.S., Pugmire, R.J., Jagtoyen, M., Derbyshire, F., 1995. Evolution of carbon structure in chemically activated wood. Carbon 33 (9), 1247–1254.
Somasundaram, S., Sekar, K., Gupta, V.K., Ganesan, S., 2013. Synthesis and character-ization of mesoporous activated carbon from rice husk for adsorption of glycine from alcohol-aqueous mixture. J. Mol. Liq. 177, 416–425.
Song, M., Jin, B., Xiao, R., Yang, L., Wu, Y., Zhong, Z., Huang, Y., 2013. The comparison of two activation techniques to prepare activated carbon from corn cob. Biomass Bioenergy 48, 250–256.
Sych, N.V., Trofymenko, S.I., Poddubnaya, O.I., Tsyba, M.M., Sapsay, V.I., Klymchuk, D.O., Puziy, A.M., 2012. Porous structure and surface chemistry of phosphoric acid activated carbon from corncob. Appl. Surf. Sci. 261, 75–82.
Tai, F.C., Lee, S., Wei, C.H., Tyan, S.L., 2006. Correlation between ID/IG Ratio from visible Raman spectra and sp2/sp3ratio from XPS spectra of annealed hydrogenated DLCfilm. Mater. Trans. 47, 1847–1852.
Thommes, M., Kaneko, K., Neimark, A.V., Olivier, J.P., Rodriguez-Reinoso, F., Rouquerol, J., Sing, K.S., 2015. Physisorption of gases, with special reference to the evaluation of surface area and pore size distribution (IUPAC technical report). Pure Appl. Chem. 87 (9–10), 1051–1069.
Tiryaki, B., Yagmur, E., Banford, A., Aktas, Z., 2014. Comparison of activated carbon produced from natural biomass and equivalent chemical compositions. J. Anal. Appl. Pyrolysis. 105, 276–283.
Wang, S., Wang, K., Liu, Q., Gu, Y., Luo, Z., Cen, K., Fransson, T., 2009. Comparison of the pyrolysis behavior of lignins from different tree species. Biotechnol. Adv. 27 (5), 562–567.
Wu, F.C., Wu, P.H., Tseng, R.L., Juang, R.S., 2011. Preparation of novel activated carbons from H2SO4-pretreated corncob hulls with KOH activation for quick adsorption of dye and 4-chlorophenol. J. Environ. Manag. 92 (3), 708–713.
Yagmur, E., 2012. Preparation of low cost activated carbons from various biomasses with microwave energy. J. Porous Mater. 19 (6), 995–1002.
Yagmur, E., Ozmak, M., Aktas, Z., 2008. A novel method for production of activated carbon from waste tea by chemical activation with microwave energy. Fuel 87 (15), 3278–3285.
Yagmur, E., Tunc, M.S., Banford, A., Aktas, Z., 2013. Preparation of activated carbon from auto hydrolysed mixed southern hardwood. J. Anal. Appl. Pyrolysis 104, 470–478.
Yang, H., Yan, R., Chen, H., Lee, D.H., Zheng, C., 2007. Characteristics of hemicellulose, cellulose and lignin pyrolysis. Fuel 86 (12), 1781–1788.
Zielke, U., Hüttinger, K.J., Hoffman, W.P., 1996. Surface-oxidized carbon fibers: I. surface structure and chemistry. Carbon 34 (8), 983–998.
Zyoud, A., Nassar, H.N., El-Hamouz, A., Hilal, H.S., 2015. Solid olive waste in environ-mental cleanup: enhanced nitrite ion removal by ZnCl2-activated carbon. J. Environ. Manag. 152, 27–35.
Zuo, S., Xiao, Z., Yang, J., 2012. Evolution of gaseous products from biomass pyrolysis in the presence of phosphoric acid. J. Anal. Appl. Pyrolysis 95, 236–240.
Zuo, S., Yang, J., Liu, J., 2010. Effects of the heating history of impregnated lig-nocellulosic material on pore development during phosphoric acid activation. Carbon 48 (11), 3293–3295.
Zuo, S., Yang, J., Liu, J., Cai, X., 2009. Significance of the carbonization of volatile pyrolytic products on the properties of activated carbons from phosphoric acid ac-tivation of lignocellulosic material. Fuel Process. Technol. 90 (7), 994–1001.