THE ROLE OF COLOR IN DETERMINING VISUAL COMPLEXITY
IN ABSTRACT IMAGES
A Ph.D. Dissertation by RENGİN ASLANOĞLU The Department ofInterior Architecture and Environmental Design İhsan Doğramaci Bilkent University
Ankara September 2019
THE ROLE OF COLOR IN DETERMINING VISUAL COMPLEXITY
IN ABSTRACT IMAGES
The Graduate School of Economics and Social Sciences of
İhsan Doğramacı Bilkent University
by
RENGİN ASLANOĞLU
In Partial Fulfillment of the Requirements for the Degree of DOCTOR OF PHILOSPHY IN INTERIOR ARCHITECTURE AND
ENVIRONMENTAL DESIGN
THE DEPARTMENT OF INTERIOR ARCHITECTURE AND ENVIRONMENTAL DESIGN
İHSAN DOĞRAMACI BİLKENT UNIVERSITY ANKARA
iii
ABSTRACT
THE ROLE OF COLOR IN DETERMINING VISUAL COMPLEXITY IN ABSTRACT IMAGES
Aslanoğlu, Rengin
Ph. D., Department of Interior Architecture and Environmental Design Supervisor: Assoc. Prof. Dr. Nilgün Olguntürk
September 2019
Colors are important elements of everyday environment as they effect every part of our daily life including our physiology, psychology, well- being, perception,
cognition, and etc. Colors are experienced and encountered in everyday environment and they are never seen in isolation since the environment which surrounds us presents the colors together with other colors (Kocaoğlu & Olguntürk, 2018). The thesis searches the association between color, visual complexity and visual interest in abstract images without isolating colors from each other, as previous studies did. Thus, the aim of this thesis is to understand the role of color on visual complexity and visual interest in abstract images in order to develop a theoretical measure that merges both scientific and artistic approaches of color. This study is conducted to find the level of visual complexity which makes an image visually interesting and the role of color within this phenomenon by using Delta E (ΔE) values of colors in abstract images. As the results of the study indicated, there was an inverted U- curve relationship between average Delta E values and both visual interest and visual complexity in abstract images.
iv
ÖZET
RENGİN SOYUT İMAJLARDAKİ GÖRSEL KARMAŞIKLIK ÜZERİNDEKİ ROLÜ
Aslanoğlu, Rengin
Doktora, İç Mimarlık ve Çevre Tasarımı Bölümü Tez Danışmanı: Doç. Dr. Nilgün Olguntürk
Eylül 2019
Renkler, fizyoloji, psikoloji, refah, algı, biliş vb. olmak üzere günlük hayatımızın her bölümünü etkilediği için günlük çevrenin önemli unsurlarındandır. Her gün
etrafımızı çevreleyen ortamlarda renklerle karşılaşmaktayız ve bu ortamlarda renkler bir bütün halindedir (Kocaoğlu & Olguntürk, 2018). Önceki çalışmalar, renkleri birbirinden ayırarak renk parçaları kullanmışlardır. Bu tez, önceki çalışmaların aksine renkleri birbirinden izole etmeden, soyut imajlarda renk, görsel karmaşıklık ve görsel ilgi arasındaki ilişkiyi araştırmaktadır. Bu nedenle, tez, rengin hem bilimsel hem de sanatsal yaklaşımlarını birleştirmek için teorik bir ölçü geliştirmek amacıyla, rengin görsel karmaşıklık ve görsel ilgiyi üzerindeki rolünü anlamayı
amaçlamaktadır. Bu çalışma, imajları görsel olarak ilginç kılan görsel karmaşıklık düzeyini ve soyut imajlardaki renklerin Delta E (ΔE) değerlerini kullanarak bu görüngü içindeki rengin rolünü bulmak için yapılmıştır. Çalışmanın sonuçlarına göre, ortalama Delta E değerleri ile soyut imajlarda hem görsel ilgi hem de görsel
karmaşıklık arasında ters U-eğrisi ilişkisi bulunmuştur.
v
ACKNOWLEDGEMENT
I would like to thank my supervisor Assoc. Prof. Nilgün Olguntürk for her valuable support throughout my Ph.D. study. I am also honored to thank my committee members Asst. Prof. Dr. Burçak Altay and Assoc. Prof. Hüseyin Boyacı for their contributions, critical comments and motivation during the preparation of this thesis. I am grateful to Asst. Prof. Dr. İpek Memikoğlu and Asst. Prof. Dr. Elif Güneş for their contributions and comments for the finalization of the thesis. Also I would like to thank Prof. Dr. Halime Demirkan for her patience, advices and valuable help throughout the process of the thesis.
I am also thankful to my beloved family, Figen Kocaoğlu, Ertuğrul Kocaoğlu, Hakan Kocaoğlu, Merve Kocaoğlu and Hüseyin Aslanoğlu for their support, without them my research studies could not be completed.
In addition, special thanks to my dear friends Melis Kocaoğlu and Reyyan Okutan for their encouragement and moral support.
vi
TABLE OF CONTENTS
ABSTRACT ... iii ÖZET... iv ACKNOWLEDGEMENT ... v TABLE OF CONTENTS ... viLIST OF TABLES ... viii
LIST OF FIGURES ……….. ix
CHAPTER 1: INTRODUCTION ... 1
1.1. Aim of the Study ... 3
1.2. The General Structure of the Thesis ... 5
CHAPTER 2: VISUAL COMPLEXITY ... 8
2.1. Definition of Complexity ... 12
2.2. Measuring Visual Complexity ... 17
2.3. Dimensions of Visual Complexity ... 34
CHAPTER 3: COLOR ... 43
3.1. Basics of Color ... 45
3.2. Color Schemes ... 46
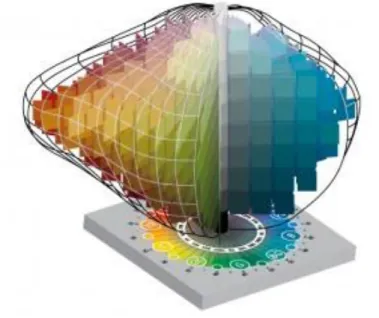
3.3. Color Systems ... 52
3.3.1. Munsell Color System ... 52
3.3.2. Natural Color System ... 60
3.3.3. RGB Color Model ... 66
3.3.4. CIELAB ... 71
3.4. Measuring Color- Delta E ... 77
3.5. Color in Built Environment ... 79
CHAPTER 4 : EXPERIMENTAL STUDY ... 86
4.1. Aim of Study ... 86
4.1.1. Research Questions ... 88
4.1.2. Hypotheses ... 90
4.2. Methodology- Part 1 ... 91
4.2.1. Specifying the Abstract Images ... 91
4.2.2. Evaluating the Abstract Images with K-Mean ... 93
4.2.3. Preparing the Questionnaire ... 95
4.2.4. Sample Group ... 96
4.3. Conducting the Experiment ... 97
vii
4.4.1. Analyzing the Kandinsky’s Composition 8 and Preparing the
generated abstract image ... 98
4.4.2. Preparing the Questionnaire ... 104
4.4.3. Sample Group ... 104
4.5. Conducting the Experiment Part 2 ... 105
CHAPTER 5 : DATA ANALYSIS OF THE EXPERIMENTAL STUDIES ... 107
5.1. Results of the Experiment- Part 1 ... 107
5.2. Results of the Experiment- Part 2 ... 110
CHAPTER 6 : DISCUSSION ... 117 6.1. Discussion of Part 1 ... 119 6.2. Discussion of Part 2 ... 124 CHAPTER 7 : CONCLUSION ... 131 REFERENCES ... 135 APPENDICES ... 149
viii
LIST OF TABLES
Table 1 Dimensions of visual complexity (Roberts, 2007) ... 37
Table 2 Fundamental studies about visual complexity (Table created by Rengin Aslanoğlu) ... 39
Table 3 Questions of questionnaire ... 96
Table 4 Number of participants ... 97
Table 5 Number of participants ... 105
Table 6 K- Mean Color Clustering results and participant ratings (5 point likert- scale- 5 is the most and 1 is the least value) of all four abstract images ... 109
Table 7 Association between Delta E Values and human perception ... 111
Table 8 The 19 generated abstract images using the colors from 6 different zones of CIE Chromaticity Chart and their Average ΔE, Visual Interest and Visual Complexity values ... 113
ix
LIST OF FIGURES
Figure 1. Graph showing the relationship between preference, interest and
complexity level (Forsythe, Nadal, Sheehy, Cela‐Conde & Sawey, 2011, p.
51) ... 15
Figure 2. Model of aesthetic appreciation and aesthetic judgments (Leder & Nadal, 2004) ... 20
Figure 3. Polygons preferences of art students (Left) and polygons preferences of students without art education (Right) (Eysenck & Castle, 1970) ... 25
Figure 4. Dimensions of visual complexity (illustrated by Rengin Aslanoğlu) ... 38
Figure 5. Achromatic Color Scheme ... 47
Figure 6. Monochromatic Color Scheme ... 47
Figure 7. Analogous Color Scheme ... 48
Figure 8. An example of Analogous Color Scheme... 48
Figure 9. Complementary Color Scheme ... 49
Figure 10. An example of Complementary Color Scheme ... 49
Figure 11. Split- Complementary Color Scheme ... 50
Figure 12. An example of Split- Complementary Color Scheme ... 50
Figure 13. Triadic Color Scheme ... 51
Figure 14. An example of Triadic Color Scheme ... 51
Figure 15. Tetradic Color Scheme ... 51
Figure 16. An example of Tetradic Color Scheme... 52
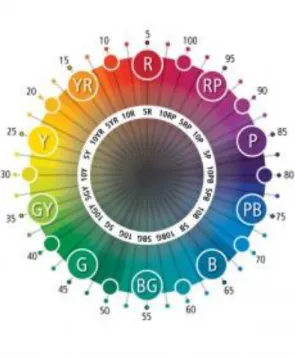
Figure 17. Munsell Hue Designation Circle ... 53
Figure 18. Munsell Color Solid ... 55
Figure 19. Munsell Value ... 56
Figure 20. Munsell Chroma ... 57
Figure 21. Examples of Munsell Color System ... 58
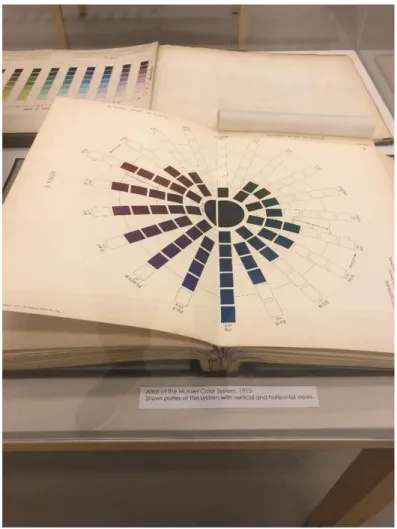
Figure 22. Atlas of the Munsell Color System dated 1915 ... 59
Figure 23. NCS Color Space ... 62
Figure 24. NCS Color Circle ... 63
Figure 25. NCS Color Triangle ... 64
Figure 26. NCS Color Sample... 64
Figure 27. NCS Color Atlas ... 65
x
Figure 29. RGB lights together ... 67
Figure 30. RGB color wheel ... 68
Figure 31. Value of pure red according to RGB Color Model ... 69
Figure 32. Wavelengths of red, blue and green (in nm) ... 70
Figure 33. RGB chromaticity chart showing wavelengths of red, blue and green colors ... 70
Figure 34. An example for the mixture of green and red ... 71
Figure 35. CIE chromaticity chart ... 72
Figure 36. The CIELAB Color Space ... 73
Figure 37. The CIELAB three-dimensional color space ... 74
Figure 38. The Chromaticity Chart within the Wide Gamut RGB (shown with white triangle) and an example of a color sample (R: 254, G: 172, B: 40) (Figure captured by Rengin Aslanoğlu) ... 77
Figure 39. Stairs (by Steven Massart) ... 82
Figure 40. Graph showing the framework of experiments (illustrated by Rengin Aslanoğlu) ... 88
Figure 41. Ocean 5 by Piet Mondrian ... 92
Figure 42. Composition No. VII by Piet Mondrian ... 92
Figure 43. Composition 8 by Vasily Kandinsky ... 93
Figure 44. Decisive Rose by Vasily Kandinsky ... 93
Figure 45. The original Composition 8 (top) and the generated abstract image (bottom) ... 101
Figure 46. The CIE Chromaticity Chart and 6 zones ... 102
Figure 47. The 19 generated abstract images colored according to the zones in the CIE Chromaticity Chart ... 103
Figure 48. Photo taken by the researcher showing the experimental setup for Experiment- Part 2 ... 106
Figure 49. Photo taken by the researcher during Experiment- Part 2 ... 106
Figure 50. The theoretical framework developed by the thesis (illustrated by Rengin Aslanoğlu) ... 118
Figure 51. Abstract image: 1-2 (Left) and 1-3 (Right) ... 127
Figure 52. Abstract image: 5-6 (Left) and 6-5 (Right) ... 128
1
CHAPTER 1
INTRODUCTION
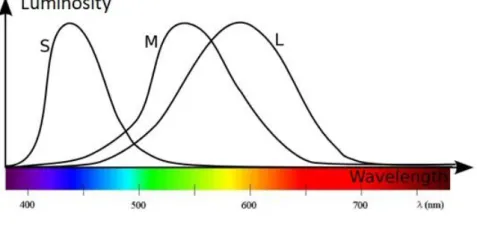
Colors are the important elements of everyday environment as they effect every part of our daily life including our physiology, psychology, well- being, perception, cognition, and etc., it is the indispensable part of human visual experience and aesthetic judgement (Moller & Hurlbert, 1997). Studies showed that people with normal trichromatic color vision have a strong color detection and discrimination abilities (Gegenfurtner & Rieger, 2000) and proved that color is what the eye sees best (Chaparro, Huang, Kronauer & Eskew, 1993). Thus, color is an important visual bond that constitutes emotional, physical and sensorial relations between people and their environment (Ulusoy & Olguntürk, 2016). Having an understanding of visual complexity, visual interest and color can help analyze and explain human perception system by clarifying the uncertainty of the role of color in visual complexity
perception.
Every person with normal vision system experiences and encounters with color in their everyday environment and colors are never seen in isolation since the
2
(Kocaoğlu & Olguntürk, 2018). Most of the well-known color studies researching about the effects of color on human psychology, physiology, as well as examine the effects of emotion, mood, attention, and well-being used isolated color patches which might be lacking in reflecting the dominating factors such as the effect of different color compositions on human visual perception (Ladau, Smith & Place, 1988; Mahnke, 1996; Valdez & Mehrabian, 1994). There are limited number of studies examining color, visual complexity and visual interest together and this study attempted to bring a new understanding to the association between color, visual complexity and visual interest since the complexity of an image expresses many aspects of its content and is an important factor in visual interest (Kocaoğlu & Olguntürk, 2018).
Complexity studies’ results differ a lot since they manipulated all of the complexity dimensions without considering the dimensions’ appropriateness to the related
factors (Nadal, Munar, Marty & Cela-conde, 2010). The first part of this study were framing the dimensions of visual complexity by focusing only on; intelligibility, organization, and variety of colors in abstract images. Abstract images were selected for evaluating the association between color, visual interest and visual complexity since a visual language is composed in those images by just using line, form, shape, and color which makes it universal and culture-independent. For the first part of this study, Piet Mondrian’s two abstract paintings; Ocean 5 and Composition No. VII and Vasily Kandinsky’s two abstract paintings; Composition 8 and Decisive Rose were selected. As the first part of the thesis result showed, the second part of the study found the dominating dimension of complexity and searched further about the role of color in visual complexity by using a generated abstract image. In order to have an in
3
depth knowledge about the relationship between color, visual complexity and visual interest, an abstract image was generated and colored according to various color schemes; monochromatic, analogous, split-complementary, complementary, triadic and tetradic. Those color schemes are used by designers and artists and are mostly intuitive in their works and described qualitatively (Kocaoğlu Aslanoğlu &
Olguntürk, 2019).
1.1. Aim of the Study
The aim of this study is to understand the association between color, visual complexity and visual interest in abstract images for developing a theoretical measure in order to merge both scientific and artistic approaches of color. By merging objective and subjective methods, a better understanding of visual
complexity and visual interest can be obtained. With the aim of building a theoretical measure for the association between color, visual complexity and visual interest, two interconnected experiments were conducted.
The first part aimed to find the most effective visual complexity dimensions about color and the related research questions of the first experiment are:
RQ1.1. How do intelligibility of colors in abstract images effect visual complexity and visual interest?
RQ1.2. How do organization of colors in abstract images effect visual complexity and visual interest?
4
RQ1.3. How do variety of colors in abstract images effect visual complexity and visual interest?
Also, the first part of the experiment aimed to find the association between visual complexity and visual interest with the research question mentioned above:
RQ1.4. Is there a relationship between visual complexity and visual interest in abstract images?
Hypotheses for the first experiment are:
H1.1. As intelligibility of colors in an abstract image increase, visual complexity and visual interest will also increase until there is over unintelligibility where both will decrease.
H1.2. As difficulty in distinguishing the rules used in images increase, visual complexity and visual interest will also increase.
H1.3. As the variety of colors used in abstract images increase, visual complexity and visual interest will both increase.
The hypothesis for finding the association between visual complexity and visual interest:
H1.4. There is an inverted U- curve relationship between visual complexity and visual interest in abstract images.
The second part aimed to develop a theoretical measure for understanding the role of color in visual complexity and visual interest in abstract images by using perceived
5
total color difference (Delta E) and the research questions of the second experiment are:
RQ2.1. How do the perceived total color difference (Delta E) values of colors used in an abstract image effect the perception of visual complexity?
RQ2.2. How do the perceived total color difference (Delta E) values of colors used in an abstract image effect the perception of visual interest?
Hypotheses for the second experiment are:
H.2.1. As the average perceived total color difference (Delta E) values of colors in an abstract image increases, visual complexity will increase until a threshold where visual complexity start to decrease.
H.2.2. As the average perceived total color difference (Delta E) values of colors in an abstract image increases, visual interest will increase until a threshold where visual interest start to decrease.
1.2. The General Structure of the Thesis
This thesis consists of seven chapters. The first chapter consists the aim, research questions and hypotheses of the thesis. Also, the first chapter is giving information about the general structure of the thesis by giving descriptions of every chapter.
The second chapter of the thesis is about visual complexity. It contains definition of complexity, its further details and how to measure visual complexity with a
6
compilation of previous studies. In addition, this chapter presents dimensions of visual complexity with prior experimental studies and their various measurement methodologies.
The third chapter is about color. Basics of color and different color order systems; Munsell Colour System, NCS (Natural Color System), CIELAB and RGB Color Model are explained in detail. Then, the relationship between color and visual complexity is discussed referring to prior studies.
The forth chapter describes the experimental study with its aims, research questions, hypotheses, methodologies of Part 1 and Part 2, and related procedures such as evaluation of abstract images with K- Mean, preparing the questionnaires and related details. This chapter finishes with the expanded explanation of procedures of the experiments; Part 1 and Part 2.
The fifth chapter includes the results and their data analysis with Statistical Package for the Social Sciences (SPSS). Both the results and statistical analysis of Part 1 and Part 2 presented in tables and graphs in this chapter.
Discussion of the results of the experiments and their relation to previous studies are stated in the sixth chapter. This chapter describes the findings of the experiments in detail with referring to prior studies and puts forward novel explanations about the association between color, visual complexity and visual interest.
7
The last chapter is a conclusion of the thesis with a brief summary of the study and suggestions for further research. All visual and written documents and detailed statistical charts of the study are included in the appendices.
8
CHAPTER 2
VISUAL COMPLEXITY
Complexity without order produces confusion. Order without complexity causes boredom. (Arnheim, 1966, p. 124)
People constantly and automatically recognize, recall, memorize, attribute and evaluate, in other words they always process information coming from their environment (Kocaoğlu & Aslanoğlu, 2018). The fluency of this processing is mainly determined by the extent the perceived stimuli are complex (Miniukovich & De Angeli, 2014). The scene that enters the visual field requires a certain amount of effort to process, and this processing can range from highly effortful to quite
effortless (Alter & Oppenheimer, 2009). For example, while looking around in an interior space containing very few objects, it makes instinctive sense to think that seeing the interior will require considerably less effort than perceiving a cluttered interior space with many objects since it is visually complex (Orth & Wirtz, 2014). Hence visual complexity establishes an essential part of peoples' environment and is an inseparable part of information processing (Marin & Leder, 2016).
9
Visual complexity is not a uniform concept; its multidimensional nature has been acknowledged with regard to human vision and cognition system, high-level image understanding and recognition problems. Its multidimensionality consists content-based image retrieval, image clustering and classification, computer graphics, web pages, as well as aesthetic classification of natural scenes, abstract patterns, and artworks (Yu & Winkler, 2013). Visual complexity is described by factors such as the number and variety of elements (diversity of elements), their disorganization, as well as the degree of symmetry (Berlyne, Ogilvie & Parham, 1968; Chipman, 1977; Ichikawa, 1985; Nadal, Munar, Marty & Cela-conde, 2010). One of the dominating factors of visual complexity is the number and variety of elements (Berlyne, Ogilvie & Parham, 1968; Nadal, Munar, Marty & Cela-conde, 2010). While the abstract patterns, simple figures or faces are being explored, symmetry is often studied as an independent factor of complexity (Day, 1967; Eisenman, 1968; Gartus & Leder, 2013; Jacobsen & Höfel, 2002; Tinio, Gerger & Leder, 2013).
As Reber, Schwarz & Winkielman, (2004) pointed out; visual complexity depends on individual perceptual organization, previous experiences and knowledge. Berlyne (1971) clearly stated that the hedonic value of a stimulus was not directly determined by objective complexity (the amount or degree of complexity physically present in a stimulus) features, but by subjective complexity (the subject's perception of the complexity of the stimulus in a stimulus). Thus, every individual perceives
complexity depending on the way he or she perceptually organizes the scene, i.e. it is about how each individual organizes the elements in a stimulus in order to form a coherent and clear scene (Hogeboom & van Leeuwen, 1997). As Berlyne (1974, p.19) mentioned;
10
“The collative variables are actually subjective, in the sense that they depend on the relations between physical and statistical properties of stimulus objects and processes within the organism. A pattern can be more novel, complex, or ambiguous for one person than for another or, for the same person, at one time than at another. Nevertheless, many experiments, using rating scales and other techniques, have confirmed that collative properties and subjective informational variables tend, as one would expect, to vary concomitantly with the corresponding objective measures of classical information theory”.
As stated above, the collative variables compare the incoming information with the existing knowledge and experiences for detecting potentially interesting stimulus. Berlyne (1960) defined “interesting” with collative variables. Collative variables do not affect interest directly, however they control pleasure and arousal which are the necessities for having motivation to explore the incoming information. According to Berlyne’s theory (1960) either high or low arousal potential level does not maximize rewarding and explained as such; “moderate arousal potential will be maximally rewarding” (p. 201). On the other hand the mentioned moderate level also depends on different factors such as; ecological variables which are the variables that related to the significance and relations to environmental objects (Palmer, Schloss & Sammartino, 2013) and psychophysical variables which are related to perceptions evoked by the sensory dimensions of the stimulus.
Berylne (1960) introduced the principle of unity in diversity (organization of the incoming stimulus) while putting his theory about arousal. He relates diversity to the
11
two factors that establish complexity which are heterogeneity (being uneven) and numerosity (having many parts) of elements, however argues that diversity can also cause novelty (the familiarity or unfamiliarity of the stimulus according to observer’s previous experiences), ambiguity (uncertainty, having numerous alternatives), and surprise (existence of something unexpected in the stimulus). In contrast, the principle of unity is proposed to temperate or reduce arousal levels (Berlyne, 1960; Van Geert & Wagemans, 2019). Post, Blijlevens & Hekkert (2016) defined the principle of unity-in-variety as “the maximization of both unity and variety, in order to achieve a balance that offers the greatest aesthetic appreciation” (p. 142). They (2016) studied their theories about unity and variety of being the partial opposites while instantaneously contributing of aesthetic appreciation which is the valuing of a stimulus that has a perceptual paradigm (Lopes, 2014). As their results stated; “there is an asymmetrical relationship between unity and variety, in the sense that the appreciation of variety is dependent on the presence of unity, whereas unity can be appreciated independently of variety” (Van Geert & Wagemans, 2019). Thus,
without unity, appreciation of variety cannot occur. Another study of Post, Nguyen & Hekkert (2017) about webpage aesthetics showed that aesthetic appreciation is influenced by both unity and variety. Unity and variety independently and positively have an impact on aesthetic appreciation which instantaneously maximizes unity. Also variety leads to an ideal stability where aesthetic appreciation is the highest. However, as a summary, when unity lacks disorder occurs and appreciation starts to decrease.
Visual complexity was explored and explained within various contexts such as ecological variables, psychophysical variables and aesthetic appreciation by many
12
research studies. The next section continues with the definition of visual complexity and the methods for measuring visual complexity with literature review.
2.1. Definition of Complexity
The word complexity comes from the Latin word “complexus” which means “entwined, twisted together, embrace, and woven together” (Castiglioni, Mariotti, Brambilla & Campagna, 1966). Also there are various definitions of complexity coming from different fields including engineering, design and architecture and in all complexity is interpreted as the state of having countless parts which cause difficulty in understanding and interpreting the whole (Kocaoğlu & Olguntürk, 2018).
Complexity is always associated with disorder and often called as the “edge of chaos” (Sala, 2000). Complexity is the “equilibrator among chaos and simplicity, so it is the transition space between order and disorder”. However this explanation is not enough to understand totally the concept of complexity (Kocaoğlu & Olguntürk, 2018). Some of the definitions and further explanations about complexity are below: Complexity is described as the degree to which a system or component has a
design or implementation that is difficult to understand, describe, explain, record and verify (Ramanarayanan, Bala, Ferwerda & Walter, 2008). Complexity is called as having multiple interpretations in the way of
grouping elements (von Meiss, 1989).
Visual complexity of an object (e.g., a web page or an image) refers to the number of elements presented in the object and the level of information detail carried by these elements (Liqiong & Poole, 2010; van der Helm, 2000).
13
Visual complexity is defined as the way in which the formal elements of line, direction, shape, size, color, tone, and texture were used to produce harmony, contrast, dominance, rhythm, and balance (Osborne & Farley, 1970).
Complexity is mostly seen as a quality in need of control (von Meiss, 1989). The more complex the structure becomes, the greater the need for order
(Arnheim, 1971).
The complexity of a string is the length of the shortest possible description of the string in some fixed universal description language (Woodward, 2005). For example the below two strings include 32 lowercase letters and digits. String 1: cdcdcdcdcdcdcdcdcdcdcdcdcdcdcdcd
String 2: shc6nd7fmc8slv9dnrlcng983grs304r
“The first string has a short English-language description, namely "cd 16 times", which consists of 11 characters with space included. The second one has no obvious simple description other than writing down the string itself, which has 32 characters. In other words, the complexity of a string is the minimal description of the string. It can be shown that the complexity of any string cannot be more than a few bytes larger than the length of the string itself. Strings like the “cdcd” example above, whose complexity is small relative to the string's size, are not considered to be complex” (Vitanyi & Li, 1997).
According to those definitions, complexity is sometimes perceived as a complicated and negative notion that needs to be corrected and often determined by factors such as the irregularity, detail, dissimilarity, and quantity of objects; the asymmetry and
14
irregularity of their arrangements (Kent & Chris, 1994; Pieters, Wedel & Batra 2010); and the variations in color and contrast (Leder & Carbon 2005).
As a summary of all mentioned definitions, complexity is the “amount of detail or intricacy” in a composition (having numerosity and variety of elements); both complexity and simplicity are inseparable and parts of a whole since they are indicated by the level of order (Arnheim, 1971). For instance, a simple composition (with lower amount of detail) has minimum level of complexity (more simplicity) or a complex composition (with higher amount of detail) has maximum level of
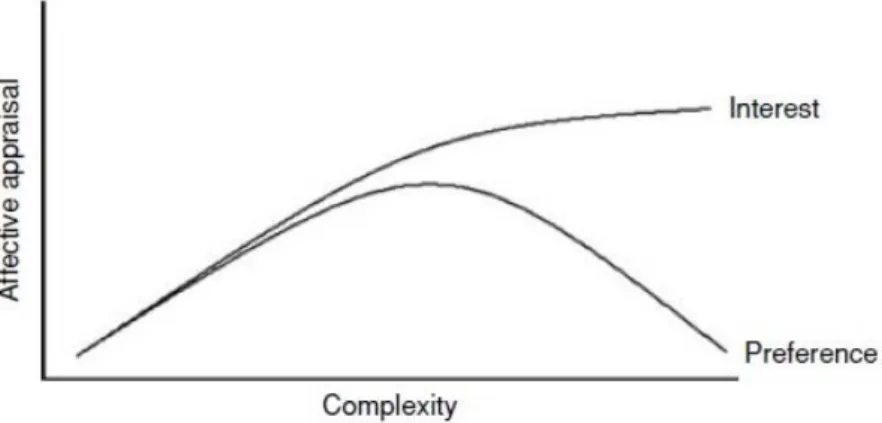
complexity (less simplicity). Similarly in design, complexity is diversity or variety so that a visual interest can be created. As Olguntük & Demirkan (2011) stated; “Simple compositions can result in monotony or boredom, whereas complex compositions are prone to produce chaos if a strong order fails to be established. Thus, a successful amount of complexity with a readable order is necessary in designing”. Daniel Berlyne (1960, 1971, 1974) indicates that people generally prefer stimuli of intermediate complexity to simple and highly complex ones under normal arousal conditions. Intermediate levels of complexity give rise to an optimal level of arousal, yielding the highest hedonic (having a pleasant sensation) value. According to Berlyne, “an increase in complexity leads to the activation of a primary reward system up to an optimum. An aversion system becomes active upon a further increase in complexity, yielding an inverted U-shaped function (See Figure 1) between complexity and hedonic value” (Marin and Leder, 2016). The theory predicts that by adjusting visual complexity to an optimal level, viewers’ pleasure of an object will increase (See Figure 1). Consequently, stimuli of a moderate degree of
15
visual complexity will be considered pleasant, whereas both less and more complex stimuli will be considered unpleasant (Tuch et. al., 2012).
Figure 1. Graph showing the relationship between preference, interest and
complexity level (Forsythe, Nadal, Sheehy, Cela‐Conde & Sawey, 2011, p. 51)
Since complexity is the transition space between order and disorder, finding the right balance between simplicity and complexity is important to create interest in a composition (Kocaoğlu & Olguntürk, 2018). It is demonstrated that humans prefer a middle level of complexity, because simpler visual stimuli tend to be perceived as more aesthetically pleasing, probably due to more fluent mental processing of stimuli (Miniukovich & De Angeli, 2014). On the other hand, if it is too simple, humans are bored or else if it is too complex, they will be mixed up (Norman, 2010; Olguntük & Demirkan, 2011). In other words, everyone wants more capability, therefore they want more elements. Everyone wants ease of use, therefore they want simplicity. As Klinger & Salingaros (2000) stated; “people seek organized complexity, and become disinterested in, or repelled by, low or disorganized complexity”. The need for organized complexity is coming from the causal mechanism of human perceptual system which was explored by Vitz (1966). As Vitz argued, “the ease with which perceptual experience could be processed was inversely related to a stimuli’s
16
complexity or uncertainty”. People were motivated to stimuli which are close to the maximum limit of human perceptual system when the organization of stimuli were reinforced (Vitz, 1966).
As well, the field of environmental psychology deals with visual complexity as a variable that has a significant impact on the human psychological response to the both natural and artificial environment (Mehrabian & Russell, 1974; Nasar, 1987; Nasar, 1997). Environmental complexity is defined as the visual richness, quantity, and variety of decoration of an environment and as the amount of information in an environment (Nasar, 1997) and for a landscape complexity is also refers to the diversity and riches of elements in landscape patterns (Ode, Tveit & Fry, 2008; Orzechowska-Szajda, 2015). Kaplan and Kaplan (1989) stress the fact that “complexity is the source of content and exploration opportunities and the abundance of landscape elements and the diversity of land cover are the two most important indicators of visual landscape character” (Tveit, Ode & Fry, 2006). Some studies give emphasis to the role of vegetation in landscape preferences, as well as “spatial diversity and complexity, water forms, the lay of the land, topography, the scope of visibility” (Bishop, 1996; Bishop & Hulse, 1994; Crawford, 1994). In the literature of the subject complexity is expressed as “the diversity of elements in the form of the number and types of objects, land cover and pattern variability – the variety of forms of land use, as well as size and shape diversity”. Hence, finding the right balance for visual complexity is a thorough decision for artists, designers and environmental psychologists.
17
2.2. Measuring Visual Complexity
Throughout the history of human vision and perception research, complexity is always a subject of interest and research. Various disciplines such as engineering, psychology, environmental psychology, design and architecture approach visual complexity from different points of view. Because of this distinction in defining visual complexity, there are varied methods for measuring visual complexity.
For understanding the role of color in visual complexity and visual interest, a brief information could be given about aesthetics and pleasure since an objective measure of visual complexity started with studies about aesthetics. Aesthetics is the philosophical study of beauty and taste. It is closely related to “the philosophy of art, which is concerned with the nature of art and the concepts in terms of which individual works of art are interpreted and evaluated” (https://www.britannica.com/topic/aesthetics). As a definition, it is “the study of human minds and emotions in relation to the sense of beauty” (Palmer, Schloss & Sammartino, 2013). At this particular point, beauty should be clarified too. Beauty is defined by Santayana (1896) as pleasure as the quality of a thing. Besides the general definition of beauty given previously, this notion depends on two aspects; one of this is order and the other one is complexity. It arises from the “balance or combination of order”, unity or harmony and complexity, multiplicity or diversity (Boselie & Leeuwenberg, 1985; Eisenman, 1968; Roberts, 2007). For instance, “if the repertoire is given by a palette of colors with a probability distribution, the final product (a painting) is a selection (a realization) of this palette on a canvas. In general, in an artistic process, order is produced from disorder. The distribution of elements of an
18
aesthetic state has a certain order, the repertoire shows a certain complexity and the final product has a certain beauty”.
Sense of beauty implies the notion aesthetics. There are several approaches to define aesthetics and one and the most suitable of those approaches was introduced by Immanuel Kant (1987) in the book The Critique of Judgment. This approach is a philosophical study of certain states of mind—responses, attitudes, emotions—that are held to be involved in aesthetic experience. Kant located “the distinctive features of the aesthetic in the faculty of judgment, whereby human take up a certain stance toward objects, separating them from their scientific interests and their practical concerns. The key to the aesthetic realm lies therefore in a certain disinterested attitude, which we may assume toward any object and which can be expressed in many contrasting ways” (https://www.britannica.com/topic/aesthetics). In other words aesthetic judgment can be defined as the assessment that someone does of the aesthetic or artistic value of a certain visual stimulus (Roberts, 2007).
As beauty depends on both order and complexity, before going into deep about complexity, order needs to be explained in detail. Order can be called as the
organization of an information in a stimulus. As Birkhoff (1933) discussed order has formal and connotative elements. Formal elements are defined as the physical properties of the information or the stimulus; “repetition, similarity, contrast,
symmetry, balance, sequence and equality”, whereas the connotative elements are the ones which remain outside. The formal elements of order; “repetition, similarity, contrast, symmetry, balance, sequence and equality” are linked with complexity. As
19
such, a structure can be more or less systematic at any level of complexity. Thus, the level of ordered and systematic complexity is the level of order (Arnheim, 1971).
Since the human perception studies started, order and complexity are proposed as the most important indicators of aesthetic appreciation. As Perolini (2011) stated
“aesthetics cannot be absent from the built forms and just like the importance of a defined space, aesthetic qualities of a space reinforce spatial experiences”. Visual complexity, which refers to the visual variety or information rate of visual stimuli, is an important variable that influences first impressions and emotions, also aesthetic preferences concerning the stimuli (Berlyne, 1971). The studies about measuring aesthetic appreciation initiated the research about visual complexity. In order to understand visual complexity, first aesthetic appreciation and its related studies should be presented well.
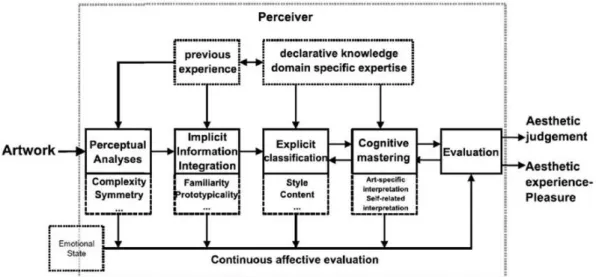
Aesthetic judgment can be defined as the assessment that someone makes of the aesthetic or artistic value of a certain visual stimulus” (Roberts, 2007). Art is like the other activity of the mind, is focusing on psychology, in order to build an accessible understanding (Arnheim, 1966) and the psychology of art aims to characterize the psychological mechanisms involved in the appreciation of art, such as grasping an artwork’s symbolism and identifying its compositional resources (Leder & Nadal, 2014). A model (see Figure 2) introduced by Leder, Belke, Oeberst & Augustin (2004) showing “the mental functioning while experiencing aesthetic stimuli, i.e. an artwork, which aims to provide an integrated description of the psychological processes involved in aesthetic appreciation. It also tries to explain the relation
20
between art and aesthetics, showing the features that make an experience aesthetic, and the relation between contemporary art and more traditional forms of art. The model is designed to show the relation amongst perception, complexity, familiarity, knowledge, style, content and experiences (expertise) in the psychological
mechanisms involved in the appreciation of art”. One of the indicatives for aesthetic appreciation is complexity, which effects aesthetic evaluation during the early perceptual analysis of objects of aesthetic (Berlyne, 1970; Berlyne, 1971; Gartus & Leder, 2017; Mayer & Landwehr, 2014).
Figure 2. Model of aesthetic appreciation and aesthetic judgments (Leder & Nadal,
2004)
It is believed that the perceptual ability of people effect aesthetic preference of complex visual stimuli; “aesthetic pleasure would be caused by an easy functioning of perceptual processes, whereas displeasure would be caused by their difficult functioning” (Chevrier & Delorme, 1980). In a study, participants’ perceptual abilities were measured with Poppelreuter-Ghent's overlapping figures test (Sala,
21
Laiacona, Trivelli, & Spinnler, 1995) and embedded figures test (Happé, 2013). Researchers created 6 transparent rectangles with various complexities and
participants were asked to rate according to their aesthetic preferences. As the results showed, number of overlapping patterns were significantly influenced the difficulty of the task. However, direction and degree of rotation could not found as a
significant influencer.
Nicki and Moss (1975) conducted a study exploring the effects of complexity
measures, redundancy and subjective complexity on aesthetic preference which were rated by 7- point Likert Scale. Their results showed that there was a linear
relationship between complexity measures, redundancy, subjective complexity and aesthetic preference. A similar study was conducted by Nicki and Gale (1977) by measuring the physiological activities of participants by electroencephalogram (EEG). Their results supported the previous results of Nicki and Moss (1975); there was an increasing linear graph between complexity and interest.
A significant study explored the dimensions of complexity; color, form, direction of dominant lines and texture (Wohlwill, 1968). The amount of voluntary exploration and ratings by the participants indicated the aesthetic preference which was the focal point of the study. The results showed that, participants’ preferences increased as complexity increases but up to a certain point, after that their preferences started to decrease. The reason behind this case might be the effort required to process the visual information. It might also reduce the interest which might decrease preference too (Wohlwill, 1968).
22
A study exploring the effect of the amount of information in artworks on aesthetic preference was conducted by Neperud and Marschalek (1988). Two early 20th century black and white artworks and their altered versions by removing some lines and shapes were shown to college students who did not have any art education. Participants were asked to select among adjective pairs; pleasing- annoying (hedonic value), beautiful- ugly (hedonic value), weak- strong (potency dimension), powerful- powerless (potency dimension), active- passive (activity dimension) and noisy- quiet (activity dimension). Also complex- simple, dense- disperse, cohesive- diffuse and pleasant- unpleasant adjective pairs were added. Their results showed that all variables were influenced by the amount of information in artworks (Neperud and Marschalek, 1988).
Besides having an innovative methodology to examine the dimensions of
complexity, the alterations done in the artworks might cause semantic uncertainty. Another study including artworks was conducted by Krupinski and Locher (1988). Their aim was to find a relationship between complexity, arousal and aesthetic judgement through symmetry. They used well- known artworks of Vasarely, Rothko, Braque, Matisse, Mondrian and Kandinsky, also similar to those artworks chosen, some modifications were made on them. Those modifications were single symmetry and double symmetry transformations. Participants rated those artworks (both altered and unaltered ones) according to its composition, complexity and creativity.
According to their findings, the artworks that applied single symmetry were rated higher than the double symmetry versions. A similar study was conducted by
Messinger (1998) in order to determine the association between interest, pleasure and complexity in artworks. The artworks Messinger chose were varying in style, genre
23
and era. Participants were asked to rate those chosen artworks according to interest, pleasure and visual complexity and the results indicated an inverse U- shaped relation among pleasure and interest. However, no relation could be found between pleasure and complexity.
One of the important metric approaches was introduced by an American
mathematician George David Birkhoff. He transformed the relationship between aesthetic, order and complexity into a mathematical formula. Birkhoff reformulated the concept of beauty through aesthetic measure. It is the ratio between order and complexity and defined this ratio as “the complexity is roughly the number of elements that the image consists of and the order is a measure for the number of regularities found in the image”.
M = O C
(M stands for aesthetic measure, O for Order and C for Complexity)
According to Birkhoff’s formula, complexity is the number of elements that the image consists of and the order is a measure for the number of regularities found in the image (Rigau, Feixas, & Sbert, 2007) and aesthetic experience is developed on three phases:
1. A preliminary effort of attention, which is necessary for the act of
perception, and that increases proportionally to the complexity (C) of the object.
24
2. The feeling of value or aesthetic measure (M) that rewards this effort.
3. The verification that the object is characterized by certain harmony,
symmetry or order (O), which seems to be necessary for the aesthetic effect.
As Rigau, Feixas, & Sbert (2007) stated, by the analysis of the aesthetic experience, Birkhoff suggested that “the aesthetic feelings stem from the harmonious
interrelations inside the image and that the aesthetic measure is determined by the order relations in the aesthetic object”. Birkhoff used various items to explain his formula; polygons, vase contours, poetry or music melodies (Staudek, 1999).
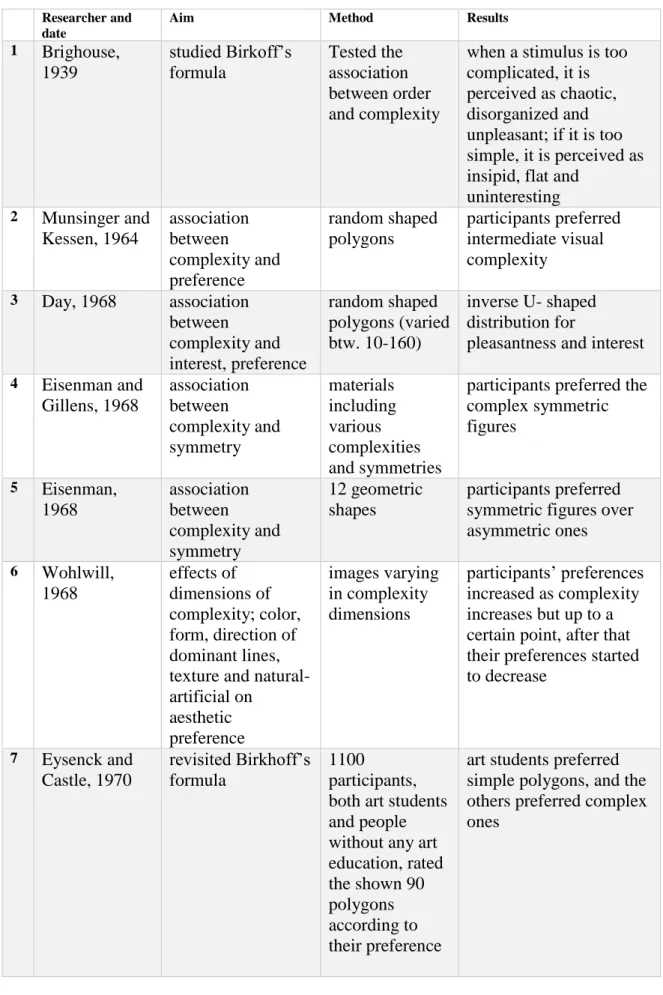
The formula that Birkhoff introduced was used in various studies as a base. For example Aitken (1974) investigated the effects of the number of sides of random polygons on visual complexity. The number of sides of the polygons varied between 4 and 40. The results showed that, interest and pleasantness increased as complexity increased. Munsinger & Kessen (1964) studied preference of random shaped
polygons with various complexities. According to their results people prefer intermediate visual complexity rather than high or low one. Day (1968) studied the effects of number of sides of random polygons, varied between 10 and 160 and found an inverse U-shaped distribution for pleasantness and interest. Eysenck and Castle (1970) revisited Birkhoff’s formula by using 90 polygons. 1100 participants, both art students and people without any art education, rated the shown polygons according to their preference. Results showed that art students preferred simple polygons, and the others preferred complex ones (Eysenck & Castle, 1970).
25
Figure 3. Polygons preferences of art students (Left) and polygons preferences of
students without art education (Right) (Eysenck & Castle, 1970)
According to Berlyne (1963; 1970) interest and preference of an image is directly related to the visual complexity of that image. As Gombrich (1984 p. 9) stated, “We must ultimately be able to account for the most basic fact of aesthetic experience, the fact that delight lies somewhere between boredom and confusion”. In other words, people prefer intermediate level of arousal, rather than highly complex or very low complex ones (See Figure 1). Besides, visual complexity is related with the
regularity of the pattern, amount of elements, heterogeneity, or irregularities of the form in that image. Those dimensions that Berlyne (1963) introduced, later was developed as intelligibility of the elements, organization, amount of elements, variety of elements, asymmetry, variety of colors, and three- dimensional appearance
26
On the grounds of Berlyne’s studies, a series of experiments were conducted to understand the association between complexity and preference using random shaped polygons. Also researchers tried to set dimensions of visual complexity. The first and the most examined dimension was symmetry. It has been argued that human
preference for symmetry systems from the applicability of symmetry as a biological function signing health and good genes (Gartus & Leder, 2017). On the other hand, symmetry preference was a mere by-product of visual processing (Enquist & Arak, 1994). There is also evidence that there is an automatic reaction to symmetry in the brain (Bertamini, Makin, Palumbo, Rampone & Wright, 2015). Symmetry has an important role in determining the visual complexity; according to studies symmetric shapes are perceived as less complex than asymmetric shapes with the same number of sides which can be attributed to the increase of idleness caused by symmetry (Friedenberg & Bertamini, 2015; Gartus & Leder, 2017). Symmetry facilitates image segmentation and plays an important role in object inquiry and representation (Li, Pizlo & Steinman, 2009; Machilsen, Pauwels & Wagemans, 2009). Another reason in preferring symmetry might be the fluency which was stated in the fluency hypothesis (Reber, Winkielman & Schwarz, 1998). According to this view, the stimulus which can be processed fluently creates positive hedonic feelings, so people might prefer symmetry just because they can process it easily. Symmetrical balance has a seemingly basic appeal (Berlyne, 1971; Lauer, 1979). Murdoch and Flurscheim (1983) add that “symmetry suggests a state of order, but that some asymmetry can often create a greater sense of interest. A touch of asymmetry can be appealing by adding an element of uniqueness” (Schmitt & Simonson, 1997). Several researchers mention that complete symmetry may be too monotonous and thereby uninteresting; a touch of asymmetry can be appealing by adding an element of distinctiveness,
27
which may create a greater sense of interest (Murdoch & Flurscheim, 1983; Schmitt & Simonson, 1997). Uniqueness can be obtained by visual complexity. Symmetry is often mentioned as the simplest case of balance, Lauer (1979) describes balance as “equal visual weight at both sides of an axis, so that there is a sense of equilibrium. In symmetrical balance, shapes are repeated in the same position on either side of an axis. Asymmetrical balance is more subtle (Lauer, 1979), in that the visual weight and “eye” attraction of two sides are balanced but with different elements”. As a summary, preferring symmetry for abstract patterns and for faces provides order and relieves tension (Berlyne, 1971; Jacobsen & Höfel, 2003; Lauer, 1979; Rentschler, Juttner, Unzicker & Landis, 1999; Rhodes, 2006; Schmitt and Simonson, 1997).
A major aspect of the structural factor of complexity is symmetry (Ichikawa, 1985) which is everywhere in the environment and it can be detected fast and efficiently by human vision (Bertamini, Friedenberg & Kubovy, 1997; Carmody, Nodine &
Locher, 1977; Chipman, 1977; Locher & Nodine, 1987; Treder, 2010; Wagemans, 1997). Mathematical and geometrical components; the golden ratio, symmetry, the Fibonacci’s sequence, and the Euclidean geometry, had their inspirations from nature as arts, design and architecture did. For many centuries, architecture found
inspiration in mathematical and geometrical components, i.e. in nature which is, intrinsically, fractal, complex, but at the same time symmetric and already aesthetically appealing (Sala, 2000). It is argued that, having symmetry and less complexity increases the sense of order, therefore have a positive effect on
perception quality (Mariëlle, Creusen, Veryzer & Schoormans, 2010). As a contrary to Mariëlle, Creusen, Veryzer & Schoormans (2010), as Norman (2010) argued
28
having a higher complexity level can increase perception quality. Hence, several studies were conducted in order to test those contradicting phenomena.
Eisenman (1968) conducted a study for evaluating the association between complexity and symmetry. Twelve geometric shapes varying in complexity and symmetry were created, then participants were asked to select their most and least preferred ones. According to the results, participants preferred symmetric figures over asymmetric ones. Eisenman continued his experiment only by showing the asymmetric figures to participants. The results showed that, when participants needed to select their preferences among symmetric and asymmetric figures, they tended to select the symmetric ones, but when there were only asymmetric ones participants tended to select the simplest one and do not prefer the complex ones. So it could be concluded that people prefer simple and intermediately complex figures. Eisenman and Gillens (1968) did additional experiments with materials including various complexities and symmetries. Their results indicated that, people preferred the complex symmetric figures. As Eisenman and Gillens (1968) concluded, symmetry had acted by reducing the complexity introduced by the number of vertices of the figures.
Finding a measure for the mathematical and psychological complexity of an image has gain importance (Attneave & Arnoult, 1956; Chipman, 1977; Garcia, Badre & Stasko, 1994; Hochberg & Brooks, 1960). The measures that have been developed inclined to be founded on a counting system whereby elements (lines and angles) and the regularity, irregularity, and heterogeneity of those elements additively contribute
29
to a mathematical calculation of visual complexity (Birkhoff, 1933; Eysenck, 1941; Eysenck, 1968; Eysenck & Castle, 1970; Jacobsen & Höfel, 2003). Many attempts (Arnheim, 1971; Birkoff, 1933; Salingaros, 1997; Stiny & Gips, 1978) have been made to formulate a general approach to visual complexity based on some principle that would be universally applicable across all domains. These attempts have generally failed because the results were not consistent (Gero & Kazakov, 2003).
An important attempt for quantifying visual complexity of patterns is the parameter named fractal dimension (D). This parameter describes “how the patterns occurring at different magnifications combine to build the resulting fractal shape (Mandelbrot, 1977). For Euclidean shapes, dimension is described by familiar integer values - for a smooth line (containing no fractal structure) D has a value of one, whilst for a
completely filled area, (again containing no fractal structure) its value is two. For the repeating patterns of a fractal line, D lies between 1 and 2 and, as the complexity and richness of the repeating structure increases, its value moves closer to two
(Mandelbrot, 1977). For fractals described by a low D value, the patterns observed at different magnifications repeat in a way that builds a very smooth, sparse shape. However, for fractals with a D value closer to two, the repeating patterns build a shape full of intricate, detailed structure and visually complex” (Taylor et. al., 2005). As previous research showed, people preferred intermediate levels of fractal
dimension which lies between 1,3 and 1,5. (Street et. al., 2016). Fractional dimension also provides a way to measure the roughness or convolution of fractal curves. The dimension of a line, a square, and a cube is easy to calculate (one, two, and three, respectively). Roughness can be thought of as an increase in dimension: a rough curve has a dimension between 1 and 2, and a rough surface has a dimension
30
somewhere between 2 and 3. There are various methods for measuring fractal dimension, D, and all are based on a power law that generates scale-invariant
properties (Taylor & Sprott, 2008). The fractal dimension D may be any real number between 1 and 2 and is defined by:
D = log(L2/L1)
D = log(S2/S1)
(L1, L2 are the measured lengths of the curves (in units), and S1, S2 are the sizes of the units (i.e., the scales) used in the measurements)
Taylor & Sprott (2008) described fractal dimension D as;
“D describes how the patterns occurring at different magnifications combine to build the resulting fractal shape. For Euclidean shapes, dimension is described by familiar integer values − for a smooth line (containing no fractal structure) D has a value of one, while for a completely filled area (again containing no fractal structure) its value is two. For the repeating patterns of a fractal line, D lies between one and two, and, as the complexity and richness of the repeating structure increases, its value moves closer to two. A
traditional method for measuring D is the box-counting method, in which the pattern is covered with a computer-generated mesh of identical squares (or boxes). The number of squares, N(L), that contain part of the pattern are counted, and this count is repeated as the size, L, of the squares in the mesh is reduced. N(L) gives a measure of the space coverage of the pattern, and reducing the square size is equivalent to looking at this coverage at finer
31
magnifications. For fractal behavior, N(L) scales according to the power law relationship N(L) ~ L -D , where 1 < D < 2 (Gouyet, 1996)”.
After Mandelbrot (1977) introduced the concept of fractal geometry, it is speculated that fractal and Euclidean shapes might be processed in different regions of the brain due to their differing visual qualities (Clark & Lesmoir-Smith, 1994). The reason for this is hypothesized as, the human perception system has evolved over millions of years in a natural fractal environment. Only recently, by evolutionary time scales people found their selves in a primarily Euclidean environment of straight lines and few spatial scales (Rogowitz & Voss, 1990).
Throughout the evolution process people got used to perceive and live in a Euclidean environment (i.e. among straight lines). The evolved perception system is mostly explained by the phenomenon Gestalt principles for grouping visual stimuli. Gestalt principles describes the way how human perception system works during reducing complex scenes and/ or shapes into simpler ones. According to the principles, the overall organization of the scene (visual stimuli) cannot be reduced into its parts (Roberts, 2007). The scene can be grouped according to some principles of perceptual organization; proximity, similarity, common density, orientation,
continuity, closure, common region and connectivity. Another principle that Gestalt psychologists introduced is figural goodness, which is: “Out of all possible
organizations for a given stimulus, the simplest will be perceived, that which minimizes its complexity” (Roberts, 2007).
32
The intrinsically multidimensional problem of evaluating the complexity of an image is of certain significance in both computer science and cognitive psychology
(Cardaci, Di Gesu, Petrou & Tabacchi, 2005). In broader contexts the general problem of visual complexity measurement is ill-defined. The evaluation of visual complexity is useful in understanding relations among different levels of the recognition process. It is also of interest to real applications such as image compression and information theory (Kocaoğlu & Olguntürk, 2018).
According to image compression applications, a compressed image consists of a string of numbers that represent the organization of that picture. This string is a measure of information content and the compressed file size of a bitmap image is associated with its subjective image complexity (Donderi, 2006a). When the image contains few elements or is more homogeneous in design, there are few meaning options and as such the file string encompasses mostly numbers to be repeated. A more complex picture will have more image elements and these elements will be less expectable. So, the file string will be longer and contain an increasing number of alternatives. The results of the studies about visual complexity and file size showed that the simplest objective clue of the visual complexity of a digital image is the compressed file size; JPEG compressed file size (Donderi & McFadden, 2005; Donderi, 2006b) and GIF file size (Forsythe et. al., 2011) have been found to correlate with human perceptions of visual complexity.
Like in the image compression applications, the length of strings or file size can give a measure for complexity wise, a similar method can be applied in visual-based
33
design the notions (Gero & Kazakov, 2003). There is a need for measure in visual complexity since it is often described with subjective methods. Therefore, the number of lines and the level of detail in a drawing can obtain an objective measurement for visual complexity in various disciplines including built environment and design.
One of the earlier attempts to develop a measure for visual complexity in built environment was done by Heath, Smith, and Lim (2000). They conducted a study about the relationship between visual complexity of façade articulation, preference, arousal, pleasure, and urban skyline silhouette. Their results were; the strongest effect on preference, arousal, and pleasure was the degree of silhouette complexity, with higher silhouette complexity associated with higher levels of perceived
complexity and preference and higher arousal and pleasure. The results of their study still was not enough to develop an objective measurement.
The pioneers in this field are the psychologists Snodgrass and Vanderwart (1980) who established a classification of the complexity of a set of black and white line art drawings. This grouping was based on subjective observers’ rankings. Later, in order to obtain a more objective measure of complexity, “more algorithmic measures” were presented (number of line segments, lines crossings, etc.). But, these were not calculated computationally.
The studies about visual complexity are valuable in gaining information about how to measure it but still lacks some points. This study aims to fill this gap with
34
measuring visual complexity by examining the dimensions of it which are going to be discussed in the next sub chapter.
2.3. Dimensions of Visual Complexity
The previously mentioned studies examined visual complexity only from a single dimension such as handling it through symmetry or number of edges of polygons or color. Some of those studies could find the effects of those dimensions on visual complexity and some of them could not (See Table 2). The dimensions could be interrelated somehow and those studies were missing the chance to examine them since they were only testing one or two dimensions with omitting the rest.
Rump (1968) was trying to find a general factor of preference for complexity, even if he could not relate the dimensions (asymmetry, multiplicity and heterogeneity) of visual complexity and suggested that a specific dimension should be used in visual complexity studies. He also concluded that people’s assessment of the complexity of an image may differ depending on the feature they focus primarily.
The association between dimensions of complexity and aesthetic preference was examined by recording the time spent while perceiving those images and their preferences by Kreitler, Zigler and Kreitler (1974). However, there were no significant results showing the association between dimensions of complexity and preference. Another study was conducted by Francès (1976) using the dimensions of complexity. In this study, two groups of participants coming from different education
35
levels were compared; university students and manual workers. Numerous materials were shown to them to rate preference and interest according to their complexities. According to the results, both groups showed interest in most complex ones. The difference between university students and manual workers was, students tended to prefer complex ones, whereas workers preferred simple ones. Another study about the dimensions of complexity was done by Jacobsen and Höfel (2003). They tested the effect of symmetry on aesthetic preference and found that symmetry had a direct effect on aesthetic preference. The relationship between aesthetic preference,
complexity levels (low, medium, high) and gender, education, personal traits were examined by Osborne and Farley (1970). As results indicated, high complex visual stimuli had the highest preference scores which showed a linear relation between complexity and aesthetic preference.
Another study sought to determine the validity of complexity and mystery as predictors of interior preferences by using grayscale images and to identify design attributes related to their perception in interiors (Scott, 1993). Complexity and mystery were positively related to preference and also to each other. Design features underlying perceptions of complexity included the number and variety of elements present, the composition of scene elements, and the scene's spatial geometry. The recent visual complexity research defines complexity as the overall visual diversity or the amount of information which is contained in a scene. In terms of interior spaces visual complexity is specially linked to design elements such as walls, floors, ceilings, furniture and fixtures, density and layout (Orth & Wirtz, 2014; Orth, Wirtz & McKinney, 2016). Jang, Baek, Yoon and Choo (2018) studied the effect of visual complexity on consumer responses in store design. In their experimental phase, they
36
designed a store virtually and controlled the level of visual complexity, which was manipulated by the presence of decorative patterns, layout type; grid or free-form, and the quantity of fixtures and other objects. Their results showed that “high-visual complexity in a fashion store has a negative effect on pleasure when consumers’ involvement level is low, but such negative effect of visual complexity diminished in consumers with high fashion involvement”. Regardless of consumers’ involvement levels, it was found that higher arousal was significantly related with higher visual complexity. The visual complexity of a store environment draws the attention of consumers and affects their emotional and behavioral response (Gilboa & Rafaeli, 2003; Orth & Wirtz, 2014; Orth, Wirtz & McKinney, 2016, Jang, Baek, Yoon & Choo, 2018).
Kreitler, Zigler, and Kreitler (1974) argued that visual complexity was best conceived as a multidimensional concept. In order to begin characterizing the structure of this concept, they designed a study which they used the five complexity dimensions; heterogeneity of elements, irregularity of the disposition of the elements, the amount of elements, irregularity of the shape, and incongruence of the
juxtaposition of the elements (Roberts, 2007). As their results showed, a stimulus which facilitates the organization of its meaning and its forms into an overall organization could be rated as simpler than a stimulus with fewer elements, or more homogeneous, but which were harder to integrate or organize into a coherent whole. These findings introduced the view that there could be a multidimensional nature of complexity.
37
Based on the literature review on visual complexity, it is seen that examining visual complexity is not enough to have a full understanding of its effects and reasons. Accordingly, seven main dimensions were derived; intelligibility of colors, disorganization of colors, amount of elements, variety of elements, asymmetry, variety of colors, and three- dimensional appearance (See Table 1).
Table 1 Dimensions of visual complexity (Roberts, 2007)
Dimension 1
Intelligibility of colors
How difficult it is to identify the colors in the image.
Sub-dimension: Understandability Dimension 2
Disorganization of colors
How difficult it is to organize the colors into a coherent scene.
Sub-dimension: Regularity Dimension 3
Amount of elements
Numerousness of the elements in the image.
Sub-dimension: Density Dimension 4
Variety of elements
Heterogeneity of the elements in the image
Dimension 5
Asymmetry
How unbalanced is the image.
Dimension 6
Variety of colors
Heterogeneity of the colors present in the image.
Sub-dimension: Number of colors
Sub-dimension: Number of combinations of colors having hue difference Sub-dimension: Number of combinations with value difference
Sub-dimension: Number of combinations with chroma difference Dimension 7
Three-dimensional appearance
How three-dimensional does the image look.
Sub-dimension: Roughness Sub-dimension: Directionality
A study conducted by Roberts (2007) attempted to gather the dimensions of visual complexity. As a result of this study, intelligibility of the elements, disorganization, amount of elements, variety of elements, asymmetry, variety of colors and three-dimensional appearance could have an effect on visual complexity. Among all those dimensions; intelligibility, disorganization and variety of colors were chosen since there is a gap in the literature review which studied the effects of color on visual complexity and visual interest. Thus, in this study’s first part the selected three dimensions of visual complexity were examined and defined within the context of