PAMOGK-Web: A FRAMEWORK FOR
CANCER SUBTYPE IDENTIFICATION
USING COPY NUMBER VARIATIONS
a thesis submitted to
the graduate school of engineering and science
of bilkent university
in partial fulfillment of the requirements for
the degree of
master of science
in
computer engineering
By
Furkan Mustafa Akdemir
December 2020
PAMOGK-Web: A Framework for Cancer Subtype Identification using Copy Number Variations
By Furkan Mustafa Akdemir December 2020
We certify that we have read this thesis and that in our opinion it is fully adequate, in scope and in quality, as a thesis for the degree of Master of Science.
Oznur Ta§tan Okan(Co-Advisor)
Can Alkan
Approved for the Graduate School of Engineering and Science:
Director of the Graduate School 11
ABSTRACT
PAMOGK-Web: A FRAMEWORK FOR CANCER
SUBTYPE IDENTIFICATION USING COPY NUMBER
VARIATIONS
Furkan Mustafa Akdemir M.S. in Computer Engineering
Advisor: A. Erc¨ument C¸ i¸cek December 2020
Detection of molecular sub-groups of cancer is important for developing cancer therapeutics and to understand the underlying causes of the molecular differences in these groups. The cancer sequencing projects made multi-omics data available for large cancer cohorts. The multi-omics data provides multiple views into the cancer which can be used to find underlying causes from different perspectives and capture relations not possible with a single view approach. Previously, we developed a pipeline that uses multi-omics data to detect sub-groups of patients called PAMOGK. PAMOGK forms multiple views of the patients using pathways and multi-omics data and assess patient similarities under these views. PAMOGK was designed as a general framework that can be used to map many different omics data but was experimented with mutation, transcriptome, and proteome. In this work, we extend the use of PAMOGK with copy number variation data which shows comparable results to experiments without it. As a second contribution, we provide a web framework designed for PAMOGK easier to make it accessible to general users: PAMOGK-Web. This new web based framework is able to abstract the PAMOGK pipeline and provide a simple interface to run experiments and return results to the users. PAMOGK-Web will be using the generic design of PAMOGK to provide ready to use experiments that include setups using different omics data.
¨
OZET
PAMOGK-Web: GEN KOPYA SAYISI ˙ILE KANSER
ALT-T˙IP SINIFLANDIRMA PLATFORMU
Furkan Mustafa Akdemir
Bilgisayar M¨uhendisli˘gi, Y¨uksek Lisans Tez Danı¸smanı: A. Erc¨ument C¸ i¸cek
Aralık 2020
Genetik fakt¨orlerden kaynaklı hastalıklarda farklı hasta alt-gruplarının tespit edilmesi hem tedavi y¨ontemlerinin geli¸stirilmesi hem de hastalı˘gın asıl sebep-lerinin bulunması i¸cin ¨onemlidir. Yıllar boyunca yapılan kanser ara¸stırmaları sonucu genom, transkriptom, metabolom, ve proteom gibi farklı omik veri tip-lerini i¸ceren geni¸s bir veri havuzu olu¸smu¸stur. Multiomik de denilen bu veri tipleri, tek veri yapısının yeterli olmadı˘gı yerlede kanser tiplerinin altında yatan sebeplere farklı g¨or¨u¸s a¸cılarından izlenim verebilir. Daha ¨onceki ¸calı¸smalarımızda farklı omik veri tiplerini kullanarak kanser alt-gruplarını tespit eden PAMOGK sistemini geli¸stirdik. PAMOGK gen yolaklarını temel alarak, multiomik veri tip-lerinden gelen bilgilerle hastaları bilgi verici alt-gruplara ayırmaktadır. PAMOGK multiomik veri tiplerinin bir araya getirilmesi i¸cin geni¸sletilebilir bir ¸sekilde tasarlanmı¸stır ve bu ¸calı¸smanın ilk kısmında PAMOGK geni¸sletilerek gen kopya sayısı veri yapısı eklenmi¸stir ve bu sayede algoritmanın sonu¸clarının geli¸stirilmesi ama¸clanmaktadır. ˙Ikinci bir katkı olarak PAMOGK-Web is-minde bir online platform tanıtılmaktadır ve bu platform ile hem deneylerin yapılmasının kolayla¸stırılması hem de daha geni¸s bir kullanıcı kitlesine hitap etmesi ama¸clanmaktadır. PAMOGK-Web kullanıcılarının PAMOGK sistemini direk kullanmasına gerek kalmadan basit bir aray¨uz sa˘glamayı ama¸clamaktadır ve halihazırda tanımlanmı¸s deneyler i¸cermektedir.
Acknowledgement
First of all, I want to thank my advisor Prof. Oznur Tastan for all her help and understanding in my difficult times. In respect to all the difficulties, I am glad to have the opportunity to do research.
I also would like to thank the jury members Prof. Ercument Cicek, Prof. Can Alkan and Prof. Aybar Acar for reading my thesis, giving fruitful feedback, and accepting the invitation for being a jury member in my defense in such a tight schedule.
Additionally, I would like to acknowledge the people that gave me an ”office” when I had none and helped me so many times I couldn’t thank enough: Gizem, Alper, Cihan, Caglar, Miray, Omer, and especially Onur who was the bridge that connected me to all those brilliant people. Those memories will be very dear to me and hope to have more of them.
Contents
1 Introduction 1
2 Related Work 4
3 Previous Work: PAMOGK 6
3.1 Mapping Multi-omics Data on Pathways . . . 6
3.2 Calculating Graph Kernels . . . 8
3.3 Clustering Patients into Sub-Groups . . . 9
3.4 Results and Evaluation . . . 10
4 Methods and Framework 11 4.1 Integration of Copy Number Variation Data . . . 11
4.2 PAMOGK-Web . . . 12
4.2.1 Screens . . . 14
CONTENTS vii
5.1 CNV Experiment Results . . . 19 5.2 Runtime and Memory Analysis . . . 23
6 Conclusion and Future Work 25
List of Figures
3.1 The figure shows the PAMOGK framework. Different colors show different types of omic data. PAMOGK takes omic data and path-ways as input, produces graphs for each patient, pathway, and omic type triple. These graphs are converted to kernel matrices. The kernel matrices are used as views in multi-view clustering algo-rithm to find patient sub-groups. (Note: Pathways are simplified examples.) . . . 7
4.1 The figure showing PAMOGK-Web dashboard screen flowchart with possible flows. . . 13 4.2 The figure showing PAMOGK-Web login screen with multiple login
methods that include Google Single Sign for easier login of gmail users and email for all users. . . 14 4.3 The figure showing PAMOGK-Web experiments screen with
ex-periment summary information such as creation/running timings, state of the experiments, and necessary links to more details about the experiments. . . 15 4.4 The figure showing PAMOGK-Web experiment creation screen
LIST OF FIGURES ix
4.5 The figure showing PAMOGK-Web experiment results screen with options to filter experiment results depending on different run pa-rameters. . . 17 4.6 The figure showing PAMOGK-Web experiment results screen with
comparison feature that enables users to compare results of two experiment setups. Users can also filter results with experiment parameters such as number of clusters. . . 18
5.1 Kaplan-Meier survival curves of the best clustering solutions for KIRC for number of cluster k = 5, k = 3 with smoothing pa-rameter α = 0.7, α = 0.8 and λ = 2−15, λ = 2−12 for (a) and (b) respectively. The p-value is the a log-rank test on the survival distributions of between the groups. . . 20 5.2 The figure showing histogram of kernel weights of CNV only
ex-periment for k = 3 and λ = 2−12. . . 20
5.3 The figure showing histogram of kernel weights of complete omic data set experiment for k = 3 and λ = 2−3. . . 21
5.4 Kaplan-Meier survival curves of the best clustering solutions for KIRC for number of cluster k = 3 with smoothing parameter α = 0.3, α = 0.5, α = 0.5 and λ = 23, λ = 212, λ = 215, respectively. The p-value is the a log-rank test on the survival distributions of between the groups. . . 22 5.5 The figure showing runtime and memory pressure graphics
depend-ing on the cachdepend-ing used. The peaks of each line shows the clus-tering algorithm producing memory pressure by loading all kernels from disk. The longer run showing the algorithm without any data pre-processing. . . 24
List of Tables
5.1 This table shows one vs. all log-rank test p-values from clusters produced by PAMOGK including CNV data for parameters α = 0.3 and k = 5. . . 23
A.1 Data sources and their download dates of datasets used in PAMOGK experiments. . . 33 A.2 This table shows preliminary analysis of pathway data set which
consists of 165 pathways. . . 33 A.3 This table shows the number of unique genes in each omic data set 33 A.4 This table shows the hyper-parameters used in different algorithms.
Chapter 1
Introduction
Cancer is a complex disease that can manifest itself in different molecular signa-tures which can make it difficult to provide a single cure and also can manifest in different clinical results even for the same type of cancer [1, 2, 3]. If these differ-ent manifestations under the same cancer type can be grouped together then it would be possible to use targeted treatments for such groups to cure the disease or prolong life expectancy. The problem of detecting such sub-groups in patients can be very complex because of the nature of information we can gather from patients. The information we can gather from patients include various different perspectives of the patient at that time but also might be missing other informa-tion that is crucial for finding meaningful sub-groups that can be the medically targeted.
Cancer studies provide a wide range of omics data that can be connected through patients, which makes it possible to form new sub-groups with a more coherent molecular profile [4, 5, 1]. This approach can also be applied to other diseases to find underlying causes and sub-groups that can be targeted for ther-apeutic purposes. In order to achieve this goal there are several problems that must be addressed.
data. The omics data provided by different methods provides metrics in different norms, distributions, and types. These metrics include transcriptome data, such as RNA-Seq, which provide gene expression data or somatic mutations that only provide truthy values. In order to incorporate information from these different types of data we first need to devise either a method that will convert them to a uniform type or an algorithm that can accept these different types. In PAMOGK we solve this problem by converting different omics data to graph kernels [6]. In this work we also use the same method to convert copy number variation data (CNV) and use multi-view kernel clustering along with other omics data.
The second problem is finding coherent patient sub-groups that are signifi-cantly different from the other patients in the same cohort. In order to find such groups we are using several multi-view kernel clustering algorithms with weighted kernels. The assignment of different weights to kernels allows us to give different amounts of importance to the different kernels. We generate a graph kernel for each each pathway in NCI - Pathway Interaction Database per omic data type [7]. Generated kernels are later on weighted with optimization algorithms and used in multi-view kernel clustering methods.
The third problem is related to the amount of data we are processing which makes running experiments complicated. In order to prevent this we provide a new web based framework we call PAMOGK-Web. A unified framework to run experiments both prevents simple mistakes such as wrong mappings, and also abstracts the potentially confusing parts of the PAMOGK pipeline that is used in the background. This was made possible by turning the PAMOGK into its own package and providing an interface so that the most of the steps of the experiment could be given in a separate pre-configured environment. The separate environment also removes the complicated environment setup and makes it easier to focus on running experiments with different cohorts.
In the direction of solving these problems we extended our experiment to include the CNV data in addition to the previously tested omics data which are gene expression, protein expression, and somatic mutations. The experiments included results with and without CNV to asses if the information provided by
CNV can be used by itself and if this information can improve previous results of the PAMOGK. We applied the extended method to the same kidney renal cell carcinoma (KIRC) data made available through The Cancer Genome Atlas Project (TCGA) [8]. The dataset used by PAMOGK consisted of 165 pathways and 362 patient data which were used to generate kernel matrices.
Chapter 2
Related Work
The problem of identification of sub-groups in cancer cohorts and using multi-omics clustering methods have been previously proposed and several types of approaches were used (reviewed in [9]). These approaches can be classified de-pending on the method of the merging of different omics data. The early integra-tion approach, which fuses data prior to any clustering, uses a simple method to extract features from omics data and by concatenating them produces combined feature vectors. The new feature vectors were used by standard clustering algo-rithms to find the sub-groups. There were several problems with this approach. The first problem is the amount of features extracted caused a dimensionality problem which affects the clustering methods. The combined feature vector has equal weights among all dimensions, thus it causes the prevalent features that have highest range of magnitude to dominate the result of the clustering algo-rithm. The more sophisticated integrations used regularization by assuming an existing lower-dimensional distribution; such as iClusterBayes and its earlier vari-ants [10, 11, 12] and LRACluster [13].
The late integration approach on the other hand, first clusters patients by each omic type and after these groups are realized, these approaches use this information to find finalized sub-groups [9]. Some of the methods proposed using
this approach are ConsensusClustering [14], which is frequently used for can-cer subtyping [15, 4], PINS [16] and COCA [17]. Although these methods can capture some sub-groups, this comes with the trade-off of ignoring correlations between different data types. An example case would be two omic types together producing molecular profile which none of the two by itself can show.
There exists other approaches that use intermediate integration algorithms which produce a similarity metric to group patients [18]. Similarity Network Fusion is one such algorithm that calculate a similarity network for each omic data and fuses them [19]. Other examples of similarity network based algo-rithms can be Co-regularized Multi-view Spectral Clustering [20] and MVNC [21] which extends the spectral clustering algorithm [22]. There are also interme-diate approaches that extend previous methods with multi-view approaches such as MCCA [23, 24], which extends canonical correlation analysis.
Among the intermediate approaches that use multi-view clustering approaches there are also methods which makes use of kernel-based approaches (reviewed in [25]). One advantage of kernel-based methods is similarities are mapped to another space which can be used by many different clustering algorithms [26]. Some of these approaches have also been applied to cancer sub-type detection [27, 28]. There are methods that extend previous approaches to solve multi-view clustering problem such as rMKL-LPP [27], and LMKKM [28], which produce kernel matrices computed for each data type and learns a weight for these kernels. One remaining problem caused by the nature of omics data is the problem of sparsity. This problem can be caused by weakness of molecular alteration expressions or missing information from the data set, which can cause some signals to be missed during similarity calculations. In order to prevent this PAMOGK provides a graph kernel method SmSPK that projects molecular data on pathways and propagates the omic related information to neighboring nodes to produce graphs that are connected [6]. After producing these graphs calculates a graph kernel using shortest paths.
Chapter 3
Previous Work: PAMOGK
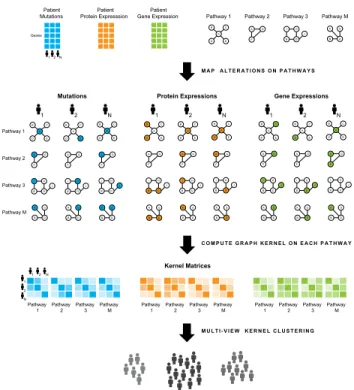
PAMOGK is the framework we have previously developed to stratify patients by mapping multi-omics data on gene pathways [6]. In order to provide necessary background information on parameters and behaviour of PAMOGK and also clar-ify the possible improvements this work introduces upon PAMOGK this chapter will explain the structure of PAMOGK. PAMOGK is composed of multiple lay-ers that map genetic alterations on pathways and using these pathways produces graph kernels to cluster patients in meaningful sub-groups which is summarized in Figure 3.1 [6]. The following sections will explain each of the layers of PAMOGK in detail. The parameters used the algorithms mentioned in this chapter can be found in Supplementary Table A.4.
3.1
Mapping Multi-omics Data on Pathways
The first layer of PAMOGK consists of a mapping operation that maps different types of omic data to graphs. The merging operation consists of two steps. The first step makes a mapping between omic data, such as somatic mutations, gene expressions, and protein expressions, and the genes on the pathways. The omic to gene mapping depends on the type of the data and each sample is mapped to
B C D E A Pathway 1 A G F Pathway 2 I H B D J Pathway 3 Patient Gene Expression Patient Protein Expresssion M A P A L T E R A T I O N S O N P A T H W A Y S Kernel Matrices C O M P U T E G R A P H K E R N E L O N E A C H P A T H W A Y Pathway
1 Pathway 2 Pathway 3 Pathway M Pathway 1
Pathway 2 Pathway 3 Pathway M
Pathway
1 Pathway 2 Pathway 3 Pathway M Pathway 1 Pathway 2 Pathway 3 Pathway M
M U L T I - V I E W K E R N E L C L U S T E R I N G Patient Mutations 1 2 N 12N 1 2 N Pathway M G K B D I H B D J B C D E A A G F A G F A G F I H B D J I H B D J B C D E A B C D E A Mutations 1 2 N G K B D G K B D G K B D I H B D J B C D E A A G F A G F A G F I H B D J I H B D J B C D E A B C D E A Protein Expressions 1 2 N G K B D G K B D G K B D I H B D J B C D E A A G F A G F A G F I H B D J I H B D J B C D E A B C D E A Gene Expressions 1 2 N G K B D G K B D G K B D Genes
Figure 3.1: The figure shows the PAMOGK framework. Different colors show different types of omic data. PAMOGK takes omic data and pathways as input, produces graphs for each patient, pathway, and omic type triple. These graphs are converted to kernel matrices. The kernel matrices are used as views in multi-view clustering algorithm to find patient sub-groups. (Note: Pathways are simplified examples.)
related genes. The difference in gene types in data sets might cause some data loss if there are no matching genes in the target pathways since some of the data might not belong to any of the nodes covered in the pathways. The amount of information lost this way is negligible and less than 0.1% of data fails to match to a node on pathways.
The second step is using mapped omic data to mark pathways. The pathways we use are from National Cancer Institute - Pathway Interaction Database (NCI-PID) at NDEXBio [7] 1 (last access: Apr 24, 2019). The NCI-PID is curated with focus on cancer research, thus allows us to focus on gene pathways known to be responsible in cancer. This second mapping operation produces a labeled graph per omic-patient-pathway triple. In cases of expression data we produce
1
separate graphs for over and under expressions. The reason for this separation is to prevent losing information from different types of expressions since the same gene having over-expression and under-expression might be related to different causes through the complex signaling pathways. One example can be a gene G being suppressed by a gene S and activated by a gene A. If the gene G is under-expressed this might be caused by gene S and if it over-under-expressed this might be caused by A. If we don’t separate these anomalies we might miss different types of information produced by the same gene.
3.2
Calculating Graph Kernels
The second layer of PAMOGK calculates graph kernels for each pathway-omic data pair. PAMOGK uses the Smoothed Shortest Path Kernel (SmSPK), which calculates graph kernels using shortest paths on a smoothed graph [29]. SmSPK works on graphs with same topology with different node labels unlike earlier graph kernels that compare graphs with different topologies [30, 31, 32, 33, 34].
The pathways in NCI-PID consists of different node types, such as genes and molecules that take role in the pathway, and PAMOGK only uses gene mapped omic data. This causes non genetic nodes of the pathway to be never mapped by any of the omics data. Also some of the data types have smaller data sets. These two reasons sometimes cause sparsity problems. In order to solve the sparsity related problems SmSPK propagates the mutations to nearby nodes with param-eter α. After the smoothing operation finds all pair shortest paths (APSP), then using the shortest paths calculates the graph kernels. Each omic-pathway pair produces a graph kernel, as previously mentioned with the exception of expression based omic types producing two kernels per pathway. The graph kernels are then normalized. The resulting kernels are sometimes identity matrices meaning they do not contain any information. Thus, such kernels are filtered to improve perfor-mance of the PAMOGK in terms of memory usage and runtime. The remaining graph kernels are used in the next layer.
3.3
Clustering Patients into Sub-Groups
PAMOGK uses multi-view clustering algorithms to stratify patients. In order to compare results we produced several different kernel methods. One of the ear-liest adaptations was Average Kernel K-Means (AKKM) clustering which takes average of kernels to produce a single view and use Kernel K-Means [35]. This straightforward approach produced lower than comparable results. The reason for the results was attributed to the equal weighting of the kernels since not all kernels provided equal amounts of information for the final stratification and the AKKM assumed the information would be equal. Also high number of kernels made it very difficult for any one kernel to affect results.
We have also experimented with RBF kernel which had γ values determined by the median heuristic [36]. The RBF kernel then would reduce kernel matrices to a single kernel to produce same merging effect. The RBF kernel provided better results then AKKM was not robust against selection of kernels. If the number of kernels is high then the kernels that provide the most information would not get enough weight for them to be affect the results. These experiments led us to try different methods so we can merge kernels without losing or undermining the information they provide.
One of methods we have tried in this direction was MKKM-MR. MKKM-MR converts the clustering problem into an optimization problem and tries to solve it by finding optimal kernel matrix weights. [6, 28]. Another method we integrated was LMKKM which also does clustering through optimization but does it both for kernel matrix and sample weights [6, 28]. The difference of these methods is that instead of using heuristic approaches we are just calculating kernel weights that are more likely to produce distinct patient sub-groups. This way regardless of the number of kernels we can prioritize the kernels that provide the most information. Last iterations of PAMOGK uses SNF-KKM and SNF-Spectral methods, which are modified versions of Similarity Network Fusion that use Kernel K-Means and Spectral Clustering [6, 37, 38]. Both methods use SNF for fusing data
and modified versions of K-Means and Spectral Clustering for clustering. SNF have two parameters with values KS = 20, number of neighbors, and TS = 20, number of iterations. These are suggested values for the SNF algorithm and through our tests provided the best results for our graph sizes in PAMOGK [6]. Clustering methods all used a parameter k ∈ 2, 3, 4, 5 as number of clusters. In PAMOGK-Web we are using SNF-KKM compared against SNF-Spectral to provide the results.
3.4
Results and Evaluation
In PAMOGK we used survival analysis to evaluate our clustering results in line with previous works and used Kaplan-Meier survival curves and log-rank tests. [6, 39, 40, 41, 42, 43]. In this work we integrated the result evaluation as a new layer by using the same methodology of survival analysis as in PAMOGK. This new layer allowed us to provide more insights into our new tool PAMOGK-Web. In this layer we use the Kaplan-Meier survival curves and log-rank tests [43] to compare the survival distributions of clusters produced by clustering layer [44] to see if there is a statistical difference between survival times of patients in between clusters.
Chapter 4
Methods and Framework
4.1
Integration of Copy Number Variation Data
PAMOGK previously made use of several omics data such as gene expression, protein expression, and clinical results. In order to include CNV data to the pipeline we had to include two steps. First step is mapping CNV data to the patients that will be used by kernel generating algorithm of PAMOGK. The CNV data is in the format of gene by patient matrix that have GISTIC focal score provided by NCI - GDC platform. GISTIC calculates a G-Score by considering amount and frequency of the abnormalities in genomic alterations [45] and these scores are processed to find focal genes. These focal scores are calculated from a curated list of TCGA-KIRC studies and contain patient and gene identifiers which have the same source with identifiers of omics data used by the pipeline and pathways. This makes it easier to connect CNV data to previously used data types. Another mapping problem is to connect gene types provided by the CNV data to the pathway gene types. This step is crucial to produce meaningful graph kernel matrices to be used by the pipeline. Some of the patients which did not have complete mappings had to be removed to produce robust graph kernels. This caused a some difference of number of patients used by CNV only (402 patients) and multi-omics experiments (349 patients).
The next step is to calculate graph kernels from CNV focal scores. The focal scores shows amplifications as positive, deletions as negative, and 0 for inconclu-sive results. As in the expression data processing done in PAMOGK we generated separate graph kernels for amplifications and deletions to not lose information provided by type of variation [6].
The multi-omics data we used for the experiments includes omic data from 6 different data sets (see Supplementary Table A.1). Pathway data becomes the core of the PAMOGK algorithm to incorporate data from other omic data. Among these omic data gene expression, protein expression, and copy number variation data sets exhibit two different behaviour. Expression data sets mani-fest as under or over expression and CNV data show amplification and deletion. The different manifestations are considered as different kernels to capture the difference in behaviour, thus these omic data produces 2 kernels per pathway.
4.2
PAMOGK-Web
The aim of the PAMOGK-Web is the abstraction of PAMOGK experiment setup in order to both provide an easier interface for running experiments with differ-ent parameters and allow a larger range of users to be able to use the PAMOGK pipeline for cancer sub-type detection. PAMOGK-Web is separated into 3 mod-ules. The first module is user interface (UI) module that contains front-end only structures written in a modular JavaScript framework for ease of management and separation from business logic. The second module consists of a management module which is written in python for compatibility with PAMOGK pipeline but can be moved to other programming languages because of its decoupled struc-ture. The management module handles validation of logins, creation of exper-iment runs, and returning experexper-iment status and results. The third module is a worker module for both decoupling the management module from experiment running logic. This separation was needed because of the memory and processing power requirements of the experiments. The management-worker module separa-tion allows us to deploy these modules on different machines without any problem
as long as they can access same the database.
Figure 4.1: The figure showing PAMOGK-Web dashboard screen flowchart with possible flows.
4.2.1
Screens
In the preliminary version of the PAMOGK-Web we provided a user login based platform to prevent misuse and provide a better service for all users. In order to provide a better user experience (UX) we provided multiple login methods as it can be seen in Figure 4.2.
Figure 4.2: The figure showing PAMOGK-Web login screen with multiple login methods that include Google Single Sign for easier login of gmail users and email for all users.
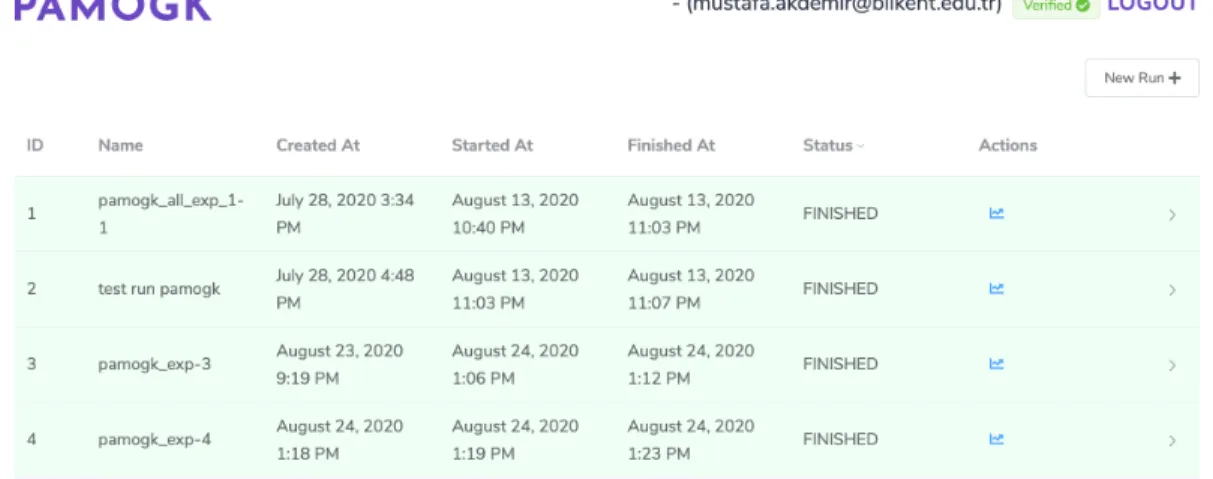
The user can see a list of previously ran experiments on the main screen as shown in Figure 4.3. The experiments can be in different states such as queued, running, finished, or if some problem occurred failed. These states can be viewed in experiments screen to give user an insight their experiments. Also this screen
provides necessary links to the experiment logs for running and finished experi-ments, and details screen for finished experiments.
Figure 4.3: The figure showing PAMOGK-Web experiments screen with experi-ment summary information such as creation/running timings, state of the exper-iments, and necessary links to more details about the experiments.
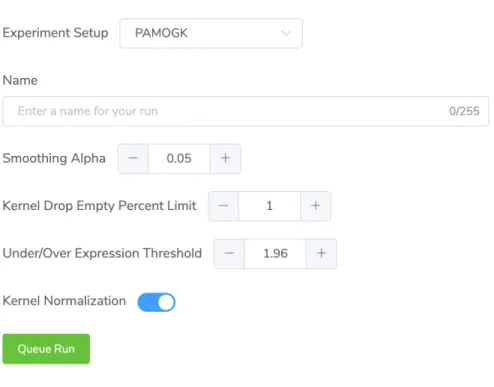
The user can create a new experiment run, which we can simply call a run, with selected parameters through the dashboard page. The experiment creation dialog opens above table of experiments to not distract users. Through this dialog user can select experiment upon which supported parameters for the experiment will be shown with sensible default values to make getting started easier.
Figure 4.4: The figure showing PAMOGK-Web experiment creation screen with different experiment parameters supported by the experiment.
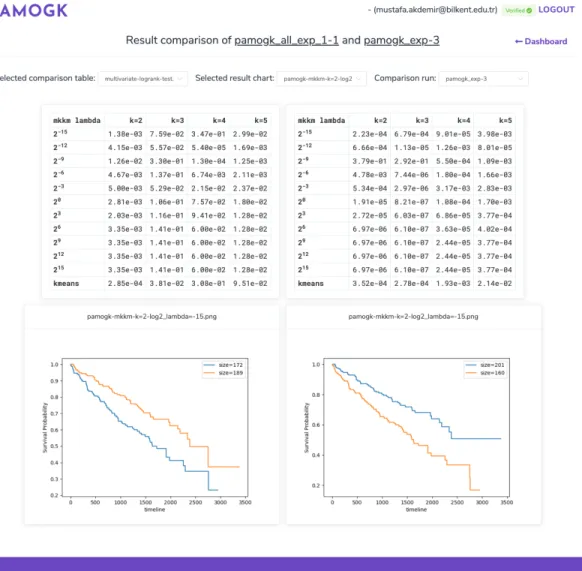
The last screen is the experiment results screen that shows a summary of the experiment and also provides a comparison feature to compare different experi-ment setups for same parameters. These screens include p-value tables and cluster survival curves produced by the pipeline’s label analysis steps (Figures 4.5 and 4.6).
Figure 4.5: The figure showing PAMOGK-Web experiment results screen with options to filter experiment results depending on different run parameters.
Figure 4.6: The figure showing PAMOGK-Web experiment results screen with comparison feature that enables users to compare results of two experiment se-tups. Users can also filter results with experiment parameters such as number of clusters.
Chapter 5
Results
5.1
CNV Experiment Results
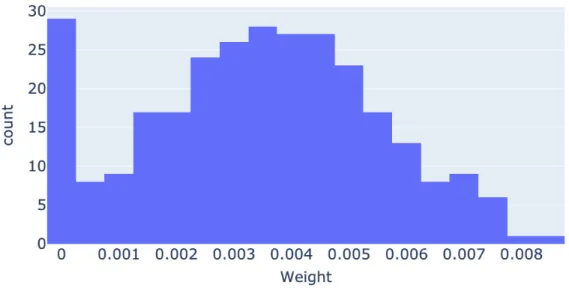
In CNV experiments we first tested the CNV only setup to check if the information provided by CNV data was informative by itself. These tests showed that for number of clusters k = 2 most of the results were not significant (p > 0.05). Also the best p-values were produced by higher smoothing alpha values, α ≥ 0.7. The kernel weights are also very evenly distributed, similar to normal distribution (Figure 5.2), which shows most of the information from CNV data was well distributed. The fact that weights are distributed similar to normal distribution might give the impression this is caused by randomness of the results. Yet, the weight distribution is not directly related to the results but the distribution of information among kernels. If some of the kernels provided more information weights would have shifted in favor of those kernels. One cause of this evenly distribution could be the amount of data from CNV data set which is more than total of other datasets combined. If the CNV data is used by itself this would allow it to be evenly distributed and cause weights to be normalized. The kernels that were assigned a 0 weight on the other hand shows that the information from that specific pathway was very sparse or very similar across training patients. Such kernels can be produced by pathways that rarely have any gene with CNV.
(a) α = 0.7, k=5, λ = 2−15 (b) α = 0.8, k=3, λ = 2−12
Figure 5.1: Kaplan-Meier survival curves of the best clustering solutions for KIRC for number of cluster k = 5, k = 3 with smoothing parameter α = 0.7, α = 0.8 and λ = 2−15, λ = 2−12 for (a) and (b) respectively. The p-value is the a log-rank test on the survival distributions of between the groups.
Figure 5.2: The figure showing histogram of kernel weights of CNV only experi-ment for k = 3 and λ = 2−12.
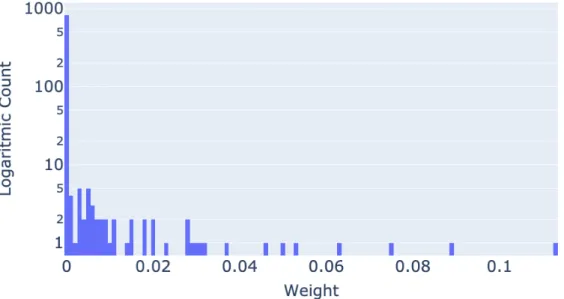
Figure 5.3: The figure showing histogram of kernel weights of complete omic data set experiment for k = 3 and λ = 2−3.
In the multi-omic experiments with CNV data we received results similar to the experiments without CNV data. The kernel weight matrices showed that in multi-omics experiments other kernel matrices weighted out the CNV kernel matrices causing an imbalance and lower the amount of information we can extract from CNV data. Figure 5.3 shows that most of the kernels were assigned lower weights which included most of CNV kernels. The reason this is very different from CNV only experiments can be attributed to the information provided by the other omic data types. If CNV kernels are normalized among themselves and a new kernel which is providing a lot of information than the ones belonging to CNV, then this new kernel is expected to out-weight the CNV kernels.
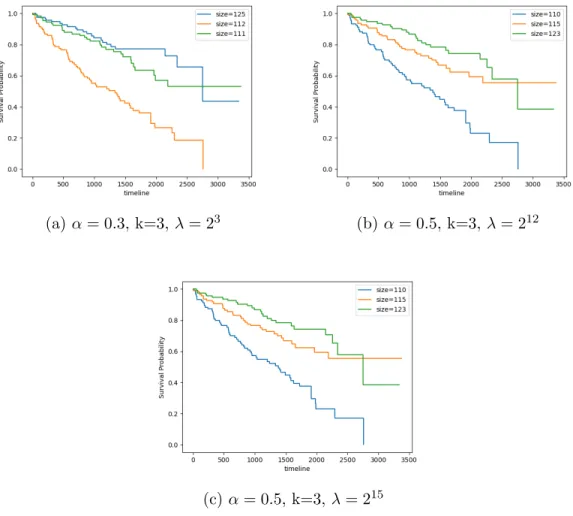
(a) α = 0.3, k=3, λ = 23 (b) α = 0.5, k=3, λ = 212
(c) α = 0.5, k=3, λ = 215
Figure 5.4: Kaplan-Meier survival curves of the best clustering solutions for KIRC for number of cluster k = 3 with smoothing parameter α = 0.3, α = 0.5, α = 0.5 and λ = 23, λ = 212, λ = 215, respectively. The p-value is the a log-rank test on the survival distributions of between the groups.
λ \ cluster id 2 3 4
2−15 6.03e-03 1.59e-02 3.92e-01
2−12 2.60e-01 2.86e-02 6.49e-04
2−9 3.99e-01 1.38e-03 1.98e-02
2−6 7.69e-02 2.42e-02 8.56e-01
2−3 8.92e-02 2.11e-10 2.13e-05
1 7.72e-02 8.05e-05 4.08e-09
23 4.18e-09 1.32e-01 1.14e-04
26 8.70e-10 1.16e-01 1.14e-04
29 8.70e-10 1.16e-01 1.14e-04
212 8.70e-10 1.16e-01 1.14e-04
215 8.70e-10 1.16e-01 1.14e-04
Table 5.1: This table shows one vs. all log-rank test p-values from clusters pro-duced by PAMOGK including CNV data for parameters α = 0.3 and k = 5.
5.2
Runtime and Memory Analysis
The PAMOGK-Web management module uses a small amount of memory (50mb) and processing power (less than 15s CPU time) that in measurements they were negligible. The measurements were done on a computer with higher than 8GB memory and 2.2 GHz Quad-Core CPU. In the measurements processing power was shown to be the bottleneck for large number of graph kernels. The PAMOGK-Web uses a file based caching method to store some data used by pipeline to prevent recalculation of intermediate information that are common between runs. This improves the performance of subsequent runs with similar parameters on same data sets since most of the time is spent on these preparation steps as the effect can be seen in Figure 5.5.
Figure 5.5: The figure showing runtime and memory pressure graphics depending on the caching used. The peaks of each line shows the clustering algorithm producing memory pressure by loading all kernels from disk. The longer run showing the algorithm without any data pre-processing.
Chapter 6
Conclusion and Future Work
The results of the CNV experiments did not show the expected improvement which can be largely attributed to the kernel weight distributions. Since same CNV kernels provided information by themselves in CNV only experiments, we can infer that either kernels were providing stronger signals. This experiment can also show that the PAMOGK is robust to extra information provided by multi-omics data sets by lowering those kernels’ weights. The results of CNV ex-periments should not conclude that CNV data is not helpful in multi-omics clus-tering methods since the dataset used included only one type of cancer (KIRC), and different cancer types may include sub-types with different molecular profiles. Thus in the future we should test the CNV included pipeline against other cancer cohorts as well. We can argue that using different subsets of omic types could make CNV more apparent but this would be missing the information provided by complete data set and also one of the advantages of PAMOGK it can balance information from different types of omic data. Thus it might show better results in terms of effect of CNV data on results but would undermine possible results from other omic data set which already proves to provide better information.
The PAMOGK-Web framework can make running preset experiments much easier, faster through caching, and accessible for a general user base. Yet, as a new framework many features can be added to improve its usability. For instance
as this work shows kernel weights distributions provide insights into how different omic data affects clustering results. Although this information is calculated by the PAMOGK it is not available through PAMOGK-Web. Also visualization of experiment results can be improved to include more metrics. Another future improvement can be merged and dynamic graphs for comparison view to make comparisons easier. In terms of performance, PAMOGK-Web calculation module can be deployed on multiple machines to provide a much better performance and project can be improved in this direction as well.
Bibliography
[1] C. Curtis, S. P. Shah, S.-F. Chin, G. Turashvili, O. M. Rueda, M. J. Dun-ning, D. Speed, A. G. Lynch, S. Samarajiwa, Y. Yuan, et al., “The genomic and transcriptomic architecture of 2,000 breast tumours reveals novel sub-groups,” Nature, vol. 486, no. 7403, p. 346, 2012.
[2] J. N. Weinstein, E. A. Collisson, G. B. Mills, K. R. M. Shaw, B. A. Ozen-berger, K. Ellrott, I. Shmulevich, C. Sander, J. M. Stuart, C. G. A. R. Net-work, et al., “The cancer genome atlas pan-cancer analysis project,” Nature genetics, vol. 45, no. 10, p. 1113, 2013.
[3] M. F. M¨uller, A. E. Ibrahim, and M. J. Arends, “Molecular pathological classification of colorectal cancer,” Virchows Archiv, vol. 469, no. 2, pp. 125– 134, 2016.
[4] R. G. Verhaak, K. A. Hoadley, E. Purdom, V. Wang, Y. Qi, M. D. Wilker-son, C. R. Miller, L. Ding, T. Golub, J. P. Mesirov, G. Alexe, M. Lawrence, M. O’Kelly, P. Tamayo, B. A. Weir, S. Gabriel, W. Winckler, S. Gupta, L. Jakkula, H. S. Feiler, J. G. Hodgson, C. D. James, J. N. Sarkaria, C. Bren-nan, A. Kahn, P. T. Spellman, R. K. Wilson, T. P. Speed, J. W. Gray, M. Meyerson, G. Getz, C. M. Perou, and D. N. Hayes, “Integrated genomic analysis identifies clinically relevant subtypes of glioblastoma characterized by abnormalities in PDGFRA, IDH1, EGFR, and NF1,” Cancer Cell, vol. 17, pp. 98–110, Jan. 2010.
[5] A. Toss and M. Cristofanilli, “Molecular characterization and targeted ther-apeutic approaches in breast cancer,” Breast Cancer Research, vol. 17, no. 1, p. 60, 2015.
[6] Y. I. Tepeli, A. B. ¨Unal, F. M. Akdemir, and O. Tastan, “PAMOGK: a pathway graph kernel-based multiomics approach for patient clustering,” Bioinformatics, July 2020.
[7] C. F. Schaefer, K. Anthony, S. Krupa, J. Buchoff, M. Day, T. Hannay, and K. H. Buetow, “PID: the pathway interaction database,” Nucleic Acids Re-search, vol. 37, pp. D674–D679, Oct. 2008.
[8] T. C. G. A. R. Network and et al., “Comprehensive molecular characteri-zation of clear cell renal cell carcinoma,” Nature, vol. 499, pp. 43–49, June 2013.
[9] N. Rappoport and R. Shamir, “Multi-omic and multi-view clustering al-gorithms: review and cancer benchmark,” Nucleic acids research, vol. 46, no. 20, pp. 10546–10562, 2018.
[10] R. Shen, A. B. Olshen, and M. Ladanyi, “Integrative clustering of multiple genomic data types using a joint latent variable model with application to breast and lung cancer subtype analysis,” Bioinformatics, vol. 25, pp. 2906– 2912, 09 2009.
[11] Q. Mo, S. Wang, V. E. Seshan, A. B. Olshen, N. Schultz, C. Sander, R. S. Powers, M. Ladanyi, and R. Shen, “Pattern discovery and cancer gene iden-tification in integrated cancer genomic data,” Proceedings of the National Academy of Sciences, vol. 110, no. 11, pp. 4245–4250, 2013.
[12] Q. Mo, R. Shen, C. Guo, M. Vannucci, K. S. Chan, and S. G. Hilsenbeck, “A fully bayesian latent variable model for integrative clustering analysis of multi-type omics data,” Biostatistics, vol. 19, pp. 71–86, May 2017.
[13] D. Wu, D. Wang, M. Q. Zhang, and J. Gu, “Fast dimension reduction and integrative clustering of multi-omics data using low-rank approximation: ap-plication to cancer molecular classification,” BMC Genomics, vol. 16, Dec. 2015.
[14] S. Monti, P. Tamayo, J. Mesirov, and T. Golub, “Consensus clustering: a resampling-based method for class discovery and visualization of gene ex-pression microarray data,” Machine learning, vol. 52, no. 1-2, pp. 91–118, 2003.
[15] D. N. Hayes, S. Monti, G. Parmigiani, C. B. Gilks, K. Naoki, A. Bhattachar-jee, M. A. Socinski, C. Perou, and M. Meyerson, “Gene expression profiling reveals reproducible human lung adenocarcinoma subtypes in multiple in-dependent patient cohorts,” Journal of Clinical Oncology, vol. 24, no. 31, pp. 5079–5090, 2006.
[16] T. Nguyen, R. Tagett, D. Diaz, and S. Draghici, “A novel approach for data integration and disease subtyping,” Genome research, vol. 27, no. 12, pp. 2025–2039, 2017.
[17] K. A. Hoadley, C. Yau, D. M. Wolf, A. D. Cherniack, D. Tamborero, S. Ng, M. D. Leiserson, B. Niu, M. D. McLellan, V. Uzunangelov, et al., “Multi-platform analysis of 12 cancer types reveals molecular classification within and across tissues of origin,” Cell, vol. 158, no. 4, pp. 929–944, 2014.
[18] N. Rappoport and R. Shamir, “Multi-omic and multi-view clustering algo-rithms: review and cancer benchmark,” Nucleic Acids Research, vol. 46, pp. 10546–10562, 10 2018.
[19] B. Wang, A. M. Mezlini, F. Demir, M. Fiume, Z. Tu, M. Brudno, B. Haibe-Kains, and A. Goldenberg, “Similarity network fusion for aggregating data types on a genomic scale,” Nature methods, vol. 11, no. 3, p. 333, 2014. [20] A. Kumar, P. Rai, and H. Daum´e, III, “Co-regularized multi-view spectral
clustering,” in Proceedings of the 24th International Conference on Neural Information Processing Systems, NIPS’11, (USA), pp. 1413–1421, Curran Associates Inc., 2011.
[21] N. F. Chikhi, “Multi-view clustering via spectral partitioning and local re-finement,” Information Processing & Management, vol. 52, pp. 618–627, July 2016.
[22] U. Von Luxburg, “A tutorial on spectral clustering,” Statistics and comput-ing, vol. 17, no. 4, pp. 395–416, 2007.
[23] D. M. Witten and R. J. Tibshirani, “Extensions of sparse canonical correla-tion analysis with applicacorrela-tions to genomic data,” Statistical Applicacorrela-tions in Genetics and Molecular Biology, vol. 8, pp. 1–27, Jan. 2009.
[24] K. Chaudhuri, S. M. Kakade, K. Livescu, and K. Sridharan, “Multi-view clustering via canonical correlation analysis,” in Proceedings of the 26th an-nual International Conference on Machine Learning, pp. 129–136, ACM, 2009.
[25] S. Yu, L. Tranchevent, X. Liu, W. Glanzel, J. A. Suykens, B. De Moor, and Y. Moreau, “Optimized data fusion for kernel k-means clustering,” IEEE Transactions on Pattern Analysis and Machine Intelligence, vol. 34, no. 5, pp. 1031–1039, 2011.
[26] B. Scholkopf and A. J. Smola, Learning with Kernels: Support Vector Ma-chines, Regularization, Optimization, and Beyond. Cambridge, MA, USA: MIT Press, 2001.
[27] N. K. Speicher and N. Pfeifer, “Integrating different data types by regularized unsupervised multiple kernel learning with application to cancer subtype discovery,” Bioinformatics, vol. 31, no. 12, pp. i268–i275, 2015.
[28] M. G¨onen and A. A. Margolin, “Localized data fusion for kernel k-means clustering with application to cancer biology,” in Proceedings of the 27th In-ternational Conference on Neural Information Processing Systems - Volume 1, NIPS’14, (Cambridge, MA, USA), pp. 1305–1313, MIT Press, 2014. [29] A. B. ¨Unal and O. Tastan, “Identification of cancer patient subgroups via
smoothed shortest path graph kernel,” in NeurIPS 2016 Workshop on Ma-chine Learning in Computational Biology, vol. abs/1612.04431, 2016.
[30] A. Feragen, N. Kasenburg, J. Petersen, M. de Bruijne, and K. Borgwardt, “Scalable kernels for graphs with continuous attributes,” in Advances in Neural Information Processing Systems 26 (C. J. C. Burges, L. Bottou,
M. Welling, Z. Ghahramani, and K. Q. Weinberger, eds.), pp. 216–224, Cur-ran Associates, Inc., 2013.
[31] N. Shervashidze, P. Schweitzer, E. J. v. Leeuwen, K. Mehlhorn, and K. M. Borgwardt, “Weisfeiler-lehman graph kernels,” Journal of Machine Learning Research, vol. 12, no. Sep, pp. 2539–2561, 2011.
[32] K. M. Borgwardt and H.-P. Kriegel, “Shortest-path kernels on graphs,” in Data Mining, Fifth IEEE International Conference on, pp. 8–pp, IEEE, 2005.
[33] M. Neumann, R. Garnett, C. Bauckhage, and K. Kersting, “Propagation kernels: Efficient graph kernels from propagated information,” Mach. Learn., vol. 102, pp. 209–245, Feb. 2016.
[34] M. Togninalli, E. Ghisu, F. Llinares-L´opez, B. Rieck, and K. Borgwardt, “Wasserstein weisfeiler-lehman graph kernels,” in Advances in Neural In-formation Processing Systems 32, pp. 6439–6449, Curran Associates, Inc., 2019.
[35] B. Sch¨olkopf, A. Smola, and K.-R. M¨uller, “Nonlinear component analysis as a kernel eigenvalue problem,” Neural Computation, vol. 10, pp. 1299–1319, July 1998.
[36] D. Sejdinovic, A. Gretton, and W. Bergsma, “A kernel test for three-variable interactions,” in Proceedings of the 26th International Conference on Neu-ral Information Processing Systems - Volume 1, NIPS’13, (Red Hook, NY, USA), p. 1124–1132, Curran Associates Inc., 2013.
[37] B. Wang, A. M. Mezlini, F. Demir, M. Fiume, Z. Tu, M. Brudno, B. Haibe-Kains, and A. Goldenberg, “Similarity network fusion for aggregating data types on a genomic scale,” Nature Methods, vol. 11, pp. 333–337, Jan. 2014. [38] D. Zhou and C. J. Burges, “Spectral clustering and transductive learning with multiple views,” in Proceedings of the 24th international conference on Machine learning, pp. 1159–1166, ACM, 2007.
[39] J. Liu and et al., “An integrated TCGA pan-cancer clinical data resource to drive high-quality survival outcome analytics,” Cell, vol. 173, pp. 400– 416.e11, Apr. 2018.
[40] R. Liang, M. Wang, G. Zheng, H. Zhu, Y. Zhi, and Z. Sun, “A comprehensive analysis of prognosis prediction models based on pathway-level, gene-level and clinical information for glioblastoma,” International Journal of Molecu-lar Medicine, July 2018.
[41] C. J. Ricketts and et al., “The cancer genome atlas comprehensive molecular characterization of renal cell carcinoma,” Cell Reports, vol. 23, pp. 313– 326.e5, Apr. 2018.
[42] E. Gabasova, J. Reid, and L. Wernisch, “Clusternomics: Integrative context-dependent clustering for heterogeneous datasets,” PLoS computational biol-ogy, vol. 13, no. 10, p. e1005781, 2017.
[43] P. K. M. Kumar Goel and J. Kishore, “Understanding survival analysis: Kaplan-meier estimate,” CoRR, vol. abs/1607.00653, 2016.
[44] D. P. Harrington and T. R. Fleming, “A class of rank test procedures for censored survival data,” Biometrika, vol. 69, no. 3, pp. 553–566, 1982. [45] C. H. Mermel, S. E. Schumacher, B. Hill, M. L. Meyerson, R. Beroukhim, and
G. Getz, “GISTIC2.0 facilitates sensitive and confident localization of the targets of focal somatic copy-number alteration in human cancers,” Genome Biology, vol. 12, Apr. 2011.
Appendix A
Supplementary Tables
Table A.1: Data sources and their download dates of datasets used in PAMOGK experiments.
Data Source Download Date
Somatic Mutations https://www.synapse.org/#!Synapse:syn1701259 March 24, 2019 Gene Expression https://www.synapse.org/#!Synapse:syn417925.5 April 24, 2019 Protein Expression https://www.synapse.org/#!Synapse:syn416783.3 April 24, 2019 Clinical Data https://www.synapse.org/#!Synapse:syn417024.7 April 24, 2019 Pathway Data https://ndexbio.org/#/networkset/8a2d7ee9-1513-11e9-bb6a-0ac135e8bacf April 24, 2019 CNV Data https://portal.gdc.cancer.gov/files/c0bcad87-5fe8-4100-ab59-5ae1a8c0e8d7 October 13, 2020
Table A.2: This table shows preliminary analysis of pathway data set which consists of 165 pathways.
Average Median Max. number of Min. number of
Nodes 44.6 42 142 2
Edges 231.9 181 1277 1
Table A.3: This table shows the number of unique genes in each omic data set Gene expression Protein Expression Somatic Mutation Copy Number Variation
Table A.4: This table shows the hyper-parameters used in different algorithms. RBF values are selected using the median heuristic.
Parameter Symbol Used in Possible value(s) Number of clusters k All clustering methods {2, 3, 4, 5}
Smoothing α Kernel construction of SmSPK {0, 0.01, 0.05, 0.1, 0.2, 0.3, 0.4, 0.5, 0.6, 0.7, 0.8, 0.9} Trade-off λ MKKM-MR 2{−15,−12,−9,··· ,9,12,15}
RBF γ
Somatic Mutation 6.41e-03 Gene Expression 8.01e-04 Protein Expression 1.11e-01
Number of neighbors Ks SNF 20
Number of iterations Ts SNF 20 Max. number of iterations Tl LMKKM 50