MODELLING R&D AND HUMAN CAPITAL FOR UNITED STATES AND EUROPEAN UNION
ECONOMIES A Master’s Thesis by YASEMİN KARA Department of Economics
İhsan Doğramacı Bilkent University Ankara
MODELLING R&D AND HUMAN CAPITAL FOR UNITED STATES AND EUROPEAN UNION ECONOMIES
Graduate School of Economics and Social Sciences of
˙Ihsan Do˘gramacı Bilkent University
by
YASEM˙IN KARA
In Partial Fulfilment of the Requirements for the Degree of MASTER OF ARTS
in
THE DEPARTMENT OF ECONOMICS ˙IHSAN DO ˘GRAMACI B˙ILKENT UNIVERSITY
ANKARA July 2012
I certify that I have read this thesis and have found that it is fully ade-quate, in scope and in quality, as a thesis for the degree of Master of Arts in Economics.
————————————– Prof. Erin¸c Yeldan Supervisor
I certify that I have read this thesis and have found that it is fully ade-quate, in scope and in quality, as a thesis for the degree of Master of Arts in Economics.
————————————–
Assoc. Prof. S¨uheyla ¨Ozyıldırım Examining Committee Member
I certify that I have read this thesis and have found that it is fully ade-quate, in scope and in quality, as a thesis for the degree of Master of Arts in Economics.
————————————–
Assist. Prof. H¨useyin C¸ a˘grı Sa˘glam Examining Committee Member
Approval of the Graduate School of Economics and Social Sciences
————————————– Prof. Erdal Erel Director
ABSTRACT
MODELLING R&D AND HUMAN CAPITAL FOR UNITED STATES AND EUROPEAN UNION ECONOMIES
Kara, Yasemin
M.A., Department of Economics Supervisor: Prof. Dr. Erin¸c Yeldan
July 2012
In this thesis, regarding technological improvements and formation of human capital as the engine of growth, I investigated public policy whose ob-jective is to enhance Total Factor Productivity (TFP) through investments in innovation for United States (US) and European Union (EU) economies. To this end, first I documented and compared the R&D expenditures and human capital expenditures of US and EU countries for last two decades. Then, taking 2008 as base year I constructed Social Accounting Matrices (SAM) for both economies. Finally, I conducted subsidization policy with a general equilibrium model and investigated effects of public policy on eco-nomic growth, social wealth and welfare. In this study, I found that R&D subsidization policy enhances economic growth, social wealth and welfare in both countries but the enhancement is larger for EU economy.
¨ OZET
AMER˙IKA B˙IRLES¸ ˙IK DEVLETLER˙I VE AVRUPA B˙IRL˙I ˘G˙I EKONOM˙ILER˙I ˙IC¸ ˙IN AR-GE VE BES¸ER˙I SERMAYE MODELLEMES˙I
Kara, Yasemin
Y¨uksek Lisans, ˙Iktisat B¨ol¨um¨u Tez Y¨oneticisi: Prof. Dr. Erin¸c Yeldan
Temmuz 2012
Bu tezde, teknolojik geli¸smeleri ve be¸seri sermaye olu¸sumunu b¨uy¨umenin temeli olarak g¨orerek Total Fakt¨or Verimlili˘gini (TFV) icatlara yatırım ya-parak arttırmayı ama¸clayan bir kamu politikasının etkilerini Amerika Birle¸sik Devletleri (ABD) ve Avrupa Birli˘gi (AB) ¨Ulkeleri ekonomileri i¸cin inceledim. Bu ama¸cla, ABD ve AB’nin Ar-Ge harcamalarını ve be¸seri sermaye harca-malarını son 20 yıl i¸cin ara¸stırdım ve kar¸sıla¸stırdım. Daha sonra, 2008 yılı i¸cin bu iki ekonominin Sosyal Hesaplamalar Matrislerini (SHM) olu¸sturdum. Son olarak, genel denge modeli kullanarak te¸svik politikası uyguladım ve bu politikanın ekonomik b¨uy¨ume, sosyal refah ve zenginlik ¨uzerine etki-lerini inceledim. Bu ¸calı¸smada, Ar-Ge te¸svik politikasının her iki ¨ulke i¸cinde ekonomik b¨uy¨umeyi, sosyal refahı ve zenginli˘gi artırtıdı˘gını ancak bu artı¸sın AB i¸cin daha fazla oldu˘gunu buldum.
ACKNOWLEDGEMENTS
I would like to give a sincere thank you to my supervisor Erin¸c Yeldan for his support and guidance and for the opportunity to do this study.
I would like to thank Assoc. Prof. S¨uheyla ¨Ozyıldırım and Assist. Prof. H¨useyin C¸ a˘grı Sa˘glam for reading my thesis and for their innovative comments.
On a personal level, my most heartfelt thanks go to Kıvan¸c G¨ung¨or for his endless support, understanding and being near me. Last but by no means least, I would like to thank my parents and my brother for all their advice and encouragement during the thesis process.
TABLE OF CONTENTS ABSTRACT...iii ¨ OZET...iv ACKNOWLEDGEMENTS...v TABLE OF CONTENTS...vi LIST OF TABLES...vii LIST OF FIGURES...viii CHAPTER 1: INTRODUCTION...1
CHAPTER 2: LITERATURE REVIEW...3
CHAPTER 3: R&D AND HUMAN CAPITAL EXPENDITURES...7
3.1 R&D Expenditures in US and EU...8
3.2 Human Caital Expenditures in US and EU...14
CHAPTER 4: METHODOLOGY...17
4.1 Model...17
4.2 SAM Framework...21
CHAPTER 5: POLICY ANALYSIS...23
CHAPTER 6: CONCLUSION...25
BIBLIOGRAPHY...28
LIST OF TABLES
1 Example of a SAM . . . 22 2 Splitting GERD by the sectors of performance Data source:
Eurostat . . . 45 3 Splitting The GERD by the sources of funds Data source:
Eurostat . . . 46 4 Annual data graduation on from tertiary education according
to ISCED97 Data source: Eurostat . . . 47 5 GBAORD - R&D Appropriations Data source: Eurostat . . . 48 6 GBAORD - Education Data source: Eurostat . . . 49 7 GBAORD - R&D Appropriations as % of GDP Data source:
Eurostat . . . 50 8 GBAORD - Education Data source: Eurostat . . . 51 9 Public expenditure on education as a % of GDP Data source:
LIST OF FIGURES
1 R&D Funding and Performance System (Table is taken from GBAORD Eurostat Report 2008) . . . 31 2 GDP in current US dollars and GERD as a percentage of GDP 32 3 GERD as a percentage of GDP and % of BERD in GERD by
source of funds . . . 33 4 Share of young and old firms in EU and US . . . 34 5 % of GOVERD in GERD by source of funds and % of HERD
in GERD by source of funds . . . 35 6 Total researchers (FTE) in business enterprise sector and Patents
granted by the United States Patent and Trademark Office (USPTO) . . . 36 7 Patents applications to the European Patent Office (EPO) and
Total GBAORD as a % of total general government expenditure 37 8 Private expenditure on education as % of GDP and Public
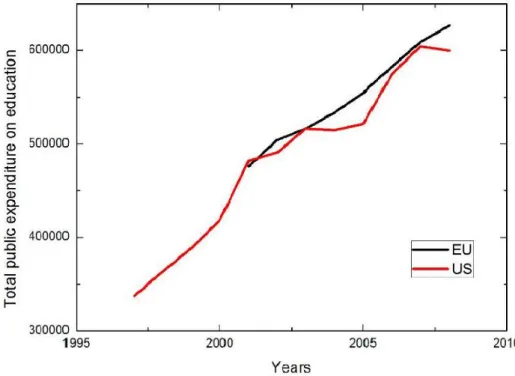
expenditure on education as % of GDP . . . 38 9 Total public expenditure on education Units: Millions EUR
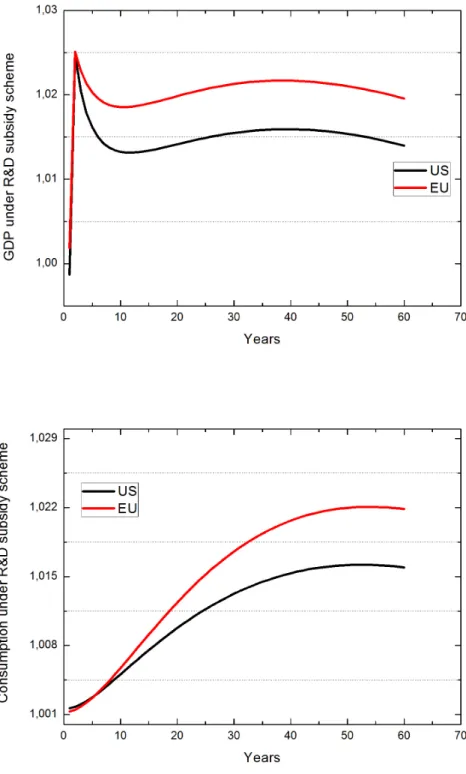
PPS . . . 39 10 GDP and consumption under R&D subsidy scheme . . . 40 11 Price of R&D and total human capital under R&D subsidy
12 Total R&D and wage rate of human capital under R&D sub-sidy scheme . . . 42 13 SAM For US 2008 . . . 43 14 SAM For EU 2008 . . . 44
CHAPTER 1
INTRODUCTION
In the standard neoclassical growth models, the source of growth is capital accumulation while the transitional dynamics have been taking place. These models are not genuinely a sustained growth model because investments are made in capital fail to be the reason of economic growth in the long run. Unless there would be an exogenous technology shock, the economy would reproduce itself over and over again for years. In the neoclassical world re-search activities can be seen as an alternative form of capital investment. The formulation of neoclassical technology is updated by Paul Romer as the ultimate source of growth in a market optimization framework. The new growth theory highlights the roles of research and development (R&D) ac-tivities and accumulation of human capital to explain the per capita income differences, productivity growth and welfare. Improvement of technological innovations will have eventually a positive impact on the final goods (also on productivity and competitiveness) hence, improves economic growth. In ad-dition, the new approach does not ignore the distortions associated with the R&D activities such as monopoly pricing, intertemporal knowledge spillovers, congestion externalities, and creative destruction. In this thesis, regarding
technological improvements and formation of human capital as the engine of growth, I try to investigate public policy whose objective is to enhance total factor productivity through investments in innovation for US and EU economies1. US and EU constituted approximately 40% of world’s GDP in
2010. Since the GDP is the total value of all goods and services produced within that country in a year, it is mostly regarded as a measure of the economic power of a country. US and EU are the largest and dominating economies in the world. In terms of economic development both are ahead of the others and they are also leaders in investing in R&D activities. Af-ter examining the sectoral decomposition of both countries, it is shown that there are structural differences in the industries of those countries causing a quantitative difference in investing in R&D activities. As I shall discuss in Chapter 5, each country responds differently to the R&D subsidization policy.
Outline of the thesis is as follows; Chapter 2 is review of the theoretical and empirical literature mainly based on neoclassical and endogenous growth theories. In Chapter 3, I try to document and compare the data of R&D and human capital expenditures of US and EU. Chapter 4 consists of methodol-ogy including the Social Accounting Matrix (SAM) framework. In Chapter 5, I present the results of R&D subsidization policy and Chapter 6 is the conclusion part.
CHAPTER 2
LITERATURE REVIEW
In last two decades there were significant contributions to the R&D based growth models in order to explain income per capita, growth rate and pro-ductivity differences across countries. Romer (1990) constructed a model with endogenized, non-rival and partially excludable technology which is the engine of growth. Unlike Solow (1956), market incentives have an important role in the translation process where new knowledge is turned into goods with economic value. Grossman and Helpman (1991) analyses the role of intentional industrial innovations on growth. Main aim of R&D is expanding the set of variety of products. Each product follows a stochastic progression up to a quality ladder. In other words, it is a model of horizontal innova-tions. However, equilibrium is determined by aggregate rate of innovations which is constant and determinate in the steady state. The welfare proper-ties of the model where the growth rate responds to profit incentives in the R&D sector were studied. Whereas in Aghion and Howitt (1992) uncertain research activities leads a random sequence of quality improving innovation that lies in the heart of the growth. This is a vertical innovation model which has a property of obsolescence that directly implies creative
destruc-tion, thus the Schumpeterian nature. In all approaches described above have the same nature in driving economic growth by innovations, and accumula-tion of knowledge is the source of innovative growth.
In the literature there are many theoretical models of growth indicating the crucial role played by human capital in the form of education. Nelson and Phelps (1966) and Lucas (1988) are the pioneering works that highlights the emphasis of human capital. Although their work is emphasizing the same concept, there is a dichotomy that growth is driven by stock of human capital (Nelson and Phelps (1966)) vs. human capital accumulation (Lucas (1988)). Also King and Rebelo (1993) and Barro and Sala-i-Martin (1995) treated human capital as a central concept to economic growth. There are also empirical exercises with wide range of countries such as Romer (1990a) and Barro (1991).
Funke and Strulink (2000) proposed a model that combines Uzawa Lucas framework (where human capital has a positive external effect on goods sec-tor) and Grossman and Helpman (1991) model, and studied its convergence. They set up an endogenous growth model with physical capital, human capi-tal and blueprints for intermediate goods. Their model emphasizes the role of physical capital which allows an analysis that encompasses the development process towards an innovating economy characterized by extensive growth and accumulation of skills. In their economy, physical capital contributes in large parts to income per capita growth. However long-run growth is gen-erated by incentives to innovate and this long-run growth surpasses growth
through factor accumulation and quality improvement. Since innovations require knowledge accumulation, cruciality of education and training is re-flected in their work. They assume output of new ideas is merely determined by the aggregate knowledge employed in R&D sector and exclude decreasing returns as well as scale effects in varieties.
As well as the positive impact of human capital on economic growth and welfare, it is known that externalities driven by R&D activities have an impact on economic growth and welfare, too. The sign of this impact is related to whether there is an overinvestment or underinvestment in R&D in decentralized equilibrium. Since R&D is a key determinant of long run productivity and welfare, many studies in the literature deal with the ques-tion that whether a decentralized economy undertakes too little or too much R&D. In the literature, empirical evidence shows that decentralized equi-librium typically underinvests in R&D relative to what is socially optimal. Jones and Williams (2000) shed light on this issue by arguing that a conserva-tive estimate indicates that optimal investment in research is more than two to four times actual investment. Thus, conventional wisdom requires a sub-sidization policy. In 2002, The Barcelona European Council has reached an agreement on increasing the average research investment expenditures from 1.9% of GDP to 3% of GDP by 2010, of 2/3 should be funded by the private sector. Also the Council had showed the incentives to support the private firms financially by arguing public support is justified by the recognized fail-ure of the market to induce business investment in research to attain optimal level (COM 2003).
Sequeira (2008) made a numerical analysis to compare the quantitative effects of R&D policy with the quantitative effects of human capital policy in wealth and welfare. On the other hand, Sequeira (2008) argued the skills may also be accumulated through the contact to aggregated technological knowl-edge of economy and this contact with technologies is made using the stock of individual human capital. Also the presumption on accumulation of human capital is enhanced by the new effect called ‘learning with varieties’ besides schooling. His conclusion indicates that although R&D subsidy influences growth, wealth and welfare, subsidies to schooling proved to be more income and welfare enhancing. Most recently, Voyvoda and Yeldan (2011) analy-ses the Turkish economy to examine the interaction between accumulation of human capital, knowledge driven growth and the effect of public policy. They studied the subsidization of human capital through skill accumulation against subsidization of R&D activities. Their results shows that educa-tion subsidy yields more favorable results than R&D subsidy with respect to steady-state growth rates, both in terms of output and the knowledge stock of the economy.
I will be on the path of these types of most recent applied pure policy anal-ysis calibration exercises by following the footprints of Voyvoda and Yeldan (2011) and my purpose of this study is a general equilibrium investigation of R&D policy across the Atlantic.
CHAPTER 3
R&D AND HUMAN CAPITAL EXPENDITURES
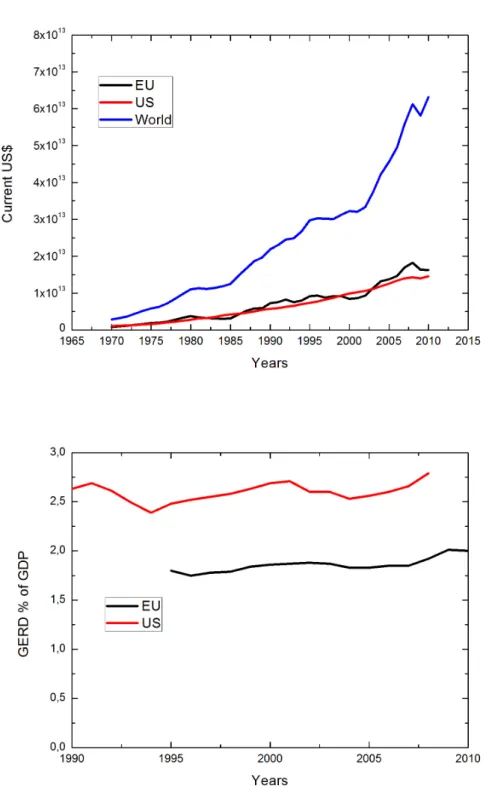
The Gross Domestic Expenditure on R&D (GERD) is the total intramu-ral expenditure on R&D performed on the national territory during a given period. GERD takes into account R&D performed within the country and funded from abroad but it excludes payments made abroad for R&D. GERD is usually stated in terms of purchasing power parity (PPP). However despite the measurement in PPP, the absolute value of the GERD is based on the size of the country. Thus, to eliminate the size effect GERD per GDP is a good candidate.
Empirical evidence shows that GDP and GERD are positively correlated in years. Growth of R&D expenditure pursues the business cycle, and growth of GERD shows larger fluctuations than growth of GDP and a time lag of one to two years. Funds devoted by private sector have the largest fluc-tuations indicating the big impact of business cycle. On the other hand, publicly financed R&D tends to be more countercyclical and displays fluc-tuations smaller in magnitude than private sector. As a result, during the economic crisis a large drop is observed in private funds. According to the
EU Industrial R&D Investment Scoreboard (Scoreboard) 2009 crisis has a different impact on the companies than 2001 crisis. After 2009 crisis, there was a worldwide tremendous decrease in sales and profits about 10.1% and 21% respectively. However in nominal terms R&D investment decreased by 1.9%. According to the deduction of Innovation Union Competitiveness Re-port (IUCR) (2011) this indicates the strategic significance that large spend-ing companies in R&D continued to devote their funds to R&D, which they regard as a priority. Thus some companies continued to increase R&D invest-ment even during the crisis for the purpose of competitiveness in preparation for the recovery.
Besides the research activities, there is no doubt that educational in-vestments are seemed as an engine of economic growth by many countries, especially by developed ones. Data on education expenditures shows that de-votion of funds to education have been increasing in years. Predominantly, allotted expenditures to education have a remarkable percentage share in both public expenditures and GDP in many developed and developing coun-tries.
3.1 R&D Expenditures in US and EU
It is apparent from the fig.2 that EU’s expenditure on R&D neither ex-ceeds nor catches up the US expenditures. In 2002 and 2004 there is a slight decrease in the difference but after 2004 the gap started to rise and in 2008 it attained its maximum level. Between 2001 and 2005 one can observe a fall
for both EU and US. This might be caused by cuts in the R&D expenditures due to the recovery after the 2001 crisis. EU has an average of R&D expen-ditures 1.8% of GDP between 1995 and 2008. In both 2009 and 2010 this average increased approximately to 2%. However this rise is not attributable to the increase in GERD but it is due to the rapid fall in GDP caused by 2008-2009 financial crisis.
Through 2000 to 2005, EU’s R&D expenditure growth rate is -0.005 and between 2005 and 2009 growth rate is 0.081. Besides the recovery of 2001 financial crisis, Lisbon Strategy2 in 2005 for reaching the target of devoting
3% of GDP to R&D by 2010, influenced this increment. Since the EU could not have achieved the objective set in the 2002 Lisbon Strategy, in 2010 the target has been revised as devoting close to 3% of GDP to R&D by 2020. Also each of the Member States announced their own national 2020 objec-tive. As stated in IUCR (2011), if those objectives are reached, R&D share of EU in GDP will be between 2.7-2.8%.
For the whole time period indicated in fig.2 growth rate of GERD in EU is 0.1 and in US it is nearly 0.06. In 1995, EU has a world share of 24% in investing R&D and US has 38%. Also between 1995-2008 World’s real GERD virtually duplicated, meantime in EU it rose approximately 50% and in US increment was about 60%. However the increase in R&D expenses was
2The Lisbon Strategy, also known as the Lisbon Agenda or Lisbon Process is a devel-opment plan effectuated in 2000 by the European Council in Lisbon in March 2000 for the economy of the EU between 2000 and 2010. The objective is to make the EU the most competitive and dynamic knowledge-based economy in the world capable of sustainable economic growth.
worldwide that Asian economies and BRIS countries (Brazil, Russia, India, South Africa) have devoted more percentage share of GDP to R&D. As a result, in 2008, EU share of world has decreased to 24% and US share has decreased to 33%.
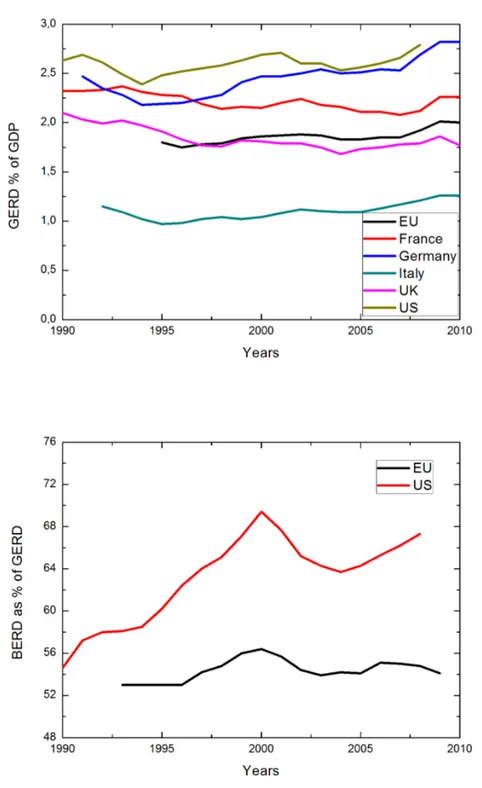
France, Germany, Italy and United Kingdom (UK) have a larger share of GDP devoted to R&D among the countries in EU. It can be shown in the fig.3 that in 2004, Germany has a slight difference from US. Germany is always above the EU level. In addition, expenditures in R&D in France exceeds the R&D intensity level of EU for years. On the other hand UK shows a similar trend with the EU level but there is a remarkable fall in 2010. Although Italy has a higher share than other countries in EU, it’s share is always under the average EU level.
For a detailed investigation, GERD can be broken into subparts: R&D conducted by business enterprise sector (BERD), higher education sector (HERD), research institutes owned by the government sector (GOVERD) and non-profit organizations (OTHER). Among the mentioned indicators BERD is the most important one to roughly identify the standing point in R&D activities. In other words, it clarifies whether a country’s expenses in R&D is more committed by industry or by public sector.
Table 2 shows that the largest performers of the R&D investments is business enterprises in both EU and US. The second largest performer of the R&D is higher education sector for both. However in US the difference
between HERD and GOVERD is not as high as in the EU. Although the EU industry has the largest share in GERD it is remarkably lower than the US level. As GERD can be splitted by the sectors of performance, it can be also decomposed by the sources of funds as shown in Table 3. Generally BERD is encompassed by the industry and funds given by government to R&D activities usually constitute a small part. In contrast, HERD is largely funded by government and industry has a lower share. Also GOVERD is al-most completely funded by the government sector. Table 3 indicates that EU has lower share of sources of funds in private sector. The difference between two countries in R&D investment is 70 billion Euro and the private sector is responsible for the amount of 61 billion Euro. The large and growing gap in R&D spending between them is attributable to the structural difference of US and EU in R&D sector. The reason for that is the low commitment of EU private sector in R&D activities compared to US where the manufactur-ing industry is bigger in magnitude and more research intensive. Although the funds devoted by public sector are larger in EU, this is not enough to compensate the difference in the private funds. Thus the gap between them is mostly ascribable to the relatively less devotion of industry to research activities in EU compared to US. Hence, private sector in EU should be en-couraged to invest further in R&D.
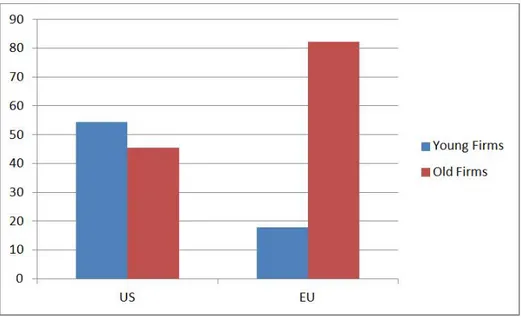
Since the effect of private sector is greater in magnitude, it is crucial to go behind the reasons that make the industries of two countries so different. According to Scoreboard in 2009, the R&D gap between US and EU can be explained by observing the sectoral composition of both countries. Also the
Scoreboard points out the impact of the young firms (created after 1975). Submission of the Scoreboard indicates that 17.8% of EU firms and 54.4% of US firms are young as indicated in fig.4. In other words, while more than half of the US companies are young, EU industry mostly composed of old firms. This difference plays a significant role because young firms of EU have a research intensitivity of 4.4%, on the other hand young companies of US has 11.8%. If the sectoral decomposition of both countries is taken into consideration, evidently the industrial structure of EU is the main source of the gap. According to the Global R&D Funding Forecast (2011), part of the problem lies in the high labor costs in EU. Recent study shows that more than 70% of R&D cost represents labor costs. In contrast, in US labor costs forms nearly 45% of R&D budget.
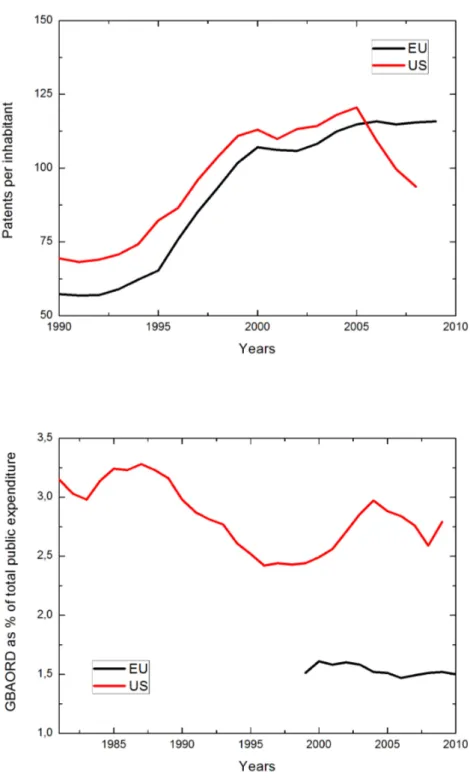
Patent applications are correlated with the investments of business en-terprise sector in R&D.3 Concerning the technological output produced by EU and US patents generated by the United States Patent and Trademark Office (USPTO) and applications to the European Patent Office (EPO) are indicated in fig.6 and fig.7. To reduce the size effects, data is indicated by per million inhabitants. In 2007, US constitutes 24% of papent applications in EPO and 47% of patents are invented in EU. US share in USPTO appli-cations has always been larger than EU for indicated years.
Public funds of R&D are under direct control of governments. Mostly,
3This is an approximation by IUCR (2011). Factors such as country’s degree of spe-cialization in technology areas which are intensive in patents may influence this.
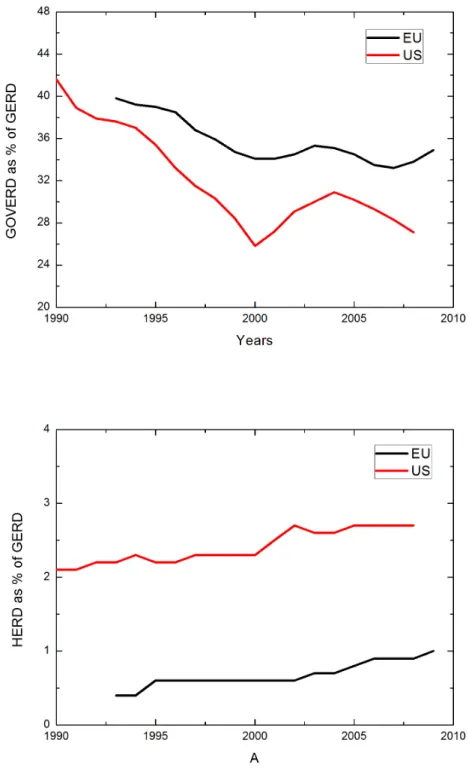
share of public sector is larger in R&D expenses in less research intensive countries.4 Also, from fig.5 percentage of GOVERD in GERD by source of funds is larger in EU for years. Contemporaneously, the European Commis-sion is an important contributor from abroad to the public funds in EU. The data is not presented in here but through the medium of Research Frame-work Programme and Structural Funds, the European Commission plays a significant role in the public fundings.
Besides GERD, government expenses in R&D are indicated by Gov-ernment Budget Appropriations or Outlays for Research and Development (GBAORD). From fig.1 their contribution channel can be identified. From GBAORD Eurostat report in 2005, GBAORD in the EU exceeded EUR 80 billion at current prices. The major contributors are Germany, France, the United Kingdom, Italy and Spain.5 Between the time indicated in
ta-ble 5 and tata-ble 6, R&D appropriations and educational appropriations in GBAORD increased in magnitude for both EU and US. However it is ev-ident that appropriations devoted to education is larger in EU and R&D appropriations are larger in US for all years. In table 7, funds dedicated to R&D in GBAORD indicated as % of GDP to eliminate the size effects. Since educational appropriations in GBAORD are small relative to GDP, table 8 represents educational funds in euro per inhabitant. GBAORD as a percent-age of total general government expenditures is decreased in US after 2004 as shown in fig.9. On the other hand EU is maintained at the same level
4Case of EU and US is a good example for this generalization.
5Besides the major contributors, as a percentage of GDP Finland was the only Member State that exceeded 1%.
around 1.5% after 2004.
Also it is important to note that R&D financed by government is com-prised by grants, loans and procurements which are given to the companies. Indirect government funding through R&D tax incentives such as R&D tax credits, R&D allowances, reduction in R&D workers’ wage taxes and social security is not recorded in the government financed R&D. Unfortunately data is not available to compare the direct and indirect government funding in EU and US.
3.2 Human Capital Expenditures in US and EU
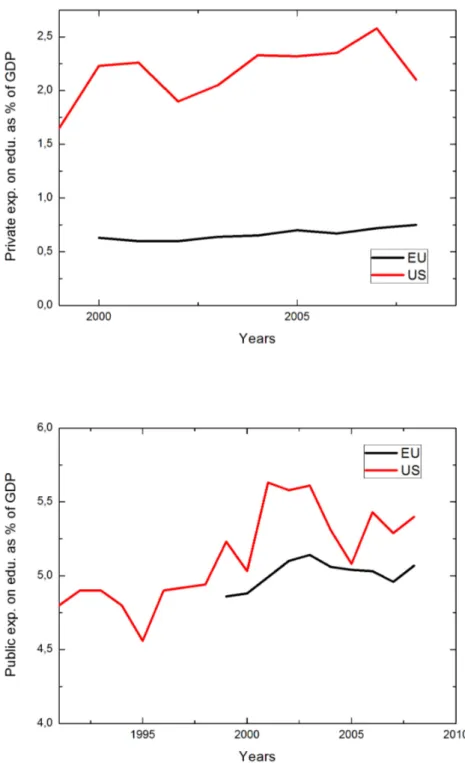
Public funds of education is under control of goverments like public funds of R&D. IUCR (2011) indicates that in 2007 EU governments invested ap-proximately eight times more in education than R&D. In 2007, government expenditure on education constitutes 5.06% of GDP in EU. On the other hand, R&D expenses of government forms 0.63% of GDP. In 2007, private funding in education receives a share of 0.7% of GDP averaged over EU countries.6 In US, this share is remarkably higher than the EU average by
2.6% of GDP. Public and private expenditures on education as a percentage of GDP are illustrated in fig.8. From fig.8, it can be seen that EU public expenditure on education is remarkably higher only in 2005 and 2008. How-ever as indicated in table 9, US public expenditure on education as a % of GDP is larger than EU for all years. In 2008 public expenditure of EU on
6UK and Cyrups are remarkable exceptions with share of private funding 1.7% and 1.3% of GDP
education was increased approximately by 31% with respect to 2001 level. Funds devoted to education perpetually have risen over years even during the time of economic crisis. This endorses the importance of education and shows the concern of EU where education is regarded as a top priority. Also, Lisbon Strategy in 2005 encourages EU to invest more in human capital.
In EU more than 895 000 students have a tertiary degree in Science and Engineering in 2008. EU generates a massive amount of source for R&D in terms of human capital. In magnitude, human capital produced for R&D is more than two times produced in US. Also in 2008, count of doctorates awarded is nearly 111 000. This number is again more than two times of doctorates awarded in US. In table 4 graduation from tertiary education is represented for the years between 2000 and 2009. The average growth rate for EU in the time interval indicated in table 4 is approximately 5% and for US it is nearly 3%. Although EU had negative growth rates in 2006 and 2009, EU commitment to tertiary education is always higher compared to US. However US has larger share of researchers in the business enterprise sector compared to EU as indicated in fig.6. It is not a suprising result because in the previous section we have already demonstrated the low R&D intensity in the industry structure of EU. According to the recordings of IUCR (2011), if the 3% target is reached in EU by 2020, together with the expected increase of GDP there will be a need of more than one million additional researchers by 2020, especially in the private sector.
EU are also jointly participating in some international research projects. Eu-ropean Center of Nuclear Research (CERN) is a good example illustrating the co-work of researchers. Also US government is a financial contributor to this research center. There are some state-of-the-art facilities constructed by CERN such as Large Hydran Collider (LHC) and the European Synchrotron Research Facility. US participation in LHC is supported by US Department of Energy’s Office of Science and the National Science Foundation. European and American researchers are also co-working in the Human Genome Project (HGP) coordinated by the U.S. Department of Energy and the National In-stitutes of Health. European Commission has educational initiatives such as ERASMUS and SOCRATES programmes. These programs mainly concerns research collaboration through educational exchanges. EU teachers stayed abroad (ERASMUS Programme) as a percentage of academic staff has an average of 1.7% between 2001 and 2006. Also, recently 33.4% of the world’s total scientific publications is produced by EU but the capacity of EU to produce high-impact scientific publications (a proxy for scientific quality) is lower than the US.
CHAPTER 4
METHODOLOGY
The broad tradition of the human capital and R&D driven endogenous growth literature will be followed. Diao, Roe and Yeldan (1999) and Voyvoda and Yeldan (2011) are my benchmarks where the growth is endogenized through technological innovations and human capital formation. The model that I studied on is an overview of Lucas (1998), Romer (1990), Grossman and Helpman (1991) and their extension by Funke and Strulink (2000) and Sequiera (2008). Besides the abstract investigations about patterns of steady state growth, Japanese data is calibrated and solved to obtain both tran-sitional dynamics and steady state equilibrium by Diao, Roe and Yeldan (1999). Recently, the model is solved for the Turkish economy by Voyvoda and Yeldan (2011).
4.1 Model
A small open economy is considered with three sectors: final goods, in-termediate goods and R&D production sector. Final good is produced with the following production function which exhibits constant returns to scale and diminishing marginal product of capital. Wages of unskilled labor and
skilled labor embodied in final goods sector are distributed according to the marginal product rule. The production function depends on unskilled labor, skilled labor and capital varieties instead of capital which is indirectly comes out through capital varieties.
Yt= AYLYt α HtYβ At X i=0 kt(i)γ (1) α + β + γ = 1 (2)
AY is a shift parameter in the production function and where {A} is the
index of varieties of capital inputs. LY
t and HtY denotes the labor and human
capital embodied in the final good sector. Each capital variety is produced by a monopolistic firm and in this sector all firms are identical in the sense that,
At
X
i=0
kt(i)γ = Atktγ (3)
We assume there is no depreciation for simplicity. Thus the economy’s re-source constraint becomes:
Yt= Ct+ At
X
i=0
kt(i)γ (4)
As in Romer (1990), A represents the index of building new investment op-portunities and it expands with the new research resulted in creation of new blueprints. Romer (1990) stated the accumulation of knowledge depends on the human capital and the existing stock of knowledge with constant returns. Jones (1995) argues that this formulation of knowledge accumulation is not consistent with the fact that knowledge does not accumulate directly
propor-tional to the stock of knowledge. It is easy to see that structural changes such as immigrations, increase in schooling, increase in women participation in la-bor force also expand A. Then, Jones (1995) introduces decreasing returns to both human capital embodied in R&D and stock of knowledge to dampen the scale effects by assigning elasticity to each component. In this study, I followed a track in which new blueprints are only determined by the aggre-gate knowledge embodied in R&D as in Funke and Strulink (2000), Sequiera (2008) and Voyvoda and Yeldan (2011). Thus new research is generated by the following equation:
At+1− At = ϕHtA (5)
where HA
t represents human resources devoted to R&D sector, namely
re-search personnel. By construction of equation 4, HA
t does not include the
decreasing returns and scale effects. ϕ represents the productivity of each researcher.
The other main source of growth is the human capital accumulation and is constructed as follows, Ht+1− Ht= ξHtH + χH ε tA 1−ε t (6)
where HtH is human capital devoted to education and ξ is the productivity of schooling. The last term of equation 6 represents the effect called ‘learning with varieties’ because it is a combination of stock of human capital and the ideas that are already in the economy. χ is the productivity of this term7 and
ε captures the intensity of human capital required to cover existing knowl-edge8.
Intermediate monopolistic firm buys the new knowledge created in R&D sector and manufactures the capital variety. To produce one unit of kt(i) firm
uses a ratio η of kt(i) where η is an input-output coefficient. Also defining r
as rental rate and PtAas the price of blueprint and pkt(i) as the price that final good producer buys capital variety, the intermediate firm profit maximization problem becomes:
max
kt(i)
πt(i) = pkt(i)kt(i) − ηrkt(i) − PtA∆At (7)
The first term in the maximization problem stands for the revenue of the firm, second term is the variable cost and the last term is fixed cost of producing kt(i). Households are endowed with human capital Ht at each time t and it
will be distributed across final good sector, production of new blueprints and further human capital without any waste. Households’ utility maximization yields consumption savings decision stated as follows:
max U0 = ∞ X t=0 βtc 1−θ t − 1 1 − θ (8) subject to ∞ X t=0 R(t)PtCct = T W0 (9) Ht+1− Ht= ξHtH + χH ε tA 1−ε t (10) 80<ε<1
where R(t) = ∞ Y s=0 (1 + rt)−1 (11) and PC
t is the price of consumption good and T W0 denotes the total wealth.
4.2 Social Accounting Matrix Framework
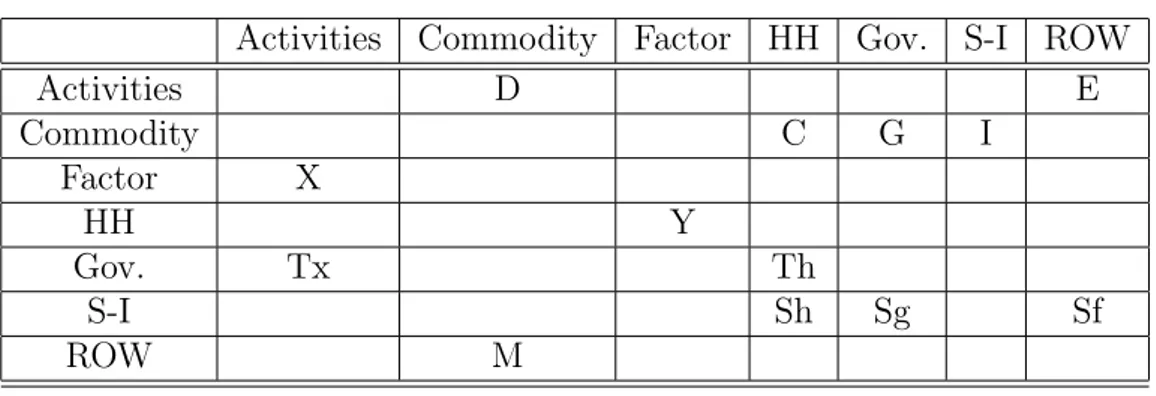
Social accounting matrix (SAM) is a snapshot of an economy referring to a specific year. SAM is a square matrix whose columns represent expendi-tures and rows represent receipts. Moreover, each row sum is equal to the corresponding column sum which ensures the accounting consistency. SAM provides an organized outline for the national accounts for an economy. Thus, it can be seen as a powerful tool representing the data and setting out the logic of economic models. Since SAM captures the economic flow macroe-conomic models which depend on these flows have to be internalized with SAM logic. SAM is a milestone of Computable General Equilibrium Models (CGE) where the well-stated incorporations of macro aggregates meet with the Walrasian General Equilibrium framework and input-output models de-veloped by Leontief. As Robinson (2003) stated, SAM extends the Leontief input-output accounts with replenishing the circular flow from factor pay-ments to household income and back to demand for products. Ultimately, Pyatt (1988), Thorbecke (1998) and Robinson (2003) have great contribu-tions on SAM framework.
Activities Commodity Factor HH Gov. S-I ROW Activities D E Commodity C G I Factor X HH Y Gov. Tx Th S-I Sh Sg Sf ROW M
Table 1: Example of a SAM
Table 1 Definitions: D: Production sold domestically, E: Exports, X: GDP at factor cost, Tx: Indirect taxes, Th: Direct taxes on households, M: Im-ports, Y: Factor payments to households, C: Consumption, G: Government consumption, I: Investment demand, Sh: Household savings, Sg: Govern-ment savings, Sf: Foreign savings, S-I: Saving-investGovern-ment account.
I constructed the SAM for US and EU economies in 2008. For our pur-poses we have extended the SAM for R&D sector by adding the corresponding rows and columns. SAM of US and EU can be seen in fig.13 and fig.14 re-spectively. Then, I calibrated the model for EU and US economies and I used the computer package GAMS for investigating policy analysis for those economies.
CHAPTER 5
POLICY ANALYSIS
In my analysis, R&D subsidy implemented on the input costs of pro-duction of R&D is ad valorem type. To compare the effects of results in short-run and long-run total subsidy amount is fixed to 0.5% of benchmark GDP each year. Subsidy amount is taken from government budget in a lump sum fashion. Thus, to finance subsidization costs government cuts some of its consumption expenditures. For initial value -period 1 or year 2008-, R&D expenditures are calculated as 1.95% of GDP for EU and 2.8% of GDP for US. The equilibrium interest rate is presumed as 5% for both countries. Share of differentiated capital in gross value added is 0.605, share of human capital in gross value added is 0.181 and share of labor in gross value added 0,214 and these values are again same for both countries.
In order to compare the results of the subsidization policy, I used base path values which are obtained without subsidy scheme over 60 periods. Fig.10-12 indicates transitional dynamics for some variables. Fig.10 indicates enhancement of GDP under R&D subsidy scheme. Rapid enhancement of GDP is dampened over the years but its level is always above the benchmark
GDP level. Also GDP of EU increased more than US as an expected result of the higher benchmark GDP indicating a larger economy. Fig.10 also il-lustrates consumption under R&D subsidy scheme and it is shown from this figure that consumption level increased over years. For US this increment is approximately 1.42% compared to base path and for EU countries it is 2.05%. From fig.11, it can be seen that price of R&D activities reduced nearly 0,97% for both countries and as time passes it ascends and at some point after subsidization policy it goes beyond the base path value. Ulti-mately, price of R&D remains higher in EU countries. As expected, total human capital within the economies descends over time in fig.11. It can be said that total human capital of EU countries affected less compared to US. This can be caused from EU’s generation of massive amount of source for R&D in terms of human capital as stated in Chapter 3. In fig.12, for the first 30 time period R&D subsidy tends to create more favorable results for US in terms of total R&D amount. However, in the long-run total R&D amount is higher in EU. Wage rate of human capital which is the final variable exam-ined under transitional dynamics is illustrated in fig.12. In the long-run wage rate of human capital is increased. Eventually in EU wage rate is higher both compared to benchmark value and US.
It is important to note that I observed some fluctuations over periods, especially for the variables indicating human capital. Such fluctuations are also observed by Sequeira (2008) and Voyvoda and Yeldan (2011). These fluctuations are the result of trade off impact of the most needed human capital in the economies.
CHAPTER 6
CONCLUSION
In this thesis, in the context of new growth theory I investigated pub-lic popub-licy whose objective is to enhance Total Factor Productivity (TFP) through investments in innovation for US and EU economies. Nowadays im-portance of R&D is well appreciated for many developed countries, especially in the -US and EU- biggest ones because it is well known that R&D has a key role in producing new innovations, competitiveness and economic perfor-mance. Such an important key concept inspired me to this study. Ultimately, Voyvoda and Yeldan (2011) analyses the Turkish economy to examine the in-teraction between accumulation of human capital, knowledge driven growth and the effect of public policy. On the grounds of this work, in my study, I investigated the effects of R&D policy in US and EU.
In chapter 2, a broad literature review is presented. Starting from dis-cussion of Solow (1956), growth literature is extended with Uzawa (1965) and Lucas (1988) where diminishing returns to capital accumulation is elim-inated. Expansion of the growth theory continued with the introduction of technology as an economic good by Romer (1990). Most recent studies with
R&D driven growth along with the human capital formation through school-ing found that R&D subsidies have a positive effect on growth, social wealth and welfare.
In chapter 3, data of R&D expenditures and human capital expenditures for last two decades is presented. In this part, reasons of R&D expenditure gap between US and EU is elaborately investigated. The reason for that gap is the low commitment of EU private sector in R&D activities compared to US where the manufacturing industry is bigger in magnitude and more research intensive.
In chapter 4, I present my benchmark model which is Voyvoda and Yel-dan (2011) model and I give brief information about SAM framework.
In Chapter 5, I analyzed the role of public policy. I found that R&D subsidization policy enhances GDP, consumption and total amount of R&D activities. On the other hand, it dampens total human capital within both countries and increases wage rate of human capital.
To sum up, announcement of R&D subsidy policy has obviously long-run effects on economies. Sequeira (2008) and Voyvoda and Yeldan (2011) found that R&D subsidy policy directs the primary resources toward the R&D sector by offering a subsidized return and policy leads better results in terms of growth and welfare for the economy. What I have found for US and EU is consistent with this finding and I found that R&D subsidization
policy enhances economic growth, social wealth and welfare in both coun-tries. Moreover subsidization policy creates more favorable results in EU. As a future work, different kinds of subsidy schemes such as education sub-sidy may be investigated. Also migration effects of human capital can be considered via a migration function between US and EU. As a final remark, revealed subsidization policy results are very sensitive to the functional forms and algebraic structure of the model. Thus, my results are not immediate conclusions of real economies. Simulation results that were obtained from this study ought to be seen as rough estimations of a public policy analysis.
BIBLIOGRAPHY
Aghion, P. and P. Howitt. 1992. “A Model of Growth through Creative Destruction,” Econometrica, 60(2): 323-351.
Barro, R.J., 1991. “Economic growth in a cross section of countries,” Quarterly Journal of Economics, 106 (2), 407-443.
Barro, R.J., Sala-i Martin, X., 1995. “Economic growth,” McGraw-Hill, Singapore.
COM(2003). Investing in Research: An Action Plan for Europe, Com-munication from the Commission of the European Communities 226, June 4, 2003.
Diao, X., Roe, T., Yeldan E., 1999. Strategic policies and growth: An applied model of R&D-Driven endogenous growth,” Journal of Development Economics, 60, 343-380.
European Commission 2011. Innovation Union Competitiveness report 2011. Availabe at: http://ec.europa.eu/research/innovation-union/pdf/comp etitiveness-report/2011/part 1.pdf
EU Industrial R&D Investment Scoreboard 2009. Available at: http://iri.jrc.es/research/scoreboard 2009.htm
Funke, M. Strulik, H., 2000. “On endogenous growth with physical cap-ital, Human capital and product variety,” European Economic Review, 44, 491-515.
Global R&D Funding Forecast 2011. Available at:
http://www.rdmag.com/uploadedFiles/RD/Featured Articles/2010/12/ GFF2010 FINAL REV small.pdf
Grossman, G.M., Helpman, E., 1991. “Innovation and growth in the global economy,” The MIT Press, Cambridge.
Jones, Charles I. “R&D-Based Models of Economic Growth.” J.P.E . 103 August 1995: 759-84.
Jones, C. and J. Williams 2000. “Too Much of a Good Thing? The Eco-nomics of Investment in R&D?,” Journal of Economic Growth, 5:65-85.
King, R. G., Rebelo, S. T., 1993. “Transitional dynamics and economic growth in the neoclassical model,” American Economic Review, 83(4), 908-31.
Lucas, Robert E. 1988. “On the Mechanics of Economic Development,” Journal of Monetary Economics, 22, 3-42.
Pyatt, Graham 1988. “A SAM Approach to Modeling,” Journal of Policy Modeling, Vol. 10, pp. 327-352.
Romer, P.M., 1990. “Endogenous Technological Change,” Journal of Po-litical Economy, 98(5), S71-S102.
Nelson R.R, Phelps E.S. “Investment in Humans, Technological Diss-cusion, and Economic Growth,” The American Economic Review 1966;56;
69-75.
Robinson, Sherman 2003. “Macro models and multipliers: Leontief, Stone, Keynes and CGE models,” Paper presented at Conference at ‘Poverty, Inequality and Development’ in honor of Eric Thorbecke, Ithaca: Cornell University. (October)
Sequeira, T.N., 2008. “On the effects of human capital and R&D policies in an endogenous growth model,” Economic Modeling, 25, 968-982.
Solow, R.M., 1956. “A contribution to the theory of economic growth,” Quarterly Journal of Economics 70, 65-94.
Thorbecke, Erik 1998. “Social Accounting Matrices and Social Account-ing Analysis,” In W. Isard, et al. (eds.), Methods of Interregional and Re-gional Analysis. USA: Ashgate, Aldershot, Brookfield.
Voyvoda, and Yeldan, 2011. “An applied Endogenous Growth Model with Human an Knowledge Capital Accumulation for the Turkish Economy,” Paper presented at the ERF meetings, Cairo, 2012.
APPENDIX
[htbp] Figure 1: R&D Funding and Performance System (Table is taken from
Figure 3: GERD as a percentage of GDP and % of BERD in GERD by source of funds
Figure 5: % of GOVERD in GERD by source of funds and % of HERD in GERD by source of funds
Figure 6: Total researchers (FTE) in business enterprise sector and Patents granted by the United States Patent and Trademark Office (USPTO)
Figure 7: Patents applications to the European Patent Office (EPO) and Total GBAORD as a % of total general government expenditure
Figure 8: Private expenditure on education as % of GDP and Public expen-diture on education as % of GDP
Figure 12: Total R&D and wage rate of human capital under R&D subsidy scheme
EU US Y ears BERD HERD GO VERD OTHER BERD HERD GO VERD OTHER 1999 64% 20% 14% 0.5% 74% 11% 11% 3% 2000 65% 20% 13% 0.5% 74% 11% 10% 3% 2001 64% 21% 13% 0.5% 72% 12% 11% 4% 2002 63% 22% 12% 1% 70% 13% 12% 4% 2003 63% 22% 13% 1% 69% 13% 12% 4% 2004 63% 22% 13% 1% 69% 14% 12% 3% 2005 62% 22% 13% 1% 69% 14% 12% 3% 2006 63% 22% 12% 1% 71% 13% 11% 3% 2007 63% 22% 12% 1% 72% 13% 10% 3% 2008 63% 23% 12% 1% 72% 12% 10% 3% T able 2: Splitting GERD b y the sectors of p erforman ce Data source: Eurostat
% of GERD In absolute PPP be 2003 EU US EU US GERD (total) 100% 100% 202be 271be Private 55% 63% 110be 171be Public 35% 31% 70be 85be Other 11% 6% 22be 15be
Graduation from tertiary education Growth rate Years EU US EU US 2000 2,848.912 2,150.954 — — 2001 3,075.560 2,174.142 0.08 0.01 2002 3,208.865 2,238.327 0.04 0.02 2003 3,466.797 2,352.271 0.08 0.05 2004 3,595.504 2,473.299 0.03 0.05 2005 3,860.042 2,557.595 0.07 0.03 2006 3,846.498 2,639.006 -0.03 0.03 2007 3,955.204 2,704.070 0.02 0.02 2008 4,368.285 2,782.270 0.1 0.02 2009 4,305.148 2,881.557 -0.01 0.03
Table 4: Annual data graduation on from tertiary education according to ISCED97 Data source: Eurostat
GBAORD - R&D Appropriations Years EU US 2004 72,483.751 106,350.964 2005 75,490.621 109,803.413 2006 77,632.048 110,818.804 2007 82,358.787 115,142.66 2008 86,393.632 112,655.692 2009 87,849.862 124,550.968 2010 90,000.152 —
GBAORD - Education Years EU US 2007 759.609 364.359 2008 1,162.556 333.932 2009 1,170.754 355.609 2010 1,234.863 —
R&D Appropriations Data source: Eurostat Years EU US 2004 0.71 1.07 2005 0.71 1.04 2006 0.68 1.02 2007 0.68 1.01 2008 0.71 1.01 2009 0.77 1.19 2010 0.76 —
Table 7: GBAORD - R&D Appropriations as % of GDP Data source: Euro-stat
Education Years EU US 2007 1.5 1.1 2008 2.3 1.1 2009 2.3 1.1 2010 2.5 —
Public Expenditure on Education Years EU US 1999 4.86 5.23 2000 4.88 5.03 2001 4.99 5.63 2002 5.10 5.58 2003 5.14 5.61 2004 5.06 5.31 2005 5.04 5.08 2006 5.03 5.43 2007 4.96 5.29 2008 5.07 5.4
Table 9: Public expenditure on education as a % of GDP Data source: Eu-rostat