'• « ί ϊ Г - Г ' С -.г· Уі
; ·\ А і· - " ✓ · . ■ ■
A CROSS SECTIONAL ANALYSIS OF HUMAN RESOURCE MANAGEMENT EFFORTS IN TURKEY IN PRODUCTION SECTOR
A THESIS
SUBMITTED TO THE DEPARTMENT OF MANAGEMENT
AND
GRADUATE SCHOOL OF BUSINESS ADMINISTRATION
OF BILKENT UNIVERSITY
IN PARTIAL FULFILLMENT OF THE REQUIREMENTS
FOR THE DEGREE OF
MASTER OF BUSINESS ADMINISTRATION
BY
giGDEM igiKDEMIR
5S40.1
■ T ?I?5
I certify that I have read this thesis and in my opinion it is fully adequate, in
scope and quality, as a thesis for the degree of Master of Business
Administration.
I certify that I have read this thesis and in my opinion it is fully adequate, in
scope and quality, as a thesis for the degree of Master of Business
Administration.
I certify that I have read this thesis and in my opinion it is fully adequate, in
scope and quality, as a thesis for the degree of Master of Business
Administration.
Dr. Zeynep Önder
Approved for the Graduate School of Business Administration.
\
ABSTRACT
A CROSS SECTIONAL ANALYSIS OF HUMAN RESOURCE MANAGEMENT EFFORTS IN TURKEY IN
PRODUCTION SECTOR BY
ÇİĞDEM IŞIKDEMIR M.B.A THESIS
Supervisor: Dr. Fred Wooley September 1996
In the 1990s, globalization, internationalization and competition has gained an
increasing significance in terms of corporate strategy. The organizational
enviroment is involved in a rapid, constant change. Human resource
management (HRM), is the critical tool for adapting to this ever changing
environment. It could become a perfect strategic point of view when it is
utilized efficiently.
At the macro level this study analyses the extent of HRM efforts in Turkey in
the production sector by replicating the 1992 Price Waterhouse international
survey of HRM practices and strategies in Europe.
At the micro level significant differences among the large and medium-small
scale organizations in their attempts to manage human resources in their
organizations in 1996 are investigated.
The study seeks to ascertain any changes in HRM practices in Turkey during
evaluate any significant changes within four years ( 1992-1996). Finally, the
results of this survey of HR practices in Turkey are compared with the
ÖZET
TÜRKİYE’DE ÜRETİM SEKTÖRÜNDE İNSAN KAYNAKLARI YÖNETİMİ ÇABALARINDA KESİT ANALİZİ
ÇİĞDEM IŞIKDEMİR
YÜKSEK LİSANS TEZİ, İŞLETME FAKÜLTESİ TEZ YÖNETİCİSİ: DR. FRED WOOLEY
Şirket stratejilerinde 1990 lı yıllarla birlikte küreselleşme, evrenselleşme ve
artan rekabet önemli unsurlar olarak gündeme gelmeye başlamıştır.
Dünyada ki hızlı gelişmeler iş çevrelerini de hızlı ve sürekli bir değişim içine girmeye zorlamıştır.
Sürekli değişen bu ortamda insan kaynakları yönetimi adaptasyon için en
önemli araçtır ve etkili kullanıldığında çok önemli stratejik yararlılıklar sağlar.
Bu çalışmada makro düzeyde 1992 yılında Price Waterhouse tarafından
Avrupa bazında, insan kaynakları yönetimi, uygulama ve stratejilerini
belirlemek amacıyla yapılan tarama tekrarlanmak suretiyle Türkiye’deki
üretim sektöründe insan kaynakları yönetiminin durumunu değerlendirmek
amaçlanmıştır.
Micro düzeyde de büyük ve küçük ölçekli organizasyonların insan kaynakları
Ayrıca Price Waterhouse’un insan kaynakları yönetimini analiz ettiği Avrupa
çalışmasının sonuçları ile çalışmamızda elde edilen sonuçlar arasında ki
benzerlikler ve farklılıklar tartışılmıştır. 1992 yıllında Price Waterhouse un elde
ettiği sonuçlar ile bizim elde ettiğimiz sonuçlar karşılaştırılarak bu sektörde
geçen dört yıl süresinde (1992-1996) meydana gelen değişimlerin neler
I gratefully acknowledge patient supervision and helpful comments of Dr.
Fred Wooley, throughout the preparation of this study. I would also like to
express my thanks to the other members of the examining commitee, to Dr.
Yeşim Çilesiz and to Dr. Zeynep Önder for their contribution and suggestions.
I also thank to all participants of the questionnaire for their valuable help and
interest.
ACKNOWLEGMENTS
Finally, I appreciate the continous support of my mother and husband during
the preparation of this research project and also throughout the whole MBA
TABLE OF CONTENTS
Subject
Page
ABSTRACT... i ÖZET... iii ACKNOWLEGMENTS...v TABLE OF CONTENTS... vi LIST OF APPENDICES... xiLIST OF TABLES... xii
LIST OF FIGURES... xvii
OINTRODUCTION... 1
II) RESEARCH QUESTION...8
III) DESCRIPTION OF THE QUESTIONNAIRE... 10
SECTION I ) Human resource /Personnel Structure...10
SECTION I I ) Human resource strategy... 10
SECTION III) Recruitment...11
SECTION IV ) Pay and benefits...11
SECTION V) Training and Development... 12
SECTION VI )Employee Relations... 13
IV) ANALYSIS...15
PART I) Description of the analysis...15
PART II) An analysis of data for each section of the questionnaire... 18
TABLE OF CONTENTS
Subject
Page
1.1) The percentage of organizations having a personnel
or human resource department/manager... 18 1.2) Length of time personnel specialists have worked in
that role... 20 1.3) The percentage of organizations in which the head of
personnel/HR function has a place on the main board of
directors... 21 1.4) Percentage of organizations with someone other than personnel/HR manager on the main board of
directors... 22 1.5) Source of recruitment of senior personnel/ HR
manager... 24
SECTION II) Human Resource Strategy... 26
2.1) The main objectives of personnel or HRM
department over the next three years... 26 2.2) Personnel/ HR department involvement in corporate strategy... 29 2.3) Percentage of Organizations where the performance of the personnel department is systematically
evaluated... 31 2.4) Criteria used to evaluate performance of the
personnel department... 33 2.5) The percentage of organizations who carry out
manpower... 35 2.6) Percentage of organizations using manpower planning methods... 36
TABLE OF CONTENTS
Subject
Page
SECTION III) Recruitment... 38 3.1) Job categories hardest to recruit... 38 3.2) The approximate proportion of senior managers
recruited externaly...
SECTION IV) PAY AND BENEFITS 43
4.1) The level at which basic pay is determined for
managers... 42
SECTION V) TRAINING AND DEVELOPMENT 45
5.1) The percentage of Organizations who systematically
analyse employee training needs... 45 5.2) The percentage of organizations where at least one third
of the managers have been trained in the areas such as performance appraisal, staff communication, delegation,
motivation, team building and foreign languages... 46 5.3) The areas which organizations think will constitute the main training requirements in the next three years... 48 SECTION VI) Employee relations... 52
6.1) Percentage of organizations with the following proportion
of staff who are members of a trade union... 52
6.2) Percentage of organizations reporting a change in the use of direct verbal methods to communicate major issues to employees...
TABLE OF CONTENTS
Subject
Page
V) CONCLUSION... 57 5.1) Organization... 57 5.2) Corporate Strategy... 57 5.3) Performance Evaluation... 59 5.4) HRM Recruitment... 595.5) Self Directed Teams... 60
5.6) Enhancement of HRM Practices... 60
5.7) Increasing responsibilities for line managers... 61
5.8) Systematic Evaluation of HR Personnel... 61
5.9) Man power planning... 61
5.10) Disabilities... 62
5.11) Computerised Information Systems... 62
5.12) Pay and benefits... 62
5.13) Training and development... 62
5.14) Trade Unions... 63
5.15) Communication... 63
TABLE OF CONTENTS
Subject
Page
V) RECOMMENDATIONS... 68 6.1) Organization... 68 6.2) Corporate Strategy... 68 6.3) Change Management... 69 REFERENCES... 70 APPENDICES... 152LIST OF APPENDICES
Name Page
APPENDIX A Price Waterhouse Cranfield Questionnaire... 73
LIST OF TABLES Name Page TABLE 1.1 TABLE MS 1.1 TABLE PW1.1 TABLE 1.2 TABLE MS 1.2 TABLE PW 1.2 TABLE 1.3 TABLE MS 1.3 TABLE PW 1.3 TABLE 1.4
Percentage of organizations having a
personnel or human resource
department/manager... 18
Less than 1000 or greater than or equal to
1000 employees... 19
Europeanwide results of Price Waterhouse 19
Length of time personnel specialist have
worked in that ro le ... 20
Less than 1000 or greater than or equal to
1000 employees... 20
Europeanwide results of Price Waterhouse 20
The percentage of organizations in which
head of the personnel/HR has a function on
main board of directors... 21
Less than 1000 or greater than or equal to
1000 employees... 21
Europeanwide results of Price Waterhouse 22
Percentage of organizations with someone
other than the personnel/HR manager on
the board with responsibility for personnel
TABLE MS 1.4 - Less than 1000 or greater than or equal to
1000 employees... 23
TABLE PW 1.4 - Europeanwide results of Price Waterhouse 23
TABLETS - Source of recruitment of senior
personnel/human resource manager... 24
TABLE MS 1.5 - Less than 1000 or greater than or equal to
1000 employees... 24
TABLE 1.5 PW - Europeanwide results of Price Waterhouse 25
TABLE 2.1 - The main objectives of human resource
management department over the next
three years... 26
TABLE MS 2.1 - Less than 1000 or greater than or equal to
1000 employees... 27
TABLE PW 2 . 1 - Europeanwide results of Price Waterhouse 28
TABLE 2.2 - Personnel/HR department involvement in
corporate strategy... 30
TABLE MS 2.2 - Less than 1000 or greater than or equal to
1000 employees... 30
TABLE PW 2.2 - Europeanwide results of Price Waterhouse 30
LIST OF TABLES
LIST OF TABLES Name Page TABLE 2.3 TABLE MS 2.3 -TABLE PW 2.3 - TABLE 2.4 TABLE MS 2.4 -TABLE PW 2.4 - TABLE 2.5 TABLE MS 2.5 -TABLE PW 2.5 - TABLE 2.6 TABLE MS 2.6 -TABLE PW 2.6 - TABLE 3.1
Percentage of organizations where the
performance of the personnel department
is systematically evaluated... 31
Less than 1000 or greater than or equal to
1000 employees... 32
Europeanwide results of Price Waterhouse 32
Criteria used to evaluate performance of
the personnel department... 33
Less than 1000 or greater than or equal to
1000 employees... 34
Europeanwide results of Price Waterhouse 35
The percentage of organizations who carry
out manpower planning... 35
Less than 1000 or greater than or equal to
1000 employees... 36
Europeanwide results of Price Waterhouse 36
Percentage of organizations using
manpower planning... 36
Less than 1000 or greater than or equal to
1000 employees... 37
Europeanwide results of Price Waterhouse 37
LIST OF TABLES Name Page TABLE MS 3.1 TABLE PW 3.1 TABLE 3.2 TABLE MS 3.2 TABLE PW 3.2 TABLE 4.1 TABLE MS 4.1 TABLE PW 4.1 TABLE 5.1 TABLE MS 5.1 TABLE PW5.1 TABLE 5.2
Less than 1000 or greater than or equal to
1000 employees... 39
Europeanwide results of Price Waterhouse 40
The approximate proportion of senior
managers recruited externally... 41
Less than 1000 or greater than or equal to
1000 employees... 41
Europeanwide results of Price Waterhouse 42
The level at which basic pay is determined
for managers... 43
Less than 1000 or greater than or equal to
1000 employees... 43
Europeanwide results of Price Waterhouse 44
The percentage of organizations who
systematically analyse employee training
needs ... 45
Less than 1000 or greater than or equal to
1000 employees... 45
Europeanwide results of Price Waterhouse 45
Percentage of managers where at least a
third of managers have been trained in the
LIST OF TABLES Name Page TABLE MS 5.2 TABLE PW 5.2 TABLE 5.3 TABLE MS 5.3 TABLE PW 5.3 TABLE 6.1 TABLE MS 6.1 TABLE PW 6.1 TABLE 6.2 TABLE MS 6.2 TABLE PW 6.2
Less than 1000 or greater than or equal to
1000 employees... 46
Europeanwide results of Price Waterhouse 47
The areas which organizations think will
constitute the main training requirements in
the next three years 48
Less than 1000 or greater than or equal to
1000 employees... 48
Europeanwide results of Price Waterhouse 50
Percentage of organizations with the
following proportion of staff who are
members of a trade union... 52
Less than 1000 or greater than or equal to
1000 employees... 52
Europeanwide results of Price Waterhouse 53
The percentage of organizations reporting
a change in the use of direct verbal
methods to communicate major issues to
employees... 53
Less than 1000 or greater than or equal to
1000 employees... 53
LIST OF FIGURES
Name Page
FIGURE 1.1 A Model for Investigating Human Resource Strategies: the
I) INTRODUCTION:
Human resource management, as a tool for competitive advantage of a firm,
has gained increased importance in the 1990s. Since qualified people are
the real assets of an organization, efficient and correct utilization and
application of HRM is critical. This study attempts to understand and measure
the extent to which HRM is being utilized effectively in Turkey. The study
basically focuses on HRM in Turkish production companies and discusses its
application within these firms.
The economic context in which organizations operate has been changing at
a remarkable rate during the last decades. Increasing international
competition, deregulation and globalization of markets have demanded
greater flexibility and productivity of organizations , as well as new strategies
focused on speed, responsiveness to changing market conditions, and
innovation (Hiltrop,1995). Therefore, faced with pressures for greater
productivity, shifting demographics, and changing workforce expectations,
many companies have come to realize that the treatment of people as a key
organizational asset for competitiveness is the critical strategic tool. HRM is
continuously gaining power in terms of the competitive strength of a
corporation.
Interest in competence has been increasing from a strategic and economic
point of view and that various human capital approaches are developing and
being utilised in the HRM field, as well as being integrated, into general
Increasingly people are being utilized where they have the required skills and
they can expect to move from place to place in their organization as needs
change.
To maintain their personal income and employability, individuals have to plan
their own development, build a professional reputation, and learn to manage
their own careers ( Handy, 1989).
Since organizations can no longer offer promotion as reward for loyalty and
performance, the rewards for managers and professionals can not be
managed the way they used to be. Pay systems must be altered so that
people are no longer paid on the basis of their level, position or status, but
instead on their contribution to the firm( Moss Kanter,1994).
Promotion is the currency of the old era. What matters now is job enrichment,
employability and providing the opportunity for employees to develop the
skills and perspectives to take care of themselves ( Noer,1993).
Transactional contracts will become the norm of the industry. For example,
many of the traditional career orientated employers, IBM, Hewlett Packard,
and Ciba Geigy among others, are making continued employment explicitly
contingent on the fit between people’s competencies and business needs
(Mirvis and Hall, 1994). This puts increasing emphasis on the organization’s
Many authorities are spot lighting the growing integration of HRM with
organizational strategies and objectives as evidence for the growing
recognition of the importance of HRM. Integration means the degree to which
the HRM issues are considered to be an integral part of the development of
business strategies and objectives.
Hendry and Pettigrew(1990) define the strategic integration of HRM as:
- the use of HR planning:
- a coherent approach to the design and management of personnel systems
based on an employment policy and manpower strategy:
- seeing the people of the organization as a “strategic resource” for achieving
competitive advantage.
There is also the argument that there is a direct correlation between strategic
HRM and economic success. Schuler and Macmillan( 1984:242) make a
similar point, that effectively managing human resources gives benefits which
include greater profitability. Porter(1985) also believes that HRM can help a
firm obtain a competitive advantage.
Other authors argue that organizations which engage in strategy formulation
processes that systematically and reciprocally consider human resources
and competitive strategy will perform better over the long run.
It is clear that studying HRM efforts comparatively at the organizational level
purpose, but unfortunately most of the time national labour market data is
insufficient. Price Waterhouse, in concert with the Cranfield school of
Management, decided to fill this data void by mounting an empirical,
international study of HRM practices in Europe.
PW initially contacted the researchers at the Cranfield School of
Management, where Gavin Adam of Price Waterhouse and Chris Brewster of
Cranfield established the Price Waterhouse Cranfield Project on International
Strategic Human Resource Management. The recruitment of Cranfield MBAs
to Price Waterhouse via six month assignments on the HRM project and the
shared information gathered and public exposure received were critical to the
outcomes of the research.
PW also held the strong belief that, despite the clear national or regional
distinctions, there has been an identifiable difference between the way in
which HRM is conducted in Europe and the situation in the United States.
One of their purposes was also to question the appropriateness of the
American concept of HRM in the European context.
There has been a need for a model of HRM to re-emphasize the influence of
such factors as culture, ownership structures, the role of the state and union
organizations. Some European HR specialists claim that the American
models are inapplicable in Europe. Gaugler concludes that because of
different legal, institutional and economic contexts there is no uniform model
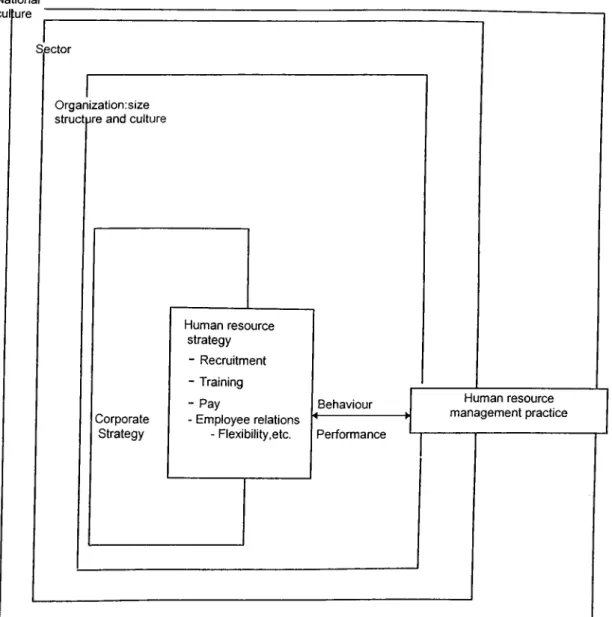
To fill this void, PW-Cranfield proposed a model of HRM (shown in Fig 1.1)
which places HR strategies firmly within, though not entirely absorbed by, the
business strategy.
National culture
Sector
Organization . size structure and culture
Corporate Strategy Human resource strategy - Recruitment - Training - Pay - Employee relations - Flexibility,etc. Behaviour Performance Human resource management practice
Figure 1.1 Amodel for investigating human resource strategies: the European environment Source.Adapted from Brewster and Bournois 1991
The model shows that the business strategy, HR strategy and HR practice are
legislation, education and employee representation. The organization and its
human resource strategies and practices in turn interact with and are part of
that environment.
Such a presentation of the HRM concept points towards a model which
places HRM management within the national context which allows us to
understand why the European situation may differ from the American
situation.
The PW research data was collected by an international comparative survey
of organizational policies and practices in human resource management in
Europe. The survey included Germany (West), Spain, France, Sweden, and
the UK in 1989-90. Germany(West), Spain, France, Sweden, the UK,
Denmark, Netherlands, Norway, Switzerland and Italy in 1990-1.
Germany(West), Spain, France, Sweden, UK, Denmark, Netherlands,
Norway, Finland, Ireland, Portugal, Germany(East) and Turkey in 1991-92.
Finally Austria, the Czech Rep, Greece, and further Germany(East) were
surveyed in 1993. It was an unprecidented, extensive and comprehensive
research.
jh e research had two main objectives: first to monitor over time the impact of
the increasing ‘Europeanisation’ of business on specific human resource
management practices in Europe. The researchers were actually interested in
knowing whether Europeanisation would lead to a harmonisation of
The second objective was to establish how far there had been a shift in
personnel policies towards ‘strategic human resource management’. The
survey was designed in such a way as to establish how far personnel
policies were planned, coherent and interactive with corporate strategies. The
researchers also wanted to identify any developments that were taking
place in critical HRM areas such as recruitment, training, remuneration, and
employee relations.
PW and the Cranfield School of management developed a very high quality
questionnaire for their survey. The entire questionnaire is presented in
appendix A. It was decided to replicate the study in Turkey to discover if there
had been any major shifts in HRM applications in the four years since the PW
Study.
For the purpose of this research a sample of 17 Turkish private production
companies, both large and medium-small scale organizations, were surveyed
concerning their HRM activities with the use of the PW questionnaire. The
PW questionnaire was originally applied to both public and private firms in
15 European countries including Turkey. This study concentrates on the
private sector because of the greater amount of HRM activity there. The
questionnaire was completed by the HR Coordinators, HR Vice
This study attempts to explore and describe the HRM orientation of 17
Turkish companies. These companies are divided into two groups: large and
medium-small scale production companies and their subsidiaries. Significant
qualitative data were collected through interviews, and the PW questionnaire
was utilized to collect quantitative data.
The interviews allowed the researcher to ask more qualitative questions to
the managers. In this way the current situation of HRM in the companies was
understood and examined by recording the thoughts, insights and beliefs of
the HR managers. The data collected by the questionnaire helps to increase
the validity and the reliability of the qualitative findings.
Price Waterhouse surveyed 123 organizations in Turkey. These consisted of
both public and private firms. The sample firms included in this study are all
production companies.This will help to explain why the resulting data may be
at variance. However in most categories, the data are remarkably similar.
The Price Waterhouse Survey was conducted in 1992 for Turkey. The
current study strives to identify and analyze any changes that have occured
in HRM practices during the intervening four years.
The PW questionnaire utilized for the purpose of this research consists of six
sections, each of which concentrated on a major issue in HRM. The
questionnaire collects as much hard data as possible on organizational level
HRM practices from the most senior personnel specialists across the
production sector of the economy in Turkey.
The data are evaluated statistically in order to identify and explain the
similarities and differences among the sample firms in terms of HRM
practices, to differentiate between the HRM efforts of large and medium-
small scale organizations in the sample, and to compare results of this
research with the results of the Price Waterhouse Survey.
In addition, the PW Survey data are analyzed in terms of how Turkey
SECTION I) HUMAN RESOURCES /PERSONNEL STRUCTURE:
The purpose of this section is to understand the structure of the HR
department in the organization. It also investigates the position, title,
educational background, and recruitment procedure for the personnel that
participate in the HRM team.
The participation of the head of the personnel or HR function on the main
board of directors or equivalent is also analyzed. If he/she does not
participate then the person who represents HR for related decisions is
investigated.
SECTION II) HUMAN RESOURCE STRATEGY:
This section attempts to identify the degree of integration between HRM and
corporate strategy.
If an HR strategy exists then the extent of its influence on major policy
decisions such as pay and benefits, recruitment and selection, training and
development, industrial relations, health and safety, workforce
expansion/reduction is further investigated and analyzed.
A second group of questions in this section deals with the performance
evaluation of the personnel department. Whether it is evaluated
systernatically or not and the criteria for such an evaluation are the major concerns for these questions.
A third group of questions in this section focuses on manpower planning. The
methods used in manpower planning, types of data collected on the
workforce are evaluated. Time period for planning staffing requirements is
also determined with the questions in this section.
The last group of questions in this section concerns the computerized
information systems used to aid HR functions. To what extent the
computerized system is utilized and which HR functions benefit from the
computerized system is assessed.
SECTION III) RECRUITMENT:
The job categories that are hardest to recruit, aids to recruitment, how vacant
positions are filled in general, proportion of external recruitment and the
selection methods used are the major topics that are researched in this
section.
SECTION IV) PAY AND BENEFITS:
The questions in this section try to identify the levels of pay and how basic
pay is determined for managers, professional and technical staff, clerical staff
and manual staff. The change in the share of non-money benefits in the total
category of staff is investigated. Finally, any benefits offered to those with
dependent childen are identified.
SECTION V) TRAINING AND DEVELOPMENT
The first issue of concern in this section is the determination of the
approximate proportion of annual salaries and wages currently spent on
training.
The questions following this section try to calculate the average days training
per year for managers, professional and technical staff , clerical staff and
manual staff respectively. This section also investigates the changes in the
amount of time spent on training for all levels of staff.
How often the training needs are analyzed through projected business/
service plans, through training audits, through line management requests,
through performance appraisal, and through employee requests is also
evaluated.
Organizations which monitor the effectiveness of training are identified and
their methods of monitoring are analysed.
The percentage of organizations where at least a third of the managers have
been trained in areas such as performance appraisal, staff communication,
is the percentage of organizations that provide training courses to update the
skills of women returnees.
The percentage of organizations which regularly use formal career plans,
performance appraisal, career development interviews, assessment centers,
succession plans, planned job rotation, high flier schemes for managers is
investigated, and international experience schemes for managers are
analysed.
The last, but important, part of this section analyses the areas which
organizations think will constitute the main training requirements in the next
three years.
SECTION VI) EMPLOYEE RELATIONS
The first part of this section gathers data concerning trade unions;
(1) The proportion of staff who are members of a trade union.
(2) The percentage of companies recognizing trade unions for the purpose of
collective bargaining.
(3) The percentage of organizations reporting a change in the influence of
trade unions over the last three years.
(4) The percentage of organizations reporting a change in the use of
representative staff bodies for communicating major issues to employees is
The second part of this section gathers data concerning communication with
employees :
(1) The percentage of organizations reporting a change in the use of direct
verbal and written methods to communicate major issues to employees.
(2) The percentage of staff categories such as the management,
professional/technical, clerical and manual staff who are formally briefed
about the strategy and about the financial performance is analyzed.
(3) The methods used for employees to communicate their views to
management with the percentage organizations is further investigated.
(4) The responsibility for formulating policy on staff communication in terms of
IV)ANALYSIS
PART l:DESCRIPTION OF THE ANALYSIS
This study analyses the resulting data at three levels for each section of the
questionnaire.
The first level consists of an analysis and comparison of large to small-
medium scale companies in terms of similarities and differences.
The second level aims to compare the results of this study to the data and
conclusions obtained by the Price Waterhouse Survey.
The third level analyses the PW Europewide results in terms of HRM efforts
in Turkey.
All this analysis seeks to shed some light on Turkey’s HRM philosophy and
practices, what is HRM’s significance and position in the firm, and what are
the strengths and deficiencies in those management strategies.
A significant point to note here is that the questionnaires were responded to
by either the first or second senior personnel in the Human resources or
personnel department of the sample organizations. This is very crucial for
obtaining detailed and clear information for the human resources
Some Limitations of this study:
There were 17 production companies included in this research study. 12 are
grouped as large scale organizations and 5 are grouped as small-medium
scale organizations. The selection of companies was done in such a way that
it would give the researcher a clear picture of the situation for HRM efforts in
Turkey, especially in the production sector.
However before having a cross sectional analysis and comparisons for each
section of questions, it will be useful to mention several facts related to this
study which might be called either shortcomings or limitations, especially in
terms of comparisons done with the results of the Price Waterhouse survey.
(1) The sample size of this study is extremely small compared to the Price
Waterhouse study.
(2) Price Waterhouse completed its analysis for all sectors of companies.
They also included public organizations. This research has mainly focused on
a cross sectional analysis of private companies in the production sector .
Analysis of service sector and public organizations are not in the scope of this
study.
(3) In order to have more concrete and meaningful results, the HRM efforts
for the most leading and powerful companies of Turkey is investigated.
Sabancı Holding, Koç Holding, Eczacıbaşı Holding, and some of their group
companies like Türk Traktör, Ormak, Eczacıbaşı İlaç, Eczacıbaşı Vitra,
Toyotasa, Renault , TAİ, FMC Nurol and Roketsan are the included sample
The medium-small companies:
Orsan, Domsan, Endiksan,O.Yan Sanayi and Aydöküm are the medium-small
PART II: AN ANALYSIS OF DATA FOR EACH SECTION OF QUESTIONNAIRE
This part of the thesis is replete with tables of data. The tables are presented
in the order o f ;
(1) Total Study Data
(2) Data for large companies and medium-small companies separately
(3) PW data for Price Waterhouse results
SECTION I: HUMAN RESOURCES/PERSONNEL DEPARTMENT
STRUCTURE
This section examines the structure of the HR department in the organization,
and investigates the position, title, educational background, and recruitment
procedures for personnel or the HRM team.
The complete results of the survey for this study are presented in appendix B.
Only significant, critical issues are presented in the following pages.
1.1) The percentage of organizations having a personnel or human resource management department/manager:
The data indicates that all of the organizations analyzed have a personnel or
human resource management department/manager.
Table 1.1: Percentage o f organizations having a personnel or human resource departm ent/
m anager
Yes 100
Table MS 1.1: Less than 1000 or greater than or equal to 1000 employees
< 1000 >1000
Yes 100 100
No 0 0
A similar conclusion is easily visible from the results obtained by Price
Waterhouse.
Table PW 1.1: Europeanw ide analysis of Price W ater House
C ountry D(W ) DK E F FIN IRL N NL P S T UK
Yes 97 88 95 99 78 86 93 96 96 98 99 96
No 3 12 5 1 22 13 5 4 4 1 1 3
Source; P olicy and P ractice in European Hum an R esource M anagem ent, The Price W a te rh o u se Cranfield survey, 1992
The data show that Turkey ranked first among the 12 countries included in
the study having a personnel or human resource management
department/manager. It is noteworthy how similar the data are between this
study and PW Survey.
There is a big difference in having a personnel department or a human
resource management department. In most cases the personnel department
is usually limited to recruitment and wage administration issues whereas
HRM departments usually enjoy a larger mandate.
The data of this study and the interviews indicate that this difference still
exists to a great extent. Therefore, having a score of almost 100% should
please us of course, but the reality is somewhat more complicated than that
1.2) Length of time personnel specialists have worked in that role:
Another crucial issue here is the length of time personnel specialists have
worked in that role. The results of this study show that most of the personnel
specialists have spent more than five years in that role.
Table 1.2: Length o f tim e personnel specialists have w orked in that role ( valid %)
Less than one year One to five years More than five years
Not aplicable
24 77
( This is Table 1.4 in A pp e n d ix B )
Table MS 1.2 : Less than 1000 or g reater than or equal to 1000 em ployees
<1000 >1000
Less than one year 0 0
One to five years 60 8
More than five years 40 92
Not applicable 0 0
(This is table MS 1.4 in appendix B )
One noticeable difference is the concentration of human resource specialists
with a background of more than five years in that role for large organizations.
In the case of medium-small scale organizations 60% of the sample firms
seem to have personnel specialists with one to five years experience in that
role.
Table PW 1.2: E uropeanw ide Analysis o f Price W aterh o u se
Country D(W ) DK E F FIN IRL N NL P S T UK
Less than one year 4 6 8 3 3 4 5 7 4 1 2 2
One to five years 9 29 30 22 16 20 24 27 10 16 12 17
More than five years 60 40 37 74 78 52 62 62 21 76 85 73
Not applicable 17 25 25 1 3 24 10 4 64 7 1 8
Here the significant observation is that the time scale for personnel specialists
within their role scores its highest percentage in all countries analyzed at 5
years and above. Note that Turkey is ranked first among all other countries in
this category.
1.3) The percentage of organizations in which the head of personnel /HR function has a place on the main board of directors:
The percentage of organizations in which the head of personnel/HR function
has a place on the main board of directors was analysed. Unfortunately the
data show that in most of the organizations someone other than the
personnel/HR manager is on the board with responsibility for personnel
issues.This is especially true for the small organizations.
Table 1.3: Percentage o f organizations w here the head o f the personnel /H R function has a place
on the main board .
Yes 24
No 77
(This is table 1.9 in ap pe dix B)
Table MS 1.3: Less than 1000 or greater than or equal to 1000 em ployees
< 1 0 0 0 > 1000
Yes 0 33
No 100 67
(This is table MS 1.9 in ap pe nd ix В )
In the sample of organizations the HR director or the HR coordinator in
holdings like Sabancı, Koç, Eczacıbaşı and Renault has a place on the main
In the Price Waterhouse survey it should be noted that Turkey ranked
second last, for the head of the personnel/HR function having no place on the
main board of directors. In 60% of the organizations analyzed for the purpose
of this study the head of the personnel/HR function is represented by another
director.
Table PW 1.3: E u ropeanw ide analysis o f Price W aterhouse
C ountry D(W ) DK FIN IRL NL UK
Yes 30 49 73 84 61 44 71 42 46 84 37 49
No 67 39 23 12 38 38 24 54 46 15 60 47
Source: P olicy and P ractice in E uropean Hum an Resource M anagem ent, The Price W a terho use Cranfield survey, 1992
One easily noticeable result here is that, in France, Sweden and England the
picture is just the opposite. In these countries organizations seem to realize
the necessity of the participation of the HR specialist on the main board of
directors.
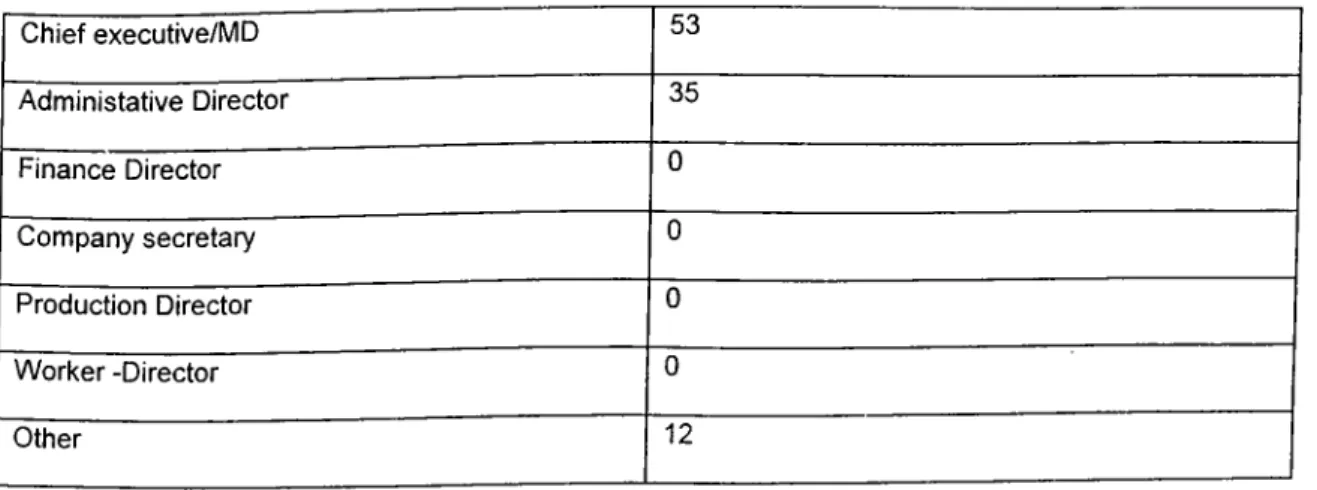
It would be interesting to know “ who has the responsibility for personnel
issues on the main board of directors in case the personnel/HR manager
does not participate?” The following chart tell us.
Table 1.4: Percentage o f organizations with som eone other than the personnel/H R m anager on
the board with responsibility fo r personnel issues.( Valid %)
Chief executive/MD 53 Administative Director 35 Finance Director 0 Company secretary 0 Production Director 0 Worker -Director 0 other 12
For large and medium-small organizations the data are;
Table MS 1.4: Less than 1000 or greater than or equal to 1000 em ployees
< 1000 > 1000 Chief executive/MD 40 58 Administative Director 60 25 Finance Director 0 0 Company secretary 0 0 Production Director 0 0 Worker Director 0 0 Other 0 17
The figures indicate that in most cases either the Chief executive/MD or the
Administrative Director has the responsibility for personnel issues. It is
interesting that in the case of small organizations the Administrative Director
mainly has this responsibility.
Similar trends are observed in case of Price Waterhouse Survey.
Table PW 1.4: E uropeanw ide analysis o f Price W aterhouse
C ountry D(W ) DK E F FIN IRL N NL P S T UK
C h ief executive/M D 26 63 43 35 9 70 26 60 44 22 62 60
A dm inistra tive D irector 20 9 9 15 17 0 12 2 13 52 12 7
Finance D irector 3 8 9 6 7 0 18 15 4 8 2 9 C om pany Secretary 0 0 12 23 0 13 4 0 7 2 0 3 P roduction D irector 2 1 4 4 1 3 0 8 2 2 0 5 W o rk e r D irector 7 2 1 1 0 0 3 4 0 2 2 0 O ther 10 17 21 15 7 15 38 11 15 12 21 15 survey, 1992
The data in terms of Europeanwide analysis indicate that in Sweden the
Administrative Director has the responsibility for personnel issues on the main
board of directors instead of personnel/HR manager, but in 10 of the
European countries the Chief executive has this responsibility. Finland
emphasizes neither the Chief executive nor the Administrative Director in this
position.
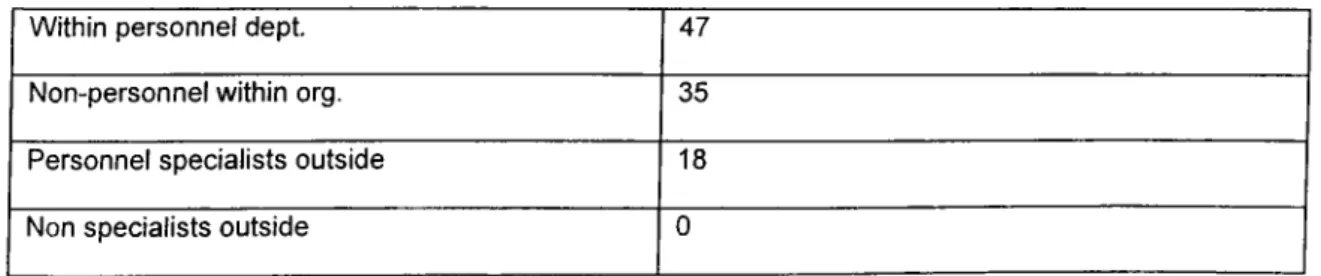
1.5) Source of recruitment of senior personnel/human resource manager:
The analysis done for this purpose show that the senior personnel/human
resource manager is mostly recruited within the personnel department or from
non-personnel specialists within the organization.
Table 1.5: Source o f recruitm ent o f senior personnel/hum an resource m anager
Within personnel dept. 47
Non-personnel within org. 35
Personnel specialists outside 18
Non specialists outside 0
( This is table 1.12 in appe nd ix В )
Table MS 1.5: Less than 1000 or greater than or equal to 1000 em ployees
<1000 >1000
Within personnel dept. 33 55
Non-personnel within org. 33 36
Personnel specialists outside 33 9
Non specialists outside 0 0
( This is table MS 1.12 in ap pendix B )
Although the percentages are not the same one could claim that both in large
and small organizations the personnel/human resource manager is mostly
The results of Price Waterhouse contradict the results of this analysis in this
category.
Table PW 1.5: E uropeanw ide analysis o f Price W aterhouse
C ountry D(W ) DK E F FIN IRL N NL P S T UK
W ith in personnel dept. 22 18 24 16 20 15 15 23 32 20 33 25
Non-personnel w ithin org. 25 34 26 23 30 35 25 16 22 17 20 16
P ersonnel spe cia lists outside 38 25 41 46 31 34 30 51 34 47 38 47
Non spe cia lists outside 10 20 3 13 15 8 25 7 11 14 7 9
Source: Policy and P ractice in European Hum an Resource M anagem ent, The Price W aterho use Cranfield survey, 1992
As seen from the calculated percentages there is also a considerable
percentage of organizations where the senior personnel/human resource
manager is recruited from the personnel specialists outside.Turkey ranked 8th
in this respect.
This study shows that this is not the case for the leading organizations of
Turkey as the Sabancı, Koç and Eczacıbaşı group of companies show. The
variance in findings could be caused by the fact that the PW survey also
included public organizations.
Actually this choice gains importance for small organizations. Here this
analysis and the results of Price Waterhouse reach a certain similarity.
This section has compared and contrasted data concerning the structure of
the HR department, and the role and recruitment of the HR manager and
SECTION II: HUMAN RESOURCE STRATEGY
The section examines the degree of integration between HRM and corporate strategy.
2.1) The main objectives of the personnel or human resource management department over the next three years:
The following figures indicate that most of the organizations mainly aim to
emphasize personnel function, recruitment, training and the organizational
development.
Table 2.1: The main o bjectives o f the personnel or
over the next three years
Personnel function 76
M anpow er planning 35
R ecruitm ent 82
Pay and benefits 77
Job evaluation 18
T rainin g/D e velo pm e nt 77 P erform ance and A ppraisal 77
Em ployee relations 35
E fficiency 12
W o rkfo rce adju stm e nt 0
W orkin g tim e 0
Health and safety 18
O rganizational D e velopm ent 88
Another interesting figure is the emphasis on pay and benefits. Actually most
organizations went beyond those choices in the interviews. For example at
Koç Group companies there is a priority for flat organizations which might be
called a change management or an organizational development. Further
integration of better communication networks within the organization and
among the employees are sited as the other priorities.
For the Sabancı group of firms on the other hand, establishing a “people
vision” which supports corporate strategy, developing a leadership team for
the future and enhancing HR management practices in group companies
were presented as the major objectives.
FMC Nurol, which is a joint venture, emphasizes the essence of attracting
qualified personnel to the company, evaluating the performance of personnel
and compensating them accordingly.
Establishing quality circles, giving more emphasize to career development
programs for employees, improving efficiency are also mentioned as
objectives over the next three years.
The answers from medium-small scale companies are somewhat different.
Table M S 2.1: Less than 1000 or greater than or equal to 1000 em ployees
< 1 0 0 0 > 1000
Personnel function 33 100
M anpow er planning 0 55
R ecruitm ent 83 82
Pay and benefits 50 91
Job evaluation 0 27
T rainin g/D e velo pm e nt 50 100
P erform ance and A pp raisal 17 100
E m ployee relations 33 27
E fficiency 0 18
W orkforce ad ju stm e nt 0 0
W orkin g tim e 0 0
Health and safety 33 9
They emphasize recruitment and training. Domsan, which is a furniture
production company with about 120 employees in total emphasized the
necessity of total quality management for the firm over the next 3 years since
they aim to implement ISO 9000. Therefore recruiting more skillful labor and
more intensive training programs are usually the priories for medium-small
scale organizations. Although both large and medium-small scale
organizations emphasize organizational development what is meant by such
a development varies greatly.
The Price Waterhouse results are as follows:
Table PW 2.1: Europeanw ide analysis o f Price W aterhouse
Country D(W ) DK E F FIN IRL N NL P S T UK
Personnel function 7 19 8 8 2 11 12 8 7 14 5 12
M anpow er planning 4 2 16 14 2 4 4 6 4 7 6 5
R ecruitm ent 11 5 3 4 3 5 4 8 3 3 12 7
Pay and benefits 3 4 6 5 8 4 4 3 5 4 6 9
Job evaluation 1 2 1 4 0 0 1 5 1 0 3 1
T rain ing /D eve lo pm en t 34 31 19 25 12 22 31 26 24 30 25 22
P erform ance appraisal 2 4 2 3 0 2 2 4 0 1 2 2
E m ployee relations 10 10 18 18 20 19 6 12 5 9 7 12
E fficien cy 5 10 8 20 19 20 11 16 10 8 12 18
W orkforce a d ju stm e nt 5 3 4 3 8 1 4 1 8 8 8 2
W orkin g tim e 3 0 0 0 0 0 0 0 1 0 0 0
Health and safe ty 1 1 2 1 2 4 4 2 2 3 1 1
Org.. D e velopm ent 6 7 5 4 5 6 9 10 9 11 3 6
survey, 1992
The survey results claim that training/development is the primary objective
study also show that training/development and recruitment are two of the
major objectives but still most of the organizations emphasized the
importance of performance appraisal, organizational development and all of
them mentioned that there has been at least an awareness in the
organization to improve personnel functions for future success. The
Europewide picture is not very different to that of the efforts in Turkey.
Training/development is major objective in all of the 12 countries analyzed
with the highest percentage but Turkey ranked 8th. Efficiency is also highly
emphasized in all of the countries analyzed. One interesting result is the
importance given as an objective to the improvement of employee relations.
This is especially emphasized in Finland, England, France and Ireland. Here
Turkey ranked 10th. Turkey has the first rank in recruitment and the last rank
in organizational development in Europewide results which helps to explain
why Turkish companies are slow in moving to more effective organizational
paradigms.
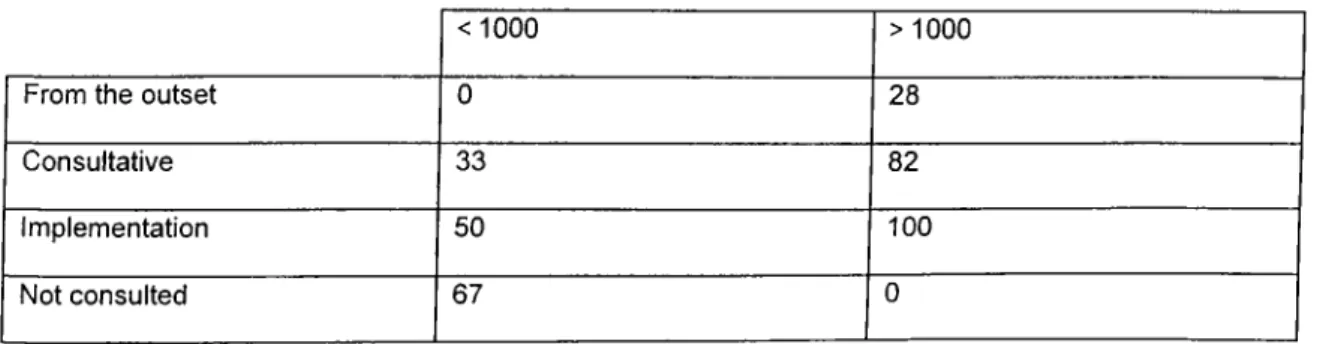
2.2) Personnel/HR department involvement In corporate strategy:
The data indicate that the involvement of the Personnel/HR department in
corporate strategy is usually at the level of implementation.
On the other hand for Holdings the HR department gets involved in the
corporate strategy from the outset, as consultative and 100% in
For group companies HR is rarely involved in consultation but mostly acts at
the level of implementation.
Table 2.2: Personnel/ HR departm ent involvem ent in corporate strategy(valid %)
From the outset 18
Consultative 65
Implementation 83
Not consulted 24
(This is tabie 2.3 in ap pendix B)
For the medium-small scale organizations we see that the HR/Personnel
department is involved in corporate strategy more at the implementation level
rather than consultative.
Table MS 2.2: Less than 1000 o r g reater than or equal to 1000 em ployees
<1000 >1000
From the outset 0 28
Consultative 33 82
Implementation 50 100
Not consulted 67 0
(This is table MS 2.3 in ap pendix В ]
Table PW 2.2: Europew ide analysis o f Price W aterhouse
C ountry D(W ) DK E F FIN IRL N NL P S T UK
From the outset 55 47 54 54 48 50 65 50 42 56 45 53
C onsultative 25 31 25 27 23 31 24 36 30 31 9 32
lim p le m e n ta tio n 10 15 16 16 10 10 9 10 18 8 33 9
Not consulted 10 7 3 3 7 9 3 3 10 6 13 7
Source: Policy and P ractice in European Hum an R esource M anagem ent, The Price W aterho use Cranfield survey, 1992
The Price Waterhouse survey indicates that in Turkey 45% of the
Personnel/HR department has an involvement in the corporate strategy in
most of the organizations from the outset and at the level of implementation.
This study found that this is true only for Sabancı,Koç Eczacıbaşı and Renault
holdings. The interviews and analysis show that HR department is usually
involved at the level of implementation for medium-small scale organizations.
If we analyse the results of Price Waterhouse in detail we see that Turkey
has the lowest percentage for involvement at the consultative level. It also
has the second lowest score for involvement from the outset after Portugal. It
has the highest percentage for the involvement at implementation. Combined
with the results of this study one could say that HR involvement in the
corporate strategy at the outset and as consultative is still poor in Turkey.
Also Turkey has the highest percentage of organizations where HR does not
consult at all to the corporate strategy compared with the other 11 European
countries.
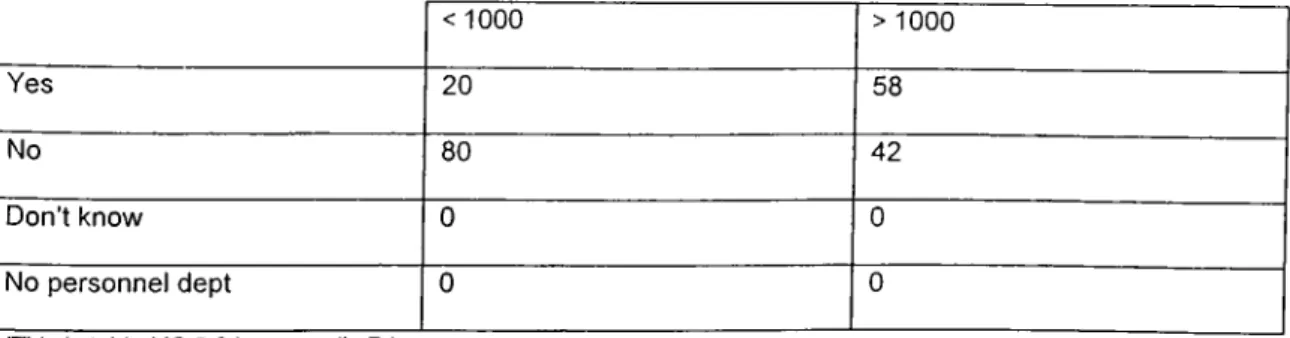
2.3) Percentage of organizations where the performance of the personnel is systematically evaluated:
Table 2.3: Percentage of organizations w here the perform ance of the personnel departm ent Is
system atically evaluated
Yes 47
No 53
Don’t know 0
No personnel dept 0
Table MS 2.3: Less than 1000 or greater than or equal to 1000 employees < 1 0 0 0 > 1 0 0 0 Yes 2 0 5 8 No 8 0 4 2 Don’t know 0 0 No personnel dept 0 0
(This is table MS 2.8 in appendix B )
53% of the organizations replied that there has been no systematic evaluation
of the performance of the personnel department.
In the case of small organizations there is no such evaluation 80% of the
time. Price Waterhouse has ended up concluding that the performance of the
personnel is evaluated in 47% of the sample firms. Their data almost
matches with the results of this study. What is clear is that although it is not
systematic in 100% of the organizations there is an awareness for the
necessity of keeping such data.
Table PW 2.3: Europeanw ide analysis o f Price W aterhouse
C ountry D(W ) DK E F FIN IRL N NL P S T UK
Yes 23 29 50 43 41 35 45 39 40 42 47 46
No 72 60 45 53 42 51 44 54 45 55 46 48
1 D o n’t know 3 5 3 3 4 4 5 4 8 4 3 2
No personnel dept. 1 4 2 0 13 7 1 2 5 0 0 2
survey, 1992
The Europewide results reflect that in 50% of the countries analyzed, there is
no systematic evaluation for the performance of personnel department. This
ratio is significantly high in the case of West Germany, Denmark and
ratio is significantly high in the case of West Germany, Denmark and
Sweden.
The Price Waterhouse figures also show that Turkey has the highest
percentage of systematic personnel evaluation compared with the other 11
countries.
2.4) Criteria used to evaluate performance of the personnel department:
Table 2.4: Criteria used to evaluate perform ance of the personnel dept.(valid %)
Nos of employees per staff 47
Function cost per employees 42
Numbers recruited 53
Numbers trained 67
Performance against budget 77
Performance against objectives 82
Feedback from line mgmt 24
(This is table 2.9 in appendix B )
Performance analysis against objectives and the performance evaluation
against the budget are the most commonly preferred tools for both medium-
small and large organizations.
Another method that is especially mentioned in the Sabancı and Koç group
companies is benchmarking with the best- in- class companies.
Small organizations use function cost per employees and feedback from the
Table MS 2.4: Less than 1000 or greater than or equal to 1000 employees
<1000 > 1000
Nos of employees per staff 60 42
Function cost per employees 60
Numbers recruited 40
Numbers trained 20 17
Performance against budget 40 58
Performance against objectives 60 83
Feedback from line mgmt 80
(This is table MS 2.9 in appe nd ix B)
Although the feedback from the line management is widely used for medium-
small scale organizations one notices that the large companies that are
analyzed in this study claimed not to use (0%) feedback from line
management in evaluating the performance of the personnel department.
This contrast might be interpreted as the strong hierarchical structure of most
of the organizations still in place and also reflects the power of upper
The Price Waterhouse analysis is as follows;
Table PW 2.4: Europeanw ide analysis of Price W aterhouse
Country D(W ) DK E F FIN IRL N NL P S T UK
Nos of em ployees per sta ff
52 38 71 59 22 39 35 44 52 32 59 44
Function cost per em ployee
35 29 65 44 18 35 35 33 50 37 68 45
Num bers recruited 60 34 79 66 13 49 31 54 78 31 73 54
Num bers trained 62 47 85 74 24 69 40 47 89 28 73 68
Perform ance against budget
81 78 95 84 38 91 83 75 84 97 74 90
Perform ance against objectives
36 96 97 85 38 94 96 86 90 87 89 90
Feedback from line m anagem ent
73 87 71 53 33 75 87 83 86 84 65 96
survey, 1992
Turkey has the highest percentage in using function cost per employee
among the twelve countries. This method is mostly prefered mainly by
medium-small scale and also the public organizations. In that comparison
Turkey is third in using numbers recruited and numbers trained. It is the third
lowest in feedback from line management.
2.5) The percentage of organizations who carry out manpower planning:
Table 2.5: Percentage o f organizations w ho carry out m anpow er planning
Yes 82
No 18
Table MS 2.5: Less than 1000 or greater than or equal to 1000 employees Yes < 1000 40 > 1000 100 No 60
(This is table MS 2.10 in appe nd ix B)
It is clear that manpower planning is one of the essential strategic tools for
developing corporate strategy, and the data show that most of the
organizations utilize it. Unfortunately small organizations do this to a much lesser extent.
The Price Waterhouse Survey for manpower planning;
Table P W 2.5: Europeanw ide analysis o f Price W aterhouse
C ountry D(W ) DK E F FIN IRL N NL P S T UK
Yes 87 73 86 65 89 83 45 74 77 81 81 74
No 12 25 14 32 8 15 49 21 20 19 17 24
survey, 1992
In a Europewide analysis Norway seems to pay the least attention to
manpower planning.
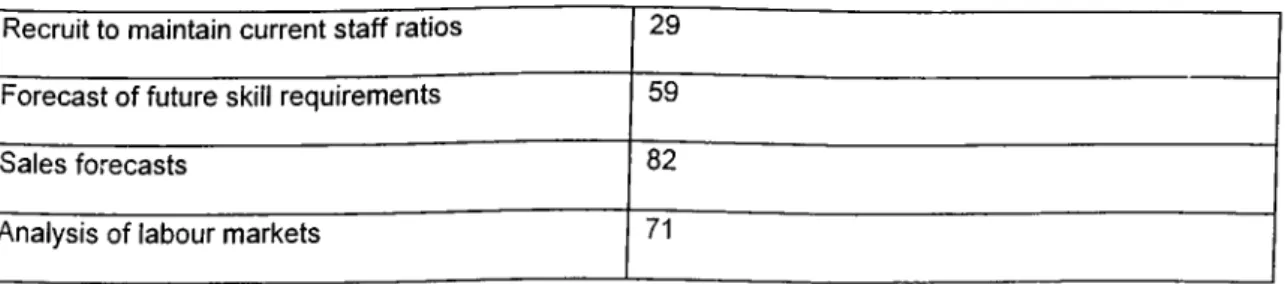
2.6) Percentage of organizations using manpower planning methods;
Table 2.6: Percentage o f organizations using m an po w er planning m ethods.( valid %)
Recruit to maintain current staff ratios 29
Forecast of future skill requirements 59
Sales forecasts 82
Analysis of labour markets 71
Table MS 2.6: Less than 1000 or greater than or equal to 1000 employees
< 1000 > 1000
Recruit to maintain current staff 40 17
ratios
Forecast of future skill 0 83
requirements
Sales forecasts 40 100
Analysis of labour markets 0 92
(This is table MS 2.11 in appendix B )
Here the data show that the percentage of organizations utilizing manpower
planning methods as “sales forecasts” and “analysis of labor markets” is
highest.
Most small-medium scale organizations frequently use recruitment to
maintain current staff ratios and sales forecasts.
Table PW 2.6: E uropeanw ide analysis o f Price W aterhouse
C ountry D(W ) DK E F FIN IRL N NL P S T UK
R ecruit to m aintain 84 70 74 65 9 76 19 94 70 48 92 63
current s ta ff ratos
Forecast o f future skill 86 92 82 94 81 95 80 34 93 90 85 94
req uire m en ts
S ales foreca sts 88 52 87 78 68 71 75 63 74 87 90 83
A na lysis o f labor m arkets 45 46 60 37 37 33 32 62 74 38 74 59
survey, 1992
Turkey ranked highest in “recruit to maintain current staff ratios” and “sales
SECTION III: RECRUITMENT
This section examines recruitment as a major strategy in the field of Human
Resource Management. Turkey is at considerable variance with the rest of
Europe in terms of the categories in which it is difficult to recruit and the
percent of senior managers recruited externally.
3.1) Job categories hardest to recruit:
Most of the HR managers replied that in general there are no recruitment
problems.
Table 3.1: Job categories hardest to re c ru it. ( valid %)
Management 12
Qualified professionals 10
Health and Social 0
Engineers 0
Information Technology 12
Technicians 29
Administrative/Clerical 0
Sales and Distribution r20
Skilled Manual/Crafts 24
Manual 0
Specified by qualifications 20
Foreign languages 15
No recruitm ent problem s 71
Technicians (29%) and skilled manual /crafts (24%) were ranked as the
hardest to recruit in this study. This is mostly true for medium-small scale
production companies. This is probably because these positions are very
There are two concrete conclusions from these data and the interviews. Most
of the large organizations claim that, rather than finding difficulty in
recruiting for several job categories, there are regional recruitment problems.
Most of the applicants resist working in smaller, more distant towns, whereas
most of the factories are located out of the cities or in small towns.
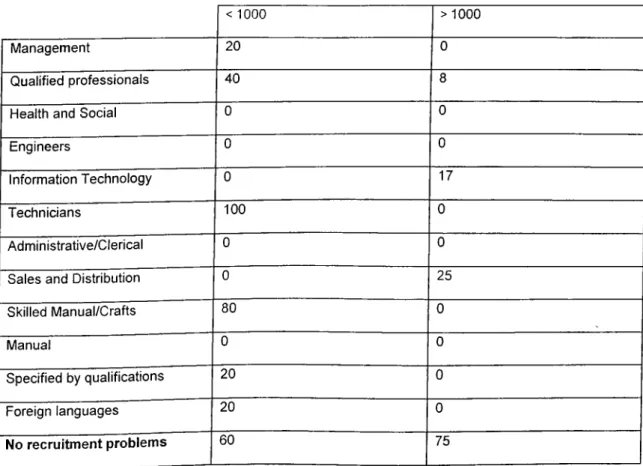
In terms of medium-small scale organizations and the large organizations: Table MS 3.1: Less than 1000 or greater than or equal to 1000 employees
< 1000 >1000
Management 20 0
Qualified professionals 40 8
Health and Social 0 0
Engineers 0 0
Information Technology 0 17
Technicians 100 0
Administrative/Clerical 0 0
Sales and Distribution 0 25
Skilled Manual/Crafts 80 0
Manual 0 0
Specified by qualifications 20 0
Foreign languages 20 0
No recruitment problems 60 75
Price Waterhouse has concluded that almost 46% of the analyzed firms in
Turkey claim that they do not have any recruitment problems and the basic
difficulties are concentrated on recruiting staff in management and skilled
Table PW 3.1: Price Waterhouse Europeanwide analysis
Country D(W ) DK FIN IRL NL UK
M anagem ent 24 28 32 17 22 25 10 17 25 13
Q ualified professionals 17 13 10 14 11 11 11 19 27
Health and social 25 18 51 16
Engineers 11 14 15 13 15 14
Inform ation tech nolog y 11 12
T echnicians 12 17 15 20 14
A dm inistra tive/C le rical
Sales and Distribution 13 11 10
Skilled M anual/C rafts 18 16 12 11 20 25 10 18
M anual
Specified by qualifications
Foreign Languages 13
No recruitm ent problem s 24 65 23 28 74 44 44 18 16 60 46 35
Source: Policy and Practice in European Hum an Resource M anagem ent. The Price survey, 1992
W aterho use C ranfield
In comparison to the other 11 European countries Turkey has the second
lowest problems in the recruitment of management. This is probably a
reflection of the tradition of using family members and of the traditional
management paradigm still extant in a high percentage of Turkish companies.
On the other hand Turkey has the highest percentage of difficulty in recruiting
engineers. The results of this study contradict with that but that might be true