(Makale Gönderim Tarihi: 20.04.2016 / Yayına Kabul Tarihi: 28.07.2016)
Cointegration and Causality Relationship between
BIST 100 and BIST Gold Indices
Süleyman AÇIKALIN
*E. Savaş BAŞCI
**ABSTRACT
The aim of this study is to determine the nature of the long term relationship between the BIST Gold Market Index (GOLD) and BIST 100 index (BIST). The daily closing values of both indices are obtained from the Borsa Istanbul’s official web site for the period of August 1st 2012 to March 17th 2015. Statistical methods of the Augmented Dickey Fuller (ADF) unit root test, Engle-Granger cointegration test, error correction model, and finally Engle-Granger causality tests are used in the study. It is concluded that BIST and GOLD are cointegrated, which means that a long term equilibrium relationship exists between the two indices. The Granger causality test indicated that there is a unidirectional causality running from BIST towards GOLD for the period under investigation. In terms of short term dynamics, it is determined that the rate of the disequilibrium correction is slow at only about 2% on a daily basis. Any deviation from the long run equilibrium value is eliminated after about 50 days.
Key Words: cointegration, error correction model, BIST 100, BIST GOLD JEL Classification: C10, G10, G23
BİST 100 ve BİST Altın Endeksleri Arasındaki Eşbütünleşme ve Nedensellik İlişkisi
ÖZ
Bu çalışmanın amacı BIST Altın Piyasa Endeksi (GOLD) ve BIST 100 endeksi (BIST) arasında uzun dönemli ilişki olup olmadığını tespit etmektir. Söz konusu endekslerin 1 Ağustos 2002 ile 17 Mart 2015 tarihleri arasındaki günlük kapanış değerleri Borsa İstanbul’un resmi internet sitesinden alınmıştır. Bu çalışmada Dickey Fuller birim kök testi, Engle-Granger eş bütünleşme testi, hata düzeltme modeli ve Granger nedensellik testi gibi istatistiksel yöntemler kullanılmıştır. BIST ve GOLD endeksleri arasında uzun dönemde denge var anlamına gelen eş bütünleşme tespit edilmiştir. Granger nedensellik testi çalışılan dönem için BIST endeksinden GOLD endeksine doğru tek yönlü bir nedensellik ilişkisinin varlığını göstermiştir. Kısa dönem dinamikleri açısından eşitsizlik düzeltme hızının düşük ve günlük olarak yalnızca %2 oranında olduğu belirlenmiştir. Uzun dönem denge değerinden bir sapma yaklaşık 50 günlük bir süreçte ortadan kalkmaktadır.
Anahtar Kelimeler: eş bütünleşme, hata düzeltme modeli, BIST 100 Endeksi, BIST Altın Endeksi
JEL Sınıflaması: C10, G10, G23
INTRODUCTION
Stock market indices are quite responsive to changes in domestic economic conditions, as well as changes in economic and financial expectations. International developments in real and financial markets would also affect their performances. Oil prices, exchange rates, interest rates, stock market indices, the
*
Yrd. Doç. Dr. Hitit Üniversitesi, İİBF, İktisat Bölümü, [email protected] **
price of precious metals and commodities could be listed among selected variables that could interact with the performance of stock markets. The long term interdependency among such variables has been called into question, and analyzed in economic and financial literature with various econometric models. The long run integration and the short run dynamics of this integration between the stock market and gold is another area of study in the literature. Understanding the interdependent workings of the system as a whole could provide useful information for investors, policy makers and other related parties.
Stock markets are very important in facilitating economic growth and development by providing an alternative platform in obtaining funds for new investment opportunities besides the countless other services they provide for the economy (Pradhan et al. 2014; Cooray 2010; Beck and Levine 2004; Caporale, Howells, and Soliman 2004; Arestis, Demetriades and Luintel 2001; Ross and Zervos 1998 and 1996).
The performance of gold is different than the performance of the stock markets. Generally, gold is considered as a safer asset relative to stocks (Mulyadi and Anwar, 2012). Historically gold has been accepted as a safe haven asset in the literature (Beckmann et al. 2014, Reboredo 2013, Baur and Thomas 2010, Baur and Lucey 2010, Jaffe 1989). There is discussion on the nature of gold, whether as a safe haven or a hedge against stocks. Baur and Lucey (2010) defined an asset as a safe haven asset when it is uncorrelated or negatively correlated with another financial asset not on average but during the turmoil periods. Even though there is not any theoretical model explaining gold’s position as a safe haven asset, it is possible to say that this perception is due to fact that gold was traditionally used to hedge against inflation and is also relatively uncorrelated with other alternative assets (Baur and Lucey, 2010). The three characteristics of gold made its special position as a safe haven asset: generally, there is not any statistically significant correlation between returns on gold and macroeconomic variables such as GDP and interest rate; the effect of macroeconomic variables on the price of gold is weak relative to other commodities; the return on gold is less correlated with equity and bond than returns on other commodities (Lawrance, 2003).
The stock market and gold both serve as financial investment alternatives for the parties with excess funds on hand. There are other alternatives in the financial markets serving the same purpose such as bonds, mutual funds, foreign exchanges and son on. The purpose of this study is to investigate the relationship between the stock market and gold with a cointegration method based on two indices in Borsa Istanbul: BIST 100 and BIST Gold. Studying the relationship among these options could provide useful information for investors, policy makers and other interested parties.
The remainder of this paper is organized as follows. Section 2 provides an overview of the related literature. Section 3 describes the data and the methodology. The main findings of the study are presented in Section 4, which is followed by the conclusion.
II. LITERATURE REVIEW
There has been a considerable amount of research on the true nature of the relationship among economic variables such as stock market indices, commodity prices, precious metals, foreign exchanges, interest rates, and so on. The results of these studies are often used to confirm or reject relationships projected on theoretical grounds under certain conditions and/or to provide useful information for decision makers on all levels to be used in making better decisions.
Cointegration is one of the econometric methods used to analyze the long term relationship among selected variables. This method is employed to study the long run relationship between the Borsa Istanbul’s National 100 stock exchange index and Borsa Istanbul’s Gold index.
While the cointegration method is used for studying the relationship among various variables, stock market indices are one of the frequently used variables due to their critical role in today’s well developed and linked financial markets. Gold, on the other hand, is not frequently used in cointegration studies probably due to its special position as its performance is quite independent from other variables such as interest rates or exchange rates. Because of its special position gold is considered as a safe haven and/or a hedge asset in portfolio diversification literature. The motivation behind this study is to fill this gap in the literature and to see what points could be made after a thorough analysis with the data from Borsa Istanbul.
There are relatively a limited number of cointegration studies analyzing just the relationship between stock markets and gold (Srinivasan & Prakasam 2015; Bilal et al. 2013; Mukhuti & Bhunia 2013; Patel 2013; Sharma & Mahendru 2010; Smith 2001). The selected number of cointegration studies on the stock market, exchange rates and oil are Abidin, Sazali, et al., 2013-cointegration among stock prices and exchange rates in Asia-Pacific Countries; Bhunia and Pakira 2014-cointegration among gold price, exchange rates and stocks (SENSEX) in India; Harri, Nalley, and Hudson 2009-oil price, exchange rates and commodity prices; Samanta and Zadeh 2012-the co-movements of oil, gold and the US dollar; Simakova 2011-the relationship between oil and gold prices.
Most of the studies analyzing the relationship between gold and stocks are performed using the Indian stock markets and gold data, probably since gold has a special place in India because of historic and cultural reasons.
The following section provides a detailed information on cointegration studies focused only on gold and stocks. Sharma and Mahendru (2010) found that the exchange rate and gold price have a statistically significant impact on the stock prices of the BSE (Bombay Stock Exchange) for the period of January 2008 to January 2009. Bilal, Ahmad Raza, et al. (2013) concluded that while no long-run relationship exists between the monthly average gold prices and KSE stock index; a significant long-run relationship is found between the BSE stock index and average gold prices based on the cointegration test results using monthly data
from July 1st 2005 to June 30th 2011. Mukhuti and Bhunia (2013) explored the relationship between Indian stock market indices Sensex and Nifty and Indian gold price. The study concluded that while the bivariate cointegration test did not show any cointegration, but the multivariate cointegration test showed a steady cointegration between the gold price and the two indices in India using data for the period of January 2nd 1991 to August 10th 2012. The study also concluded that the gold price in India increased during this
period because of the effects
coming from the stock market along with other macroeconomic factors.
Srinivasan and Prakasam (2015) analyzed the relationship among the exchange rate, gold price and stock price based on monthly time series data for the period of June 1990 to April 2014. They determined that while there is no sign of a stable cointegration between stock prices and gold prices, the gold price and stock price have a long term relationship with the
exchange rate. Patel (2013)
analyzed the long and short run relationship among the Mumbai gold prices and stock market indices (Sensex, BSE 100 and S&P CNX Nifty) for the period of January 1991 to December 2011. It concluded that a long run equilibrium exists between the gold price and three stock indices. The evidence also suggested a causality running from the gold price to the Nifty index. The relationship between the performances of the stock market and gold prices is questioned for developed economies and dominant stock markets. Smith (2001) used four gold prices and six stock price indices for the period extending from January 1991 to October 2001. There was no cointegration among these indices but the Granger causality tests showed evidence of unidirectional causality from the US stock market to gold price set in the London morning fixing and the closing price.There are various studies covering the relationship among gold, stocks and other selected macroeconomic variables in Turkey. Akel and Gazel (2015) used the GARCH method and daily data from July 2004 to November 2014 questioned whether gold has played a safe haven role for stocks during financial crisis periods. The study concluded that gold was not considered as a safe haven investment option by the investors in Turkey. Çoşkun and Ümit (2016) questioned the nature of the long term relationship among the return of Borsa Istanbul 100, US Dollar to Turkish Lira exchange rate, London Bullion Market Association gold fixing price, interest rate on TL saving deposits, and real house price index over the period of January 2000 to July 2014. While Johansen cointegration test suggests an existence of a long term relationship among these variables, Maki cointegration estimation method did not provide evidence supporting such a relationship. Öncü et al. (2015), based on daily data covering the period from January 2002 to November 2013, concluded that real exchange rate and gold were determined as the Granger causes of Borsa Istanbul 100 and also gold is the Granger cause of real Exchange rate. Aksoy and Topcu (2013) concluded that there is a long term equilibrium relationship exists between gold, stocks, bonds, consumer price index and producer price index in Turkey based on a Johansen cointegration analysis using monthly data from January 2003 to December 2011. Moreover, a negative relationship between return on gold and
return on stock and a positive relationship between return on gold and return on inflation based on producer price index is found. Kaya et al. (2013) investigated the relationship between return on BIST 100 and selected other macroeconomic variables with monthly data covering the period from January 2002 to June 2012. The study found a positive relationship between stock returns and money supply (M2) and a negative relationship between stock returns and exchange rate.
III. DATA AND METHODOLOGY
In this study we used two variables: The Istanbul Stock Exchange National 100 Index (BIST) and BIST Gold Index (GOLD). The data consists of the daily closing values of these two indices from August 1st 2012 to March 17th 2015. There are a total of 1370 observations with 685 observations for each index.
We have generated log values of both series, labelled as L_BIST and L_GOLD before conducting the unit root test. A graph of these series is presented below as Figure 1. Figure 1 11.0 11.1 11.2 11.3 11.4 11.5 7.8 7.9 8.0 8.1 8.2 8.3 8.4
III IV I II III IV I II III IV I
2012 2013 2014 2015
L_BIST L_GOLD
In case of studying with time series data, it is necessary to ensure that the data is stationary before conducting further econometric analysis to avoid certain problems. The ADF unit root test is used following the empirical literature to obtain a stationary series.
The formulation of the ADF unit root test is given in Equation 1.
In Equation 1, null hypothesis implies that there exist a unit root or series are non stationary or = 0. Otherwise, alternative hypothesis states that there is not a unit root or series are stationary or < 0.
After obtaining a stationary time series, the Engle-Granger (1987) two-step methodology was used to test for cointegration. This test is used to evaluate the long term relationship between variables by using estimated residuals. The purpose of the Engle-Granger cointegration test is to have a likelihood ratio for the determination of the cointegrated vectors.
After determining the cointegration between the two series, it is also necessary to analyze the short run nature of the relationship between the same two variables. Thus an Error Correction Model can help to correction, in Equation 2.
In Equation2
,
refers to the coefficient that it tested, a proportion of the previous deviationfrom
the long run relationship that it is reacted by.
After completing the error correction, causality relationship analysis could be performed between the two variables using the Granger causality (1969) test that is shown in Equation 3.
In Equation 3, X and Y represents two different variables which are tested for Granger causality.
IV. EMPIRICAL RESULTS
At the beginning of the study we obtained BIST and GOLD data from the web site of Borsa Istanbul. In order to avoid the scale problem we took the log values of both series. The correlation coefficient and the descriptive statistics for the series are calculated and presented as Table 1 and Table 2 below.
Stocks and gold are substitutes for each other for allocating excess funds to alternatives in a portfolio. The stock market index expected to show a higher response to economic developments relative to the gold price and gold index. Moreover, gold is well accepted as a hedge asset against stocks. Therefore, the short run relationship between gold and stocks should have a small negative sign. The correlation coefficient between the BIST 100 index and Gold index is calculated as -0.194551 as shown in Table 1.
Table 1. Correlation Matrix for Series
GOLD BIST
GOLD 1.000000 -0.194551
BIST -0.194551 1.000000
The rate of return is calculated as Rt = (Xt –Xt-1)/Xt-1. Another correlation
is calculated between rate of returns for BIST and GOLD and found as -0.0064. It is a very small negative number and it supports the expected negative sign. The scatter diagram of the rate of returns for GOLD and BIST is shown as Figure 2.
Figure 2 -.12 -.08 -.04 .00 .04 .08 -.06 -.04 -.02 .00 .02 .04 .06 GOLD_RETURN B IS T _ R E T U R N
Table 2. Descriptive Statistics for Series
L_BIST* L_GOLD* Mean 11.24307 8.054006 Median 11.25508 8.009277 Maximum 11.44228 8.318242 Minimum 11.02173 7.878417 Std. Dev. 0.094189 0.127589 Skewness -0.334506 0.772986 Kurtosis 2.379613 2.172034 Jarque-Bera 23.75969 87.78154 Probability 0.000007 0.000000 Sum 7701.500 5516.994 Sum Sq. Dev. 6.068191 11.13478 Observations 685 685 * Log Series
When time series data is used in an econometric analysis, it is necessary to control the stationarity of the data first. The ADF unit root test is calculated and the results are presented in Table 3.
Table 3. Results of the ADF Unit Root Test for Each Series
Series Level t-Statistics (ADF Prob.)* First Differences None t-Statistics (ADF Prob.)* Intercept t-Statistics (ADF Prob.)*
Trend & Intercept t-Statistics (ADF Prob.)* L_BIST 0.621125 (0.8503) -27.73275 (0.0000) -27.73094 (0.0000) -27.71938 (0.0000) L_GOLD -1.154728 (0.2266) -25.16689 (0.0000) -25.19404 (0.0000) -25.17650 (0.0000) *MacKinnon (1996) one-sided p-values.
The ADF unit root test results show that the L_BIST and L_GOLD are stationary in the first differences, I(1). Since both of the data sets are stationary at their first differences, we can use the Engle-Granger cointegration test. The Engle-Granger cointegration test based on two-step methodology is presented in Table 4.
Table 4. Engle-Granger Cointegration Test
t-Statistic Prob.* Augmented Dickey-Fuller test statistic -27.73792 0.0000
Test critical values: 1% level -2.568352
5% level -1.941287
10% level -1.616388
Null Hypothesis: RESIDUAL has a unit root *MacKinnon (1996) one-sided p-values.
By rejecting the null hypothesis, of the residual has a unit root (i.e. not stationary at 1% significance level as p=0.0000) we concluded that the L_BIST and L_GOLD are cointegrated. It means that they reach equilibrium in the long run.
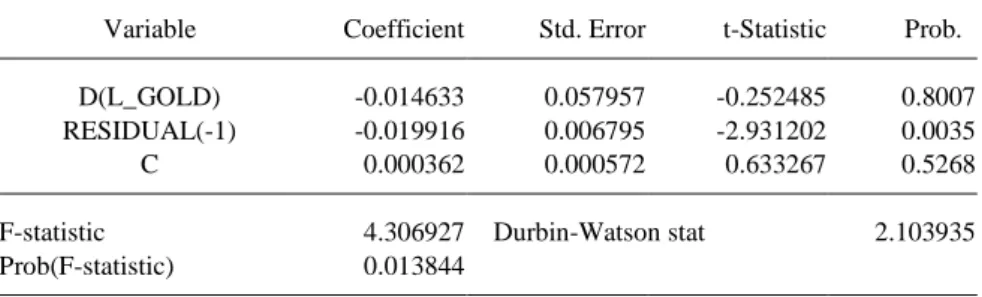
The short run nature of the economic relationship between the L_BIST and L_GOLD is analyzed and the results are presented in Table 5. The coefficient of Residual(-1), which is known as the estimated coefficient of correction term, is –0.019916 and it is statistically significant at 1% as its p-value is 0.0035. In order to conclude that the system goes back to equilibrium in the short run, the coefficient of the correction should be between 0 and 1. This coefficient is -0.019916 and it means that about 2% of any disequilibrium is corrected on a daily basis. Therefore, it takes about 50 days to eliminate the disequilibrium created at the beginning.
Table 5. Results of the OLS to Determine the Short-Term Relationship
Variable Coefficient Std. Error t-Statistic Prob.
D(L_GOLD) -0.014633 0.057957 -0.252485 0.8007
RESIDUAL(-1) -0.019916 0.006795 -2.931202 0.0035
C 0.000362 0.000572 0.633267 0.5268
F-statistic 4.306927 Durbin-Watson stat 2.103935
Prob(F-statistic) 0.013844 Dependent Variable: D(L_BIST)
The result of the Granger causality test is presented in Table 6, and it showed that there is a uni-directional causality running from L_BIST to L_GOLD
.
Table 6. Results of the Granger Causality
Dependent variable: L_BIST Chi – sq. Prob Result
L_GOLD 0.565788 0.7536 DOES NOT GRANGER CAUSE
Dependent variable: L_GOLD Chi – sq. Prob Result
L_BIST 9.609011 0.0082 GRANGER CAUSE
H0: A does not Granger-cause B
CONCLUSION
The long term relationship between BIST 100 and BIST GOLD was investigated using cointegration analysis. Data from the Borsa Istanbul’s official web site for the period of August 1st 2012 to March 17th 2015 is used in the study. It is determined that BIST and GOLD are cointegrated. It means that a long term equilibrium relationship exists between these two variables. In order to understand the short term dynamics between BIST and GOLD series, an error correction model is used and it is found that the disequilibrium is corrected at a daily rate of about 2%. Moreover, the Granger causality test showed that there is a uni-directional causality running from BIST to GOLD. It means the initial changes in the BIST 100 index is followed by later changes in the BIST GOLD index for the period of 2012 to 2015. We can conclude that the BIST 100 index’s performance provides useful information in predicting the changes in the BIST Gold index.
REFERENCES
Abidin, S., Walters, C., Lim, K. L., & Banchit, A. (2013). Cointegration between stock prices and exchange rates in Asia-Pacific countries. Investment Management and Financial
Innovations, 5(2), 142-146.
Akel V., Gazel S. (2015). Fı̇nansal Piyasa Rı̇skı̇ ve Altın Yatırımı: Türkı̇ye Örneği. Ç.Ü. Sosyal
Bilimler Enstitüsü Dergisi, 24(1), 335-350
Aksoy, M., & Topcu, N. (2013). Altın İle Hisse Senedi Ve Enflasyon Arasındaki İlişki. Atatürk
Üniversitesi İktisadi ve İdari Bilimler Dergisi, 27(1), 59-78
Arestis, P., Demetriades, P. O., & Luintel, K. B. (2001). Financial development and economic growth: the role of stock markets. Journal of Money, Credit and Banking, 16-41.
Baur, D. G., & Lucey, B. M. (2010). Is gold a hedge or a safe haven? An analysis of stocks, bonds and gold. Financial Review, 45(2), 217-229.
Baur, D. G., & McDermott, T. K. (2010). Is gold a safe haven? International evidence. Journal of
Banking & Finance, 34(8), 1886-1898.
Beck, T., & Levine, R. (2004). Stock markets, banks, and growth: Panel evidence. Journal of
Banking & Finance, 28(3), 423-442.
Beckmann, J., Berger, T., & Czudaj, R. (2015). Does gold act as a hedge or a safe haven for stocks? A smooth transition approach. Economic Modelling, 48, 16-24.
Bhunia, A., & Pakira, S. (2014). Investigating the Impact of Gold Price and Exchange Rates on SENSEX: An Evidence of India. European Journal of Accounting, Finance &
Business, 2(1), 1-11.
Bilal, A. R., Talib, N. B. A., Haq, I. U., Khan, M. N. A. A., & Naveed, M. (2013). How gold prices correspond to stock index: a comparative analysis of Karachi stock exchange and Bombay stock exchange. World Applied Sciences Journal, 21(4), 485-491.
Caporale, G. M., Howells, P. G., & Soliman, A. M. (2004). Stock market development and economic growth: the causal linkage. Journal of economic development, 29(1), 33-50. Cooray, A. (2010). Do stock markets lead to economic growth?. Journal of Policy Modeling, 32(4),
448-460.
Çoşkun, Y., & Ümit, O. (2016). Türkiye’de Hisse Senedi ile Döviz, Mevduat, Altın, Konut Piyasaları Arasındaki Eşbütünleşme İlişkilerinin Analizi. Business and Economics Research
Journal, 7(1), 47-69, DOI Number: 10.20409/berj.2016116804
Dickey, D. A., & Fuller, W. A. (1981). Likelihood ratio statistics for autoregressive time series with a unit root. Econometrica: Journal of the Econometric Society, 1057-1072.
Engle, R. F., & Granger, C. W. (1987). Co-integration and error correction: representation, estimation, and testing. Econometrica: Journal of the Econometric Society, 251-276. Granger, C. W. (1969). Investigating causal relations by econometric models and cross-spectral
methods. Econometrica: Journal of the Econometric Society, 424-438.
Harri, A., Nalley, L., & Hudson, D. (2009). The relationship between oil, exchange rates, and commodity prices. Journal of Agricultural and Applied Economics, 41(2), 501-510. Jaffe, J. F. (1989). Gold and gold stocks as investments for institutional portfolios. Financial
Analysts Journal, 45(2), 53-59.
Kaya, V., Çömlekçi, İ., & Kara, O. (2015). Hisse Senedi Getirilerini Etkileyen Makroekonomik Değişkenler 2002–2012 Türkiye Örneği. Dumlupınar Üniversitesi Sosyal Bilimler Dergisi, 35(35), 167-176
Lawrence, C. (2003). Why is gold different from other assets? An empirical investigation. London,
UK: The World Gold Council.
Levine, R., & Zervos, S. (1996). Stock market development and long-run growth. The World Bank
Economic Review, 10(2), 323-339.
Mukhuti, S., & Bhunia, A. (2013). Is it true that Indian gold price influenced by Indian stock market reaction?. E3 Journal of Business Management and Economics., 4(8), 181-186.
Mulyadi, M. S., & Anwar, Y. (2012). Gold versus stock investment: An econometric analysis. International Journal of Development and Sustainability, 1(1), 1-7.
Öncü, M. A., Çömlekçi, İ., Yazgan, H. İ., & Bar, M. (2015). Yatırım Araçları Arasındaki Eşbütünleşme (BİST100, Altın, Reel Döviz Kuru). Abant İzzet Baysal Üniversitesi Sosyal
Bilimler Enstitüsü Dergisi, 15(1), 43-57, Doi: http://dx.doi.org/10.11616/AbantSbe. Patel, S. A. (2013). Causal Relationship Between Stock Market Indices and Gold Price: Evidence
from India. IUP Journal of Applied Finance, 19(1), 99.
Pradhan, R. P., Arvin, M. B., Hall, J. H., & Bahmani, S. (2014). Causal nexus between economic growth, banking sector development, stock market development, and other macroeconomic variables: The case of ASEAN countries. Review of Financial Economics, 23(4), 155-173. Reboredo, J. C. (2013). Is gold a safe haven or a hedge for the US dollar? Implications for risk
management. Journal of Banking & Finance, 37(8), 2665-2676.
Samanta, S. K., & Zadeh, A. H. (2012). Co-movements of oil, gold, the US dollar, and stocks. Modern Economy, 3(01), 111.
Sharma, G. D., & Mahendru, M. (2010). Impact of macro-economic variables on stock prices in India. Global Journal of Management and Business Research, 10(7).
Šimáková, J. (2011). Analysis of the relationship between oil and gold prices.Journal of
Finance, 51(1), 651-662.
Smith, G. (2001). The price of gold and stock price indices for the United States. The World Gold
Council, 8, 1-16.
Srinivasan, P., & Prakasam, K. (2015). Gold Price, Stock Price and Exchange Rate Nexus: The Case of India. Srinivasan P. and Karthigai, P.(2014), Gold Price, Stock Price and Exchange Rate