International Refereed Journal
Karaelmas Journal of Educational Sciences
Journal Homepage: ebd.beun.edu.tr
Development of an Attitude Scale towards Statistics: A Study on
Reliability and Validity
Timur KOPARAN
1Received: 01 July 2015, Accepted: 11 September 2015
ABSTRACT
The aim of this study is to develop a scale to identify attitudes towards statistics. First draft from involves 32 items that was prepared as result of review of the previous studies. The draft form was applied to 76, 6th grades, 64, 7th grade, 100, 8th grade-240 in total- students in a middle school in Trabzon-Turkey. Using the data gained, the validity and reliability of the scale was analysed. In the reliability analysis, Cronbach-alfa internal coefficient of consistence, split-half reliability, item-total correlations, t-test, the significance of the differences between the item means of the groups of upper %27 and lower %27 were examined. In the validity analysis, results of exploratory factor analysis were evaluated. The calculated KMO value after these items were excluded was 0,823. The Barlett’s test, which was applied to the data obtained in order to determine whether distribution in the population normal or not in the factor analysis, resulted as significant (Approx. Chi-Square = 1611, 401; p = 0,000). As a consequence to the evaluations, a 20-items valid and reliable scale (α=0,815) was gained.
Keywords: Statistics Education, Attitude towards Statistics, Scale Development
EXTENDED ABSTRACT
In today's society statistical skills has become increasingly more important. Therefore, countries have been more places than ever before in the curriculum for teaching statistics (Koparan & Güven 2014). Despite the emphasis on education statistics are experiencing difficulties in learning and teaching statistics (Koparan, 2015). One of the reasons of occurrence of these challenges are attitudes. Such negative attitudes can be create barriers to learning and teaching statistics (Waters, Martelli, Zakrajsek, & Popovich, 1998). For this reason attitudes have received increasing attention in recently. The review of literature indicated that there is a few measurement tool (Doğan & Başokçu, 2010; Yaşar, 2014) for determining the attitudes of middle school students towards statistics in Turkey. Therefore, the aim of this study is to develop a scale for the measurement of middle school students’ attitudes towards statistics.
Studies on statistics education were scanned before the development of the scale for measuring attitude towards statistics of middle school students. The scales developed by researchers were examined (Roberts & Saxe, 1982; Cruise, Cash & Bolton, 1985; Wise, 1985; Schau, Stevens, Dauphinee & Del Vecchio, 1995; Dauphinee, Schau & Stevens, 1997). Considering the language properties and cultural differences, some items were adjusted and used. On the other hand, some items were included in 32-item draft form which was prepared with the help of the results of the researcher’s interview with the teachers.
This study is an attitude scale development work. But it was conducted with descriptive research model. The study group involves total 240 students at a middle school in Trabzon province. The students are from 6, 7th, and 8th grades and each grade includes 3 different classes. 130 (%54) of the students are girls and 110 (%46) of the students are boys.
Using the data gained, the validity and reliability of the scale was analysed. In the reliability analysis, Cronbach-alfa internal coefficient of consistence, split-half reliability, item-total correlations, t-test, the significance of the differences between the item means of the groups of upper %27 and lower %27 were examined. In the validity analysis, results of exploratory factor analysis were evaluated. The calculated KMO value after unfit items were
excluded was 0,823. The Barlett’s test, which was applied to the data obtained in order to determine whether distribution in the population normal or not in the factor analysis, resulted as significant (Approx. Chi-Square = 1611, 401; p = 0,000). As a consequence to the evaluations, a 20-items valid and reliable scale (α=0,815) was gained.
İstatistiğe Yönelik Tutum Ölçeği Geliştirilmesi: Geçerlik ve
Güvenirlik Çalışması
Timur KOPARAN
1Başvuru Tarihi: 01 Temmuz 2015, Kabul Tarihi: 11 Eylül 2015
ÖZET
Bu araştırma ile istatistiğe yönelik bir tutum ölçeği geliştirilmesi amaçlanmıştır. İlk taslak konu ile ilgili daha önce yapılan araştırmaların taranması sonucu oluşturulan 32 madde içermektedir. Taslak form 2010-2011 öğretim yılında Trabzon ilinde bir ortaokulda öğrenim gören 76 6. sınıf, 64 7. sınıf, 100 8. sınıf öğrencisi olmak üzere toplam 240 öğrenciye uygulanmıştır. Elde edilen veriler kullanılarak ölçeğin geçerlilik ve güvenilirlik çalışmaları yapılmıştır. Güvenirlik çalışmasında Cronbach Alpha iç tutarlılık katsayısı, iki yarı test güvenirliği, madde-toplam puan korelasyonu, %27’lik alt ve üst grupların madde ortalama puanları arasındaki farkların sınanması için t testi; geçerlilik çalışmasında ise faktör analizi sonuçları değerlendirilmiştir. Uygun olmayan maddelerin ölçekten çıkarılmasının ardından hesaplanan Kaiser-Meyer-Olkin (KMO) değerinin 0,823 olduğu görülmüştür. Yapılan faktör analizinde evrendeki dağılımın normal olup olmadığının belirlenmesi amacıyla elde edilen veriler için uygulanan Barlett testi anlamlı (Approx. Chi-Square = 1611,401; p = 0,000) çıkmıştır. Analizler sonucunda geçerli ve güvenilir (α=0,815) olduğuna karar verilen 20 maddelik ölçek elde edilmiştir.
Anahtar Kelimeler: İstatistik Eğitimi, İstatistiğe Yönelik Tutum, Ölçek Geliştirme
1. Introduction
In today's society statistical skills has become increasingly more important. Therefore, countries have been more places than ever before in the curriculum for teaching statistics (Koparan & Güven 2014). Despite the emphasis on education statistics are experiencing difficulties in learning and teaching statistics (Koparan, 2015). One of the reasons of occurrence of these challenges are attitudes. Such negative attitudes can be create barriers to learning and teaching statistics (Waters, Martelli, Zakrajsek, & Popovich, 1998). For this reason attitudes have received increasing attention in recently. There are two statistical literacy model in literature (Gal, 2002; Watson & Callingham, 2003). These models are used to define and characterize the level of statistical literacy or components. Besides they emphasize attitudes. For example Gal (2002) model involves both knowledge elements and dispositional elements. Knowledge elements are literacy skills, statistical knowledge, mathematical knowledge, context/world knowledge, critical questions. Dispositional elements are attitudes, beliefs and critical stance. According to some researchers attitudes are effective in use and the development of statistical thinking (Wallman, 1993; Gal, 2002; Watson, 2006; Garfield & Ben-Zvi, 2007). Therefore, it is important to examine attitudes towards statistics. Attitudes deserves attention because of three cases. 1. Affect the teaching and learning process (process considerations); 2. Affect statistical behavior outside school (outcome considerations); 3. Take place in the curriculum of statistics (access considerations) (Gal, Ginsburg, & Schau, 1997). Attitude has a three-part structure: a cognitive dimension, affective and behavioral dimensions (Reid, 2006). Assessment of attitudes toward statistics and their relationship with other variables is only possible with the appropriate scale. Although the existing literature in several attitude scales for statistics (Roberts & Saxe, 1982; Wise, 1985; Schau, Stevens, Dauphinee, & Del Vecchio, 1995; Dauphinee, Schau & Stevens, 1997) lighten up and examination is needed. The review of literature indicated that there is a few measurement tool (Doğan & Başokçu, 2010; Yaşar, 2014) for determining the attitudes of middle school students towards statistics in Turkey. Therefore, the aim of this study is to develop a scale for the measurement of middle school students’ attitudes towards statistics. It is expected that the study will contribute to the mathematics education. The scale which is developed in this study can be used both by teachers and researchers on this field to measure attitudes towards statistics.
1
2. Method
This study is an attitude scale development work. But it was conducted with descriptive research model. Descriptive studies, research as well as events and research are used to determine the existing situation. In this type of research, survey research method is very widely used. In survey models, a past or present situation is aimed to be described in a way that exists and the research individual or object is tried to be identified in its own conditions and as it is (Karasar, 2008).
2.1. Participants
The study group involves total 240 students at a middle school in Trabzon province. The students are from 6th, 7th, and 8th grades and each grade includes 3 different classes. 130 (%54) of the students are girls and 110 (%46) of the students are boys. Guilford (1954) suggested that sample size should be at least 200 cases in factor analysis (MacCallum, Widaman, Zhang, & Hong, 1999; Arrindell & van der Ende, 1985).
2.2. Developing the Data Collection Tool
Studies on statistics education were scanned before the development of the scale for measuring attitude towards statistics of middle school students. The scales developed by researchers were examined. (Roberts & Saxe, 1982; Cruise, Cash & Bolton, 1985; Wise, 1985; Schau, Stevens, Dauphinee & Del Vecchio, 1995; Dauphinee, Schau & Stevens, 1997). Considering the language properties and cultural differences, some items were adjusted and used. On the other hand, some items were included in 32-item draft form which was prepared with the help of the results of the researcher’s interview with the teachers. During the preparation process of the items, the attainments from statistics subject in mathematics lesson at middle school were taken into account. 16 items in the draft form are positive and 16 items are negative. The positive or negative items are not placed in a sequential manner in order to prevent students from being influenced by their thoughts. At the very beginning of the scale, a directive related to the aim of the scale is stated.
The scale is 5 point Likert type. The items in the scale are “Strongly agree”-5, “Agree”-4, “Neither agree or disagree”-3, “Disagree”-2, “Strongly disagree”-1. Expert opinion was taken into account about the content validity. After necessary changes were made in accordance with the expert opinion, the pilot study was applied to define the construct validity and reliability.
2.3. Analysis
Factor analysis was made for the construct validity of the scale. Firstly, Kaiser-Meyer-Olkin (KMO) test was conducted to search for the appropriateness of the data for factor analysis. When the data was detected to be appropriate for factor analysis, the diagonal values of Anti-image Correlation Matrix were examined to determine Sampling Adequacy. Items with lower diagonal values than 0, 60 were omitted. Then, Barlett’s test was made to check whether the data from the population is from multivariate normal distribution. Exploratory factor analysis, which is a process to determine a factor depending on the relationships between the variants, was used to examine the construct validity of the scale (Büyüköztürk, 2009). In order to decide the number of important factors or constructs measured by the scale items, the line chart, which is created depending on factor eigenvalue, was examined. Principal component analysis, a method of extraction, was used. Varimax rotation was preferred to have the items match the most relevant factors and interpret the factors easily (Büyüköztürk, 2009). Cronbach alpha coefficient was calculated to determine the reliability of the scale. Split-half method was also used to search for the reliability. Corrected item-total correlation and t test were employed for item analysis. In the t test, the significance of the differences between the item means of the groups of upper %27 and lower %27 was examined. This method is one of methods for analyzing items (Büyüköztürk, 2006). In the data analysis, SPSS patch program was used.
3. Results
The findings of the study are classified in two parts. The first part contains the findings about the validity of the scale. The second part deals with the findings related to the reliability of the scale.
3.1. Findings on the Validity of the Scale for Attitude Towards Statistics
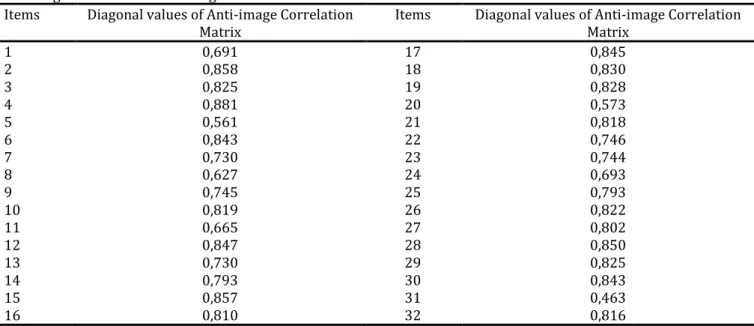
Factor analysis is a statistical method which is used to find few irrelevant and conceptually significant new variances by bringing moderately and closely related variants together (Balcı 2006; Büyüköztürk 2009). During the factor analysis, it is important that sampling size must provide correlation reliability. Kaiser-Meyer-Olkin (KMO) test is used to detect the adequacy of the data gained from sampling (Tavşancıl, 2006). KMO value more than 0, 60 shows that the data is appropriate for factor analysis (Büyüköztürk, 2009). Accordingly, before the data analysis in this study, KMO test was made to detect the adequacy of the data obtained from sampling. The detected KMO value for the scale in question was 0,796. The value was higher than 0, 60 and the data was deemed to be appropriate for factor analysis. Diagonal values of Anti-image Correlation Matrix display the sampling adequacy for a good factor analysis. For a sampling to be adequate, it is pointed out that the diagonal values of Anti-image Correlation Matrix must be 0,60 and more (Akgül & Çevik, 2003). The diagonal values of Anti-image Correlation Matrix that were calculated to examine the sampling adequacy in the study are shown in Table 1.
As it is shown in Table 1, the diagonal values of 5th (0,561), 20th (0,573), and 31st (0,463) the items are lower than 0,60 and these items were excluded from the scale. The calculated KMO value after these items were excluded was 0,823. According to Tavşancıl (2006), another point that must be taken into consideration during the factor analysis is normality. The distribution in the population must be normal in a factor analysis. Barlett’s test indicates whether the data is from multivariate normal distribution. So a high result of the Barlett’s test increases the possibility of significance (Tavşancıl, 2006). The Barlett’s test, which was applied to the data obtained in order to determine whether distribution in the population normal or not in the factor analysis, resulted as significant (Approx. Chi-Square = 1611, 401; p = 0,000). This result shows that data is consistent with the normal distribution. When the analysis repeated after the 5th, 20th and 31st items were omitted; the items of the scale are collected under four factors. It is known that the factor with high acceleration and sharp decreases in the eigenvalue factor line chart shows important number of factors (Büyüköztürk, 2009). On the other hand, the horizontal lines display that the contributions made by the extra variances are close to each other. When the line chart was examined depending on the data, it was seen that there were not decreases with high acceleration after the fourth factor and decided to continue the study with four factors. The line chart is shown in Figure 1.
Table1. . The Diagonal Values of Anti-image Correlation Matrix for the Items of the Scale for Attitude Towards Statistics Items Diagonal values of Anti-image Correlation
Matrix Items Diagonal values of Anti-image Correlation Matrix
1 0,691 17 0,845 2 0,858 18 0,830 3 0,825 19 0,828 4 0,881 20 0,573 5 0,561 21 0,818 6 0,843 22 0,746 7 0,730 23 0,744 8 0,627 24 0,693 9 0,745 25 0,793 10 0,819 26 0,822 11 0,665 27 0,802 12 0,847 28 0,850 13 0,730 29 0,825 14 0,793 30 0,843 15 0,857 31 0,463 16 0,810 32 0,816
Büyüköztürk (2009) points out that factor loading of 0,45 or higher is a good measure for choice in the factor analysis. However, it is stated that this basic value could be reduced to 0,30 for a less number of items. The highest values of items for each factor in a three-factor- scale vary between 0,611 and 0,332. Factor loading values obtained as a result of factor rotation are shown in Table 2.
Table2.
Factor Analysis Results of the Scale-Rotated Components Matrix
To include items in the scale depending on the values gained through analysis, it is suggested that an item has to possess at least 0,3 factor loading to be present in only one factor (Büyüköztürk, 2009). However, if an item has a high loading value with more than one factor it could be excluded from the scale. Also it is suggested that a multi-present item’s value in a factor should be higher at least 0,1 than its value in another factor. So in Table 2, 7th, 8th, 9th, 11th, 13th, 14th, 15th, 24th and 30th items with the difference lower than 0,10 between the highest loading value and the following highest loading value in factors were omitted from the scale and the analysis was repeated. After the removal of 11 items from the draft form, an ultimate scale with 20 items was formed. The results of factor analysis for this scale are shown in Table 3.
Factors
Items Factor 1 Factor 2 Factor 3 Factor 4
Item 1 0,107 -0,056 -0,027 0,359 Item 2 0,651 0,188 0,091 0,023 Item 3 0,042 0,754 0,047 -0,017 Item 4 0,548 0,133 0,292 0,205 Item 6 0,302 0,596 0,015 -0,071 Item 7 0,112 0,122 0,149 0,031 Item 8 -0,513 0,245 0,216 0,086 Item 9 0,189 0,018 0,021 0,202 Item 10 0,643 0,131 0,090 0,032 Item 11 -0,015 0,005 0,038 0,027 Item 12 0,551 0,378 0,220 -0,071 Item 13 0,117 0,033 0,150 0,252 Item 14 0,038 0,139 0,224 0,243 Item 15 0,248 0,175 0,231 0,231 Item 16 -0,033 -0,105 0,436 0,597 Item 17 0,345 0,079 0,597 0,033 Item 18 0,311 0,257 0,540 0,154 Item 19 -0,090 -0,009 0,672 0,227 Item 21 0,089 0,581 0,157 0,293 Item 22 0,250 0,464 0,362 0,020 Item 23 0,087 0,182 0,169 0,328 Item 24 -0,061 -0,070 0,022 0,184 Item 25 0,014 0,028 0,085 0,734 Item 26 0,055 0,128 0,059 0,615 Item 27 0,048 0,341 0,055 0,347 Item 28 0,362 0,197 0,463 -0,076 Item 29 0,096 0,370 0,508 0,110 Item 30 0,385 0,418 0,150 0,092 Item 32 0,651 0,188 0,091 0,023
Table3.
Common Variance and Loading Values After Rotation of Scale Items
Items Common
Variance Loading values after rotation
Factor 1 Factor 2 Factor 3 Factor 4 4 People see many different uses of statistics
on newspapers, TVs and internet. 0,411 0,563 9 I am aware that statistics is used in
medicine. 0,518 0,693
10 Many problems could be solved easily by
using statistics. 0,508 0,570
18 I can understand almost all statistical terms that I see in newspapers, magazines and on TV, internet.
0,512 0,628
1 I don’t use statistics in my daily life. 0,468 0,332 8 Understanding the statistics doesn’t
provide benefits for customers. 0,628 0,746 11 Knowing statistics is nothing to the
politicians. 0,453 0,537
14 Statistics is not beneficent for every job. 0,505 0,505 15 Statistical thinking is applicable except for
work life. 0,753 0,753
16 Statistics has nothing to do with my life. 0,645 0,645 19 It is necessary to know a little about
statistics to be conscious customer. 0,573 0,326 2 I can interpret the graphics in newspapers
and magazines. 0,452 0,596
5 Tables in newspapers appeal my attention because I know very well how to interpret them
0,529 0,642
6 I don’t have difficulty in understating the
presented statistics during the elections. 0,564 0,647 7 I didn’t have difficulty in understanding the
statistics shown on TV during the latest elections.
0,626 0,490
20 I know what average fuel consumption for
cars means. 0,482 0,342
3 I enjoy studying statistics. 0,586 0,666
12 Statistics could be necessary as a part of my
job in the future. 0,476 0,392
13 Statistical skills make me more supported 0,672 0,594
17 Most people have to learn statistics as a
new way of thinking. 0,537 0,519
Explained variance
Total : %44,465 Factor 1:%13,412 Factor 2:%12,312 Factor 3:%10,122 Factor 4:%8,619
A high-level of common variance that important factors explain with any item is the third criterion that is usually regarded for the removal of items that don’t measure the same construct in the factor analysis. Having the common factor variances near 1,00 or more than 0,66 is a good formula but it is difficult to meet this in application. It must be kept in mind that high factor variance increases the total variance explained (Büyüköztürk, 2009). The ultimate scale consists of 14 positive and 6 negative, in total 20, items.
3.2. Findings on the Reliability of the Scale for Attitude Towards Statistics
In the reliability studies for the scale, firstly, item analysis was made to examine whether the scale items are related or not to the concept that is tried to be measured. The corrected item total point correlation, which is an item analysis method, was used. As it is figured out in Table 4, the analysis shows that the corrected item-total point correlation values vary between 0,24 (item 5) and 0,71 (item 1). Büyüköztürk (2009) points out that items with 0,30 or more item total correlation are good to differentiate among the individuals but items with values between 0,20 and 0,30 could only be included in the test depending on the obligation or they must be corrected. The results of item analysis for the scale displayed that 1st item had the lowest item total correlation (0,274). 1st item was decided to be included in the test after correction and it was not excluded from the scale.
The values gained from the t test, which was made to examine the significance of the differences between the item means of the groups with upper %27 and lower %27, are also shown in Table 4.
Table 4.
The Results of Item Analysis
Items correlation Item total (lower- t
upper%27) items Item total correlation t (lower- upper%27) Item 1 0,274 2,746 Item 11 0,472 6,974 Item 2 0,630 8,467 Item 12 0,646 9,925 Item 3 0,513 7,409 Item 13 0,636 9,868 Item 4 0,645 9,727 Item 14 0,472 6,579 Item 5 0,525 7,658 Item 15 0,470 6,637 Item 6 0,547 7,409 Item 16 0,464 7,157 Item 7 0,661 10,702 Item 17 0,386 5,649 Item 8 0,499 7,726 Item 18 0,652 8,792 Item 9 0,605 9,123 Item 19 0,702 10,281 Item 10 0,732 10,998 Item 20 0,433 6,129
Cronbach Alpha reliability coefficient was calculated to find out about the reliability of the scale and it was found as 0,815. In addition to Cronbach Alpha value, reliability was also checked by using Split-half method. In this method, reliability analysis is made by dividing the scale into two groups. The Alpha value for the first group was found as 0,721 and for the second group it was 0,664. Depending on these values, it was seen that reliability of the groups was close to each other and quite high for both groups. The relationship between the two groups is in positive direction and linear in the mid-level (r=0,663). In the reliability analysis, Guttman Split Half (0,797), (Equal-length Spearman-Brown =0,797) and (Unequal-length Spearman-Brown=0,797) coefficients were also examined. When the values obtained are taken into consideration, it can be said that the reliability of the scale, developed in order to determine the attitudes of middle school students towards statistics has a high level of reliability.
4. Discussion and Conclusion
In this study, it was aimed to develop a scale that could be used by teachers and researchers in determining attitude towards statistics of students at a middle school. Depending on the analysis made, a four-factor scale was produced. Following the factor rotation, it was observed that first factor had 4 items, second factor had 7 items, third factor had 5 items and fourth factor had 4 items. Of the factors determined, the first one explains %13,412, the second one explains %12,312, the third one %10,122 and the fourth one explains %8,619 of the Total Variance Explained. Sum of variance of these four factors explains the %44, 465 of the Total Variance. A high proportion of variance gained at the end of the analysis means a powerful factor-construct (Tavşancıl, 2006) However, variance proportions between %40 and %60 are accepted to be enough in the analyses made in social sciences (Scherer, Wieb, Luther and Adams, 1988).
Table 5.
Identify of the Factors Lower
dimensions Definition Sample item Related items
1.Awareness Awareness as to the use
statistics People see many different uses of statistics on newspapers, TVs and internet. 4, 9, 10, 18 2.Valuing Negative opinions about
statistics I don’t use statistics in my daily life 1, 8, 11, 14, 15, 16, 19 3.Confidence Self-confidence in
understanding and interpreting statistical information
I can interpret the graphics I see in
newspapers and magazines 2, 5, 6, 7, 20
4.Necessity Necessity for being statistically
literate Most people learn statistics as a new way of thinking 3, 12, 13, 17 These four factors can be named respectively as “awareness”, “valuing”, “self-confidence in understanding and interpreting statistical information” and “necessity”. Cognitive, emotional and behavioral elements of attitude taken into account; knowledge and beliefs, excitement and observable behaviors reveals the structure of the attitude (Demirci, 2006). All of the cognition of an individual reflects the belief. Therefore scale can be considered as a whole (Tavşancıl, 2002). In this case, it can said factor 2 and factor 4 reveal attitudes, factor 3 reveals feelings, factor 1 reveals behavior. This shows us that the scale is structurally consistent. Loading values of the items after rotation vary between 0,326 and 0,753. Reliability for the developed scale was found as 0,815. The results indicate that the developed scale is reliable.
Over the last 20 years, there has been raising attention given to the teaching and learning in statistics education (Garfield & Ben-Zvi, 2007). As it is in other countries, studies for the revision of education programs started in our country in 2004. Statistics learning domain is placed in a comprehensive and gradual way at middle school in the renewed education program (Milli Eğitim Bakanlığı, 2013). Also there are studies to include statistical attainments in the middle school programs, which imply that more importance is attributed to statistical education in accordance with the necessities of our era. Realization of the significance of statistics for daily life and the relationship between statistical information and statistical literacy make statistics a focus point for education programs and program developers. The attitude scale towards statistics developed in this study is thought to be used by teachers of middle school and researchers interested in the topic. During the instruction process, it could be useful to measure attitude towards statistics of students in statistical subjects and functionalize and interpret the data gained. Defining attitudes towards statistics of the students and planning the instruction process to improve their statistical literacy in a positive direction will contribute to increase the students’ success in maths.
Widespread use of such scales is also of great significance to illustrate the differences as to the attitudes towards statistics of the students before and after the applications in which new learning approaches are employed
References
Akgül, A. & Çevik, O. (2003). İstatistiksel analiz teknikleri: SPSS’te işletme yönetimi uygulamaları. Ankara. Emek Ofset.
Arrindell, W. A., & van der Ende. J. (1985). An empirical test of the utility of the observations-to-variables ratio in factor and components analysis. Applied Psychological Measurement, 9, 165 - 178.
Balcı, A. (2006). Sosyal bilimlerde araştırma yöntem, teknik ve ilkeler (6.Baskı). Ankara. Pegem Akademi Yayıncılık. Baloğlu, M. (2002). Psychometric properties of the statistics anxiety rating scale. Psychological Reports, 90, 315-325. Büyüköztürk, S. (2006). Sosyal bilimler için veri analizi el kitabı. Ankara: Pegem Akademi Yayıncılık.
Büyüköztürk, Ş. (2009). Sosyal bilimler için veri analizi el kitabı (8. Baskı). Ankara: Pegem Akademi Yayıncılık. Cruise, J. R., Cash, R. W., & Bolton, L. D. (1985). “Development and validation of an instrument to measure statistical
anxiety,” in American Statistical Association Proceedings of the Section on Statistical Education, 92-98.
Dauphinee, T. L., Schau, C., & Stevens, J. J. (1997). Survey of attitudes toward statistics: Factor structure and factorial invariance for females and males. Structural Equation Modeling, 4, 129–141.
Demirci, H. G. (2006). Ticaret meslek ve Anadolu ticaret meslek liseleri bilgisayar programcılığı bölümü öğrencilerinin internete yönelik tutumları ile “internet ve ağ sistemleri” dersindeki akademik başarıları arasındaki ilişki. Yayınlanmamış Yüksek Lisans Tezi, Çukurova Üniversitesi, Adana.
Doğan, N. & Başokçu, T. O. (2010). İstatistik tutum ölçeği için uygulanan faktör analizi ve aşamalı kümeleme analizi sonuçlarının karşılaştırılması. Eğitimde ve Psikolojide Ölçme ve Değerlendirme Dergisi. 1(2), 65-71.
Gal, I., Ginsburg, L., & Schau, C. (1997). "Monitoring attitudes and beliefs in statistics education," in The assessment challenge in statistics education, Eds. I. Gal, and J. B. Garfield, Netherlands: IOS Press, 37-51.
Gal, I. (2002). Adult statistical literacy: Meanings, components, responsibilities. International Statistical Review, 70(1), 1-25.
Garfield, J. & Ben-Zvi, D. (2007). How students learn statistics revisited: A current review of research on teaching and learning statistics. International Statistical Review, 75, 372-396.
Karasar, N. (2008). Bilimsel araştırma yöntemi (18. Baskı). Ankara: Nobel Yayın Dağıtım.
Koparan. T. (2015). Difficulties in learning and teaching statistics: Teacher views. International Journal of Mathematical Education in Science and Technology, 46(1), 94-104.
Koparan. T. & Güven. B. (2014). According to the M3ST model analyze of the statistical thinking levels of middle school students. Education and Science, 39, 171, 37–51.
MacCallum, R. C., Widaman, K. F., Zhang, S., & Hong S. (1999). Sample size in factor analysis. Psychological Methods, 4, 84-99.
Milli Eğitim Bakanlığı (2013). Ortaokul matematik dersi (5, 6, 7 ve 8. sınıflar) öğretim programı ve ortaöğretim matematik dersi (9, 10, 11 ve 12. sınıflar) öğretim programı. http://ttkb.meb.gov.tr/www/guncellenen-ogretim-programlari/icerik/151 adresinden elde edildi.
Reid, N. (2006). Thoughts on attitude measurement. Research in Science & Technological Education. 24(1), 3–27. Roberts, D.M., & Saxe, J.E. (1982). Validity of a statistics attitude survey: A follow-up study. Educational and
Psychological Measurement, 42, 907-912.
Schau, C., Stevens, J., Dauphinee, T. L., & Del Vecchio, A. (1995). The development and validation of the survey of attitudes toward statistics. Educational and Psychological Measurement, 55, 868-875.
Scherer, Robert F., Wiebe, F. A., Luther, D. C., ve Adams J. S. (1988). Dimensiona-lity of coping: Factor stability using the ways of coping questionnaire. Psycho-logical Reports, 62, 763-770.
Tavşancıl, E. (2006). Tutumların ölçülmesi ve SPSS ile veri analizi, Ankara: Nobel Yayın Dağıtım.
Wallman, K. K. (1993). Enhancing statistical literacy: Enriching our society. Journal of the American Statistical Association, 88, 1-8.
Watson J. M. (2006). Statistical literacy at school, growth and goal. Mahwah, NJ: Lawrence Erlbaum Associates, Publishers. Londan.
Watson, J , & Callingham, R (2003). Statistical literacy: A complex hierarchical construct. Statistics Education Research Journal, 2, 3-46.
Waters, L. K., Martelli, T. A., Zakrajsek, T., & Popovich, P. M. (1998). Attitudes toward statistics: An evaluation of multiple measures. Educational and Psychological Measurement, 48, 513-516.
Wise, S. L. (1985). The Development and validation of a scale measuring attitudes towards statistics. Educational and Psychological Measurement, 45, 401-405.
Yaşar, M. (2014). İstatistiğe yönelik tutum ölçeği: Geçerlilik ve güvenirlik çalışması. Pamukkale Üniversitesi Eğitim Fakültesi, 36, 59-75.