PAPER
Cite this: CrystEngComm, 2016, 18, 6341
Received 29th March 2016, Accepted 4th July 2016 DOI: 10.1039/c6ce00693k www.rsc.org/crystengcomm
Grain boundary engineering in electrospun ZnO
nanostructures as promising photocatalysts
†
Anitha Senthamizhan,*
aBrabu Balusamy,*
aZeynep Aytac
aband Tamer Uyar*
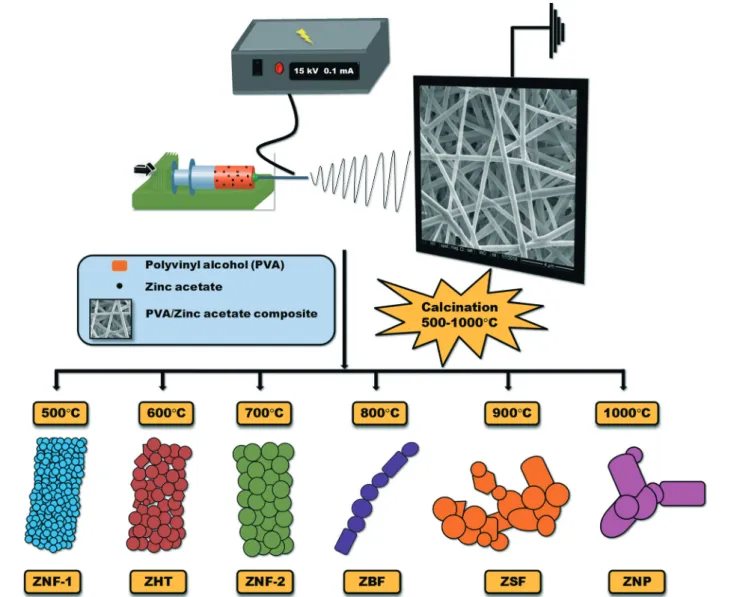
abElectrospun ZnO nanofibers (ZNF) have received increased attention as photocatalysts owing to their po-tential for incredible performance. However, uncertainty still exists in determining the correlation be-tween grain boundaries (GBs) and photocatalytic activity. Therefore, effective thought has been put into engineering the GBs to convert ZNF into a promising photocatalyst. Herein, the obtained electrospun ZnO structures are composed of nanograins, which are connected to each other in an ordered manner. In-depth studies have revealed that the growth of nanograins severely altered the morphology of ZNF and GB areas at higher annealing temperatures ranging from 500°C to 1000 °C. Based on the morphologi-cal features and their structural evolution, the obtained structures are named as ZnO nanofibers-1 (ZNF-1, 500°C), ZnO hollow tubes (ZHT, 600 °C), ZnO nanofibers-2 (ZNF-2, 700 °C), ZnO bamboo structured fibers (ZBF, 800 °C), ZnO segmented fibers (ZSF, 900 °C) and ZnO nanoparticles (ZNP, 1000 °C). A strong correlation between the inherent emission features of ZNF and their peak positions have been detected with the GB. The comparative degradation efficiency of methylene blue (MB) has been studied and the results showed that the ZNF-1 with highly stacked nanograins containing rich grain boundaries demonstrated∼6 times higher efficiency than other structures. In addition, it has been shown to have a strong effect towards the degradation of Rhodamine B (Rh B) and 4-nitro-phenol (4-NP). A critical pa-rameter for improving the photocatalytic activity is found to be the GB mediated defects, which are proposed to be oxygen/zinc vacancies at nanograin fusion interfaces, while supposedly maintaining its fi-brous structure, wherein no relationship has been drawn implying the direct domination of morphology, surface area and defect.
Introduction
Incredible regard has been drawn towards electrospun zinc oxide nanofibers (ZNF) owing to their functional diversity, which has been proven to be an efficient photocatalyst for the effective degradation of organic pollutants in water.1–5 This has been attributed not only to their low cost, but also it is listed as a generally regarded as a safe (GRAS) material for hu-man beings by the Food and Drug Administration (21 CFR 182.8991). Existing reports have already shown that ZNF are polycrystalline, composed of numerous single crystalline grains.6,7 For example, Ren et al. prepared large-pore meso-porous ZnO nanofibers using a foaming-assisted
electro-spinning approach and demonstrated their enhanced photo-catalytic performance compared to conventional solid nanofibers.4 Sufficient evidence makes it notable here that the grain size properties and their consequent orientation are proven to have a strong impact on the functional properties of nanofibers.8,9 In the past few years, intensive research to evaluate the growth of grains and their functionalities has been observed. Surface controlled reactions are expected to play a vital role in sensors and catalyst applications that largely accept electrospun nanofibers.10–15 Important factors, including grain boundaries (GB) and their domain character-istics, have still been unable to comprehend their value and importance in photocatalytic activity (PCA).16,17Therefore, un-derstanding the GB mediated ZNF characteristics will pave us a path to attain a higher performance of PCA.
It is important to recall at this point that the ZNF are gen-erally obtained by calcination of the composite fibers in which the temperature has a strong impact on determining the structure, which is impelling to comprehend the growth processes of the nanograins to attain a perfect stand on the functional performance.18 In depth reports have been pro-vided on the growth of nanograins at higher calcination
aUNAM-National Nanotechnology Research Center, Bilkent University, Ankara,
06800, Turkey. E-mail: [email protected],
[email protected], [email protected]
bInstitute of Materials Science & Nanotechnology, Bilkent University, Ankara,
06800, Turkey
† Electronic supplementary information (ESI) available: SEM image of as-electrospun PVA/zinc acetate composite nanofibers, average grain size measure-ment, XPS spectra of Zn 2p and photocatalytic recycling performance of ZNF-2. See DOI: 10.1039/c6ce00693k
Published on 04 July 2016. Downloaded by Bilkent University on 12/1/2018 4:22:53 PM.
View Article Online
temperatures and longer calcination times.19–23 In another study, Liu et al. showed that the electrospun La2Mo2O9
nano-wires with a bamboo-wire microstructure exhibited giant ionic conductivity of 0.20 Scm−1.23A recent study was con-cluded on the amount of grain boundaries inα-Fe2O3
struc-tures prepared via electrospinning for gas sensing properties of ethanol.24 Investigation by Katoch et al. determined the crystallinity effect of ZNF treated at different temperatures and suggested the concurrent optimization of size and crys-tallinity of grains as vital parameters to maximize the sensing abilities of oxide nanofibers.7
Summarizing all the abovementioned factors, electrospun based nanostructures prepared at different temperatures displayed improved performances in various applications with respect to their morphology, size, crystallinity and other parameters. This implies that the structure type is crucial de-pendent upon the application and not a definite structure that improves the overall performance. Among the most sig-nificant factors affecting the photocatalytic performance, morphology and surface area are considered to be the pri-mary factors.25–30 However, factors affecting the stacking be-haviours of adjacent nanograins and GB have been left unnoticed.16,17,31 In most of the cases, the existence of de-fects at the GBs and their correlation is not well known. For defects, such as interstitials and vacancies, the GBs act as ef-ficient sinks.32–35Therefore, the necessity to study the inter-play between defects and GBs in-depth, and further how these correlate with the functionality of the system. This plays a crucial role in determining the controllable parame-ters of luminescent features and further enhancing the degra-dation of dye pollutant in water.
The main goal of this study is to highlight the tempera-ture induced structural evolution of ZNF and how the growth of grains and GBs affect their performance towards photo-degradation of dyes. From these results, one might be able to clearly perceive and develop ZNF with controlled properties through GB engineering. An important consideration to be made here is the non-correlation effects from surface area and defect related emissions on the photocatalytic perfor-mance. In contrary, efforts have been made to apprehend the effect of GBs, their arrangement and their correlation in photoluminescence properties. Due to the grain surfaces be-ing defect rich, we strongly believe that engineerbe-ing the grain surface provides a scope to improve PCA performance. The present research dictates the analysis of the structural evolu-tion of ZnO nanofibers under temperatures ranging from 500 °C to 1000 °C, prepared by an efficient and cost effective method called, electrospinning. Apart from the attained mor-phologies of electrospun ZnO, the luminescence of ZnO is also severely affected by GBs. Extensive studies have been car-ried out to understand the effect of GB on the degradation ef-ficiency of dye pollutants, in addition to its features, includ-ing morphology, high surface area and defects. Surprisinclud-ingly, superior performance is shown by firmly stacked nanofibers for the efficient degradation of methylene blue (MB) com-pared to nanofibers and hollow tubes.
Experimental section
MaterialsPolyvinyl alcohol (PVA, Mw: 125 000, Scientific Polymer), zinc acetate dihydrate (Sigma-Aldrich) and methylene blue (MB, Sigma-Aldrich), Rhodamine B (Rh B, Sigma-Aldrich), and 4-nitro-phenol (4-NP, Alfa Aesar) were procured.
Electrospinning
The electrospinning solution was prepared by dissolving poly-vinyl alcohol (PVA, 7.5% w/v) in water at 80 °C followed by addition of zinc acetate dihydrate (4%, w/v). The resulting so-lution was stirred for 2 hours to obtain a homogeneous solu-tion. Furthermore, the solution was loaded in a 3 mL plastic syringe with needle diameter of 0.8 mm and placed horizon-tally on a syringe pump (KD Scientific, KDS101). The flow rate of the polymer solution was controlled by the syringe pump and fixed at 1 mL h−1. The grounded metal collector was covered with aluminium foil and placed at a distance of 17 cm from the needle tip. The electric field (15.5 kV) was ap-plied from a high voltage power supply (Spellman, SL series, USA). Electrospinning procedure was carried out at 22°C and 19% relative humidity in a Plexiglas box. The obtained zinc acetate/PVA composite nanofibers were further calcined at 500°C, 600 °C, 700 °C, 800 °C, 900 °C and 1000 °C separately for 3 h in air.
Characterization
The morphological and elemental composition analysis were performed using field emission scanning electron microscopy (FESEM, Quanta 200 FEG) equipped with an energy-dispersive X-ray spectrometer (EDS). The crystal structures of the annealed ZnO samples were measured by a PANalytical X'Pert multipurpose X-ray diffractometer with Cu Kα radia-tion at 2θ angle ranging from 20° to 65°. X-ray photoelectron spectroscopy (XPS, Thermo K-alpha-monochromated) was employed to analyze the surface chemical composition. Photoluminescence (PL) measurements were performed by using a time-resolved fluorescence spectrophotometer (FL-1057 TCSPC). The absorbance spectra of organic pollutants were obtained using a UV-vis Spectrophotometer (Varian Cary 100). The Brunauer, Emmett and Teller (BET) surface area an-alyzer (Micromeritics TriStar 3000) was used to measure the surface area of ZNF-1, ZNF-2 and ZNP. The data collected at 77 K were in the range of 0.1–0.9 relative pressure.
Photocatalytic performance
The catalytic performance of electrospun ZnO structures was evaluated by measuring the degradation of methylene blue (MB) dye under UV irradiation (Ultra-Vitalux Ultraviolet high-pressure lamp (300 W, Osram, sunlight simulation)) at room temperature. Typically, 1 mg mL−1of electrospun ZnO struc-tures was placed into quartz cuvettes containing MB dye solu-tion (5 ppm) separately, and then placed in the dark for 30 minutes to establish absorption/desorption equilibrium of
dye on the sample surface prior to irradiation. The samples were placed at a working distance of 15 cm from the lamp. A series of samples and controls (without catalyst) were simul-taneously irradiated. The degradation of MB dye was moni-tored by measuring their absorbance as a function of irradia-tion time at predetermined time intervals using a UV-vis spectrophotometer. The reusability of the sample was performed during five consecutive cycles. The degradation ef-ficiency of MB dye was calculated by ((C0 − C)/C0) × 100,
where C and C0indicates the absorption peak intensities
be-fore and after UV irradiation. The same procedure has been followed for Rh B (5 ppm) and 4-NP (5 ppm).
Results and discussion
Fig. 1 represents the schematic of the procedure for prepar-ing various electrospun ZnO structures through a combina-tion of electrospinning and heat treatment approaches. The
SEM image of as-electrospun PVA/zinc acetate composite nanofibers clearly show the bead free and smooth fibrous na-ture with an average fiber diameter of 355 ± 85 nm as illus-trated in Fig. S1.† Furthermore, the as-prepared composite fi-bers are subjected to thermal treatment (calcination) for obtaining ZNF from the total degradation of the polymer ma-trix. The high priority has been given to the effect of tempera-ture, heating rate, time and environment during this period, in attaining the optimal structure and desired properties of ZnO. Our present study investigates the structural variation of electrospun ZnO nanostructures that are exposed to calci-nation at different temperatures ranging from 500°C to 1000 °C for a period of 3 h. Clear indications can be sought out from the representative SEM images exhibiting the entire fea-ture and its associated morphological variations, as illus-trated in Fig. 2. Post process of calcinations, the fibrous sur-face is shown to turn rough, as compared to as-electrospun PVA/zinc acetate composite nanofibers. In short, it is
Fig. 1 Schematic of the procedure for preparing various electrospun ZnO structures through the combination of electrospinning and heat treatment approaches. The obtained structures are named as ZnO nanofiber-1 (ZNF-1), ZnO hollow tube (ZHT), ZnO nanofiber-2 (ZNF-2), ZnO bamboo structured fiber (ZBF), ZnO segmented fiber (ZSF) and ZnO nanoparticles (ZNP).
apparent that the composition of the nanofibers is mainly made up of ZnO nanograins, which further deters the fibrous morphology on increasing the temperature.
At 500°C, the nanofiber (diameter of 180 ± 50 nm) reveals the packing of dense small grains of size 35 ± 10 nm, as shown in Fig. 2a-a1. It is found that the grains are bound to
each other throughout the fiber and exhibit solid morphol-ogy. Fig. 2b-b1 demonstrates the sample obtained at 600°C,
which is found to be cylindrically connected and displaying a hollow tube morphology. Fig. 3 evidently proves the existence of the solid and hollow nature of electrospun ZnO nanofibers calcined at 500°C and 600 °C, respectively. The marked por-tion in the images clearly illustrates the solid and hollow na-ture of the obtained electrospun ZnO nanofibers. The cross
Fig. 2 Morphology evaluation of electrospun ZnO nanostructures at various calcination temperatures. (a–f and a1–f1) representative SEM images
of electrospun ZnO nanostructures. (a and a1) 500°C, the attained morphology is denoted as ZnO nanofiber-1 [ZNF-1]; (b and b1) 600°C, ZnO
hollow tube [ZHT]; (c and c1) 700°C, ZnO nanofiber-2 [ZNF-2]; (d and d1) 800°C, ZnO bamboo structured fiber [ZBF]; (e and e1) 900°C, ZnO
seg-mented fiber [ZSF]; (f and f1) 1000°C, ZnO nanoparticles [ZNP] and their corresponding EDX mapping [Zn (a2–f2) and O (a3–f3)] and, representative
TEM images (a4–f4) and HR-TEM images (a5–f5).
Fig. 3 Comparative SEM images of (a) ZNF-1 and (b) ZHT. The marked portion in the images clearly illustrates the solid and hollow nature of obtained electrospun ZnO nanofibers.
sectional view represents that the nanograins are tightly packed in ZNF-1 along the fibers, whereas ZHT possesses dis-tinctly packed nanograins, which creates a hollow tube mor-phology as observed.
A detailed analysis on the image of the single hollow tube implies an increase in the grain size (60 ± 10 nm), with well-defined gaps between the nanograins and as a result the di-ameter is increased to 200 ± 50 nm. In addition, an increase in the temperature to 700°C causes shrinkage in the fiber di-ameter, measuring 130 ± 30 nm, as illustrated in Fig. 2c-c1.
Moreover, the composition of the fibers comprising larger nanograins (120 ± 40 nm) is due to significant growth and co-alescence of the grains. A worthy mention has to be made here that the annealing temperature has a severe effect on the distribution of grains in a consistent manner. Evidence proves that the fibrous morphology of the grown nanograins are bounded very tightly to each other and make up a solid fi-ber appearance.
Upon calcination at 800°C, the fibers exist as a bamboo-like network structure by arranging themselves as single chain nanograins of size 180 ± 80 nm, as depicted in Fig. 2d-d1. It is found that the grains are well grown at this
temperature and a clear change in the morphology is ob-served. Severe breakage of the fibers is noticed, with every short segment composed of tightly packed particles upon cal-cination at 900°C, each with a grain size of 300 ± 110 nm, as illustrated in Fig. 2e-e1. The agglomeration of ZnO
nano-grains with complete destruction of the fibrous structures were noted following a thermal treatment at 1000 °C as clearly demonstrated in Fig. 2f-f1. Based on the
morphologi-cal features and their structural evolution upon morphologi-calcination (500 °C to 1000 °C), the obtained structures are named as ZnO nanofibers-1 (ZNF-1, 500 °C), ZnO hollow tubes (ZHT, 600 °C), ZnO nanofibers-2 (ZNF-2, 700 °C), ZnO bamboo structured fibers (ZBF, 800 °C), ZnO segmented fibers (ZSF, 900°C) and ZnO nanoparticles (ZNP, 1000 °C). The measured mean grain diameters are plotted against the annealing tem-perature shown in Fig. S2.†
Further elemental mapping has been performed to evalu-ate the presence of zinc (Zn) and oxygen (O). The observed re-sults clearly show the homogeneous distribution of both Zn and O throughout structures, as shown in Fig. 2a2–
f2 (Zn) and a3–f3 (O). The observed structural variation were
further investigated using TEM, which is presented in Fig. 2a4–f4, highlighting the coincidence of change in
mor-phology of the fibers with SEM results. The HR-TEM Fig. 2a5–
f5 represents the lattice spacing of ZnO nanograins and the
corresponding results suggest that they are polycrystalline. The lattice spacing of two consecutive planes are measured to be 0.26 nm, 0.58 nm, 0.52 nm, 0.24 nm, 0.28 nm and 0.58 nm for ZNF-1, ZHT, ZNF-2, ZBF, ZSF and ZNP, respectively (Fig. 2a5–f5).
The BET specific surface area of ZNF-1, ZNF-2 and ZNP were measured to be 6.44 m2 g−1, 5.07 m2 g−1 and 1.61 m2g−1, respectively. The results have shown that the surface area of electrospun ZnO structures are decreased upon
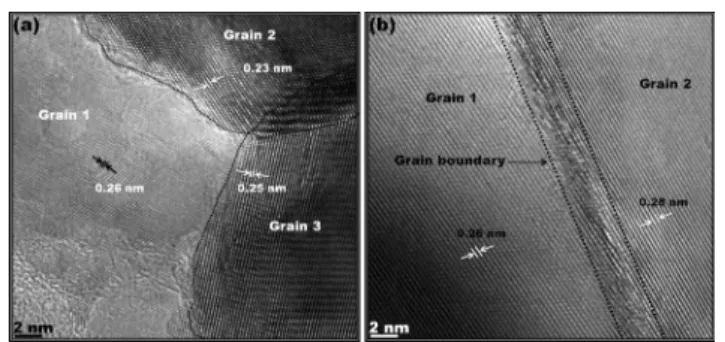
in-creasing the calcination temperatures. The higher surface area observed in ZNF-1 compared to ZNF-2 might be due to the smaller particle size and voids amongst the nanograins. A clear indication is shown by the HR-TEM image of ZNF-1 about the existence of well grown nanograins with an intense population that are found to be robustly overlapped along the fibers, as shown in Fig. 4a. Contrary to this, the size of the ZHT grains that are found to be smaller in size, less pop-ulated and incoherently arranged. Importantly, it is found that the grains exhibit strong crystallinity, as they most likely exist singularly, with considerable distance between each other. Moreover, it is noticed that there is no definite GB due to their arrangement characteristics. Therefore, this is found to have an impact on the grain connectivity of ZNF-1 from the other two structures, as they have a more compact struc-ture. ZBF grains are pragmatically found in random shapes and sizes, tightly bonded to each other without secondary particle arrangement. The appropriate formation of GB in ZNF-2 is clearly shown in Fig. 4b. These obvious variations in the GBs infer the difference in the luminance characteristics as well.
XRD analysis gives us inputs on the formation of ZnO and their crystalline nature. As shown in Fig. 5, the peaks in the diffraction patterns are indexed to (100), (002), (101), (102), (110) and (103) planes of ZnO highlighting their Wurtzite hexagonal crystal structure (JCPDS No. 36-1451). Conspicu-ously, no evident peaks of polyvinyl alcohol (PVA) or any other impurities have been observed emphasizing the com-plete removal of the polymer and the simultaneous decompo-sition and formation of zinc acetate into pure ZnO.36On in-creasing the temperature, we noticed a higher intensity and sharpness in the diffraction peaks suggesting an increase in the grain size and crystal quality improvement.
Detailed information on surface composition and the oxi-dation states of electrospun ZnO nanostructures calcined at different temperatures have been obtained from XPS analysis. As illustrated in the Fig. 6, the high resolution scan of O 1s profile can be composed of multiple peaks and fitted as three peaks with the Gaussian function, denoting the existence of three different O species named lattice oxygen (OL), oxygen
vacancies (OV) and chemisorbed oxygen species (OCh). The
peak at 530.1 ± 0.2 eV in all samples is attributed to O2−ions in a Wurtzite structure composed of a hexagonal Zn2+ ion
Fig. 4 HRTEM images of grains in (a) ZNF-1 and (b) ZNF-2. The typical grain boundary is marked in ZNF-2.
array, which are surrounded by zinc atoms with the full sup-plement of nearest-neighbour O2− ions. They are generally known as lattice oxygen (OL) and their percentage represents
the relative amount of the O at the ideal lattice positions. The centred peak located at 531 ± 0.1 eV is attributed to the O2−ions in the oxygen deficient regions within the matrix of ZnO. The third peak around 532.1 ± 0.2 eV is typically as-cribed to OH−groups, chemisorbed oxygen or dissociated ox-ygen on the surface of the ZnO.37,38
The observed variations in the intensity of the peaks might be connected to the concentration of oxygen vacancies. The calculated relative percentage of OL, OChand OVfor all
samples are noted in their corresponding Figures. The highest intensity of OL as compared with OCh and OV
indi-cates the strong Zn–O bonding in the prepared samples. The gradual increases in OVis noted for all samples except ZBF,
which might be due to the reduced amount of GB. It is real-ized that the peak OChthat is related to the chemisorbed
oxy-gen, cannot be removed even at higher temperatures. The es-timated relative percentage of oxygen vacancies (OV)
following the trend as ZNP> ZSF > ZNF-2 > ZHT > ZNF-1 > ZBF. The intense characteristic peaks observed at 1021.5 ± 0.3 eV and 1044.6 ± 0.2 eV in XPS spectra of Zn 2p are assigned to Zn 2p3/2and Zn 2p1/2, respectively (Fig. S3†). The
spin–orbit splitting of ∼23 eV between two core level compo-nents of Zn 2p3/2and Zn 2p1/2are in good agreement with
the reported literature values.39The GBs are considered to be an obvious sink for defects and facilitates more chemisorp-tion for oxygen-related species, as discussed in the previous section. This is the reason why we have observed a higher percentage of OCh in ZNF-2 as compared with ZNF-1 and
ZHT. This would be more advantageous in enhancing dye degradation processes because the presence of hydroxyl groups can effectively facilitate the trapping of photo-induced electrons and holes.37If the performances are strongly corre-lated with oxygen vacancies, then there would be a higher degradation rate in defect rich samples. We will observe in future sections, whether these results follow the same trend for enhancing the PCA or not.
Fig. 7 showcases the photoluminescence spectra of ZnO nanostructures at different temperatures. Deconvolution of the spectra shows a strong influence of photoluminescence for ZnO by their grain arrangements and the presence of GBs. The presence of defects has confirmed the broad range of defect emissions. Evidence has already proved the correla-tion of defects and their posicorrela-tion in ZnO, including oxygen vacancies (VO), zinc vacancies (VZn), zinc interstitials (IZn) to
the preparation methods, annealing temperature, and other conditions.38–40 However, information on the exact defect centres and the electron transition pathways are still un-known. The dominant peak in the UV range called near band edge emission (NBE) is related to the direct recombination of photo generated carriers, denoted as P1. Illustration proves
the occurrence of a slight shift in the NBE spectra of all other samples to longer wavelength as compared with the ZNF-1 due to the increase in the grain size. Apart from this, an obvi-ous change in the peak intensity can be noticed among the spectra. Numerous studies have illustrated that the con-trolled density of the defects and their position is important for efficient photocatalysis.37,38,41–45
From the conducted experiment, we have clearly observed that Zn and VO showcase dominant defects in the prepared
electrospun ZnO nanofibers, apparently visible at the GB re-gions. On performing a comparative analysis with ZNF-1, it is observed that the intensity of defect level emissions (DLE) gradually decreases emphasizing the well separated and crys-tallized nature of the formed grains, thereby significantly re-ducing their defect related emission in ZHT. In addition, it is also noticed that the intensity of DLE in ZBF is significantly higher than that of either ZNF-1 or ZNF-2. Thus, this analysis implies that with an increase in the density of the GB, the de-fect concentration increases. Theory also suggests that for the stability of defects at the GB regions.46Therefore, the suc-cessful combination of both structural changes and
Fig. 5 XRD spectra of electrospun ZnO nanostructures calcined at various temperatures over a range from 500 °C to 1000 °C for (a) ZNF-1 (b) ZHT (c) ZNF-2 (d) ZBF (e) ZSF and (f) ZNP.
luminescent properties leads to developing interesting facts on the GB engineering in electrospun ZnO nanostructures.
The violet (P2) and blue (P3) emissions are attributed to
the transition from IZn(IZn→ VB) and extended IZnstates
(ex-IZn → VZn) to the valance band, respectively.47–49 Another
dominant peak existing in all the samples is related to the green emission comprising two components (V*O → VB [P4],
and CB→ VO++[P5]). All these cases show competency in the
peak intensity of V*O → VB with ex-IZn → VZn. However, the
peak intensity of CB→ VO++is found to be lower than V*O→
VB in all cases. Apparently, on increasing the temperature, the intensity of violet and blue emissions are increased, whereas in the case of ZNP, the emission from ex-IZn → VZn
is found to be superior than the emission from V*O→ VB.
Im-portantly, the peak positioned at ∼465 nm corresponds to the blue emission, which is significantly red-shifted to 480 nm on increasing the temperature. Clear evidence is provided from the morphology evaluation of ZnO nanostructures that
the alteration of GBs leads to the intensity variation of peak and their position. ZNF-1 and ZHT shows superior UV emis-sion, denoting good optical quality. Observations prove the reduction of defects in well-ordered grains and their sepa-rated nature.50 Furthermore, both XRD and HR-TEM results show that high temperature annealing enhances the crystal-linity of ZnO. However, in contrary to this, the observed PL spectra does not confirm the reduction of defects with high temperature annealing. Therefore, persistent results imply that higher temperature annealing promotes grain growth and GB related emissions occur with enhanced intensity thereby highlighting the importance of GB on the lumines-cent characteristics of ZnO.51,52
To date, electrospun nanofiber based catalytic systems dis-play enhanced photocatalytic performance owing to the exis-tence of a larger surface area and other dominant features.1–3,27,44,45In addition, enhanced effects are observed from the hollow tubes prepared through the electrospinning
Fig. 6 XPS spectra of O 1s in electrospun derived ZnO structures annealed at various temperatures over a range from 500°C to 1000 °C. The observed high resolution scan of O 1s spectra is composed of multiple peaks and fitted as three peaks denoting the existence of three different O species named lattice oxygen (OL), oxygen vacancies (OV) and chemisorbed oxygen species (OCh). The details on the position and relative
percentage of peaks are given in corresponding spectrum.
process on the photocatalytic performance rather than solid fibers.53–55 However, we would like to stress again that the core theme of our study is not in line with effects of defect re-lated emission on photocatalytic performance, but it is to elu-cidate the effect of GBs. The observance of the growth of nanograins results in an obvious change in the surface of the fiber, thereby influencing the GB area. It has to be noted here that the surface morphology of the nanofibers plays a crucial role in highlighting surface related attributes as an excellent feature. To summarize, GBs play an important role in deter-mining specific physical and chemical properties of nano-fibers in addition to higher surface area and aspect ratios.16,17,24,28
Controlled morphological features facilitated by prepared ZnO nanostructures expect to showcase an enhanced performance.56–59 Therefore, this is accomplished by the photodegradation of a cationic textile dye, MB performed un-der UV irradiation. The diverse feasible mechanism, includ-ing the production of reactive oxygen species involved in the enhancement of photocatalytic activities, have been already well studied and reported.60–63In the outset, the MB degrada-tion experiment was conducted in the presence of ZNF-1 un-der dark conditions and the respective absorbance spectra (Fig. S4†) clearly demonstrated that there is no significant ef-fect on the degradation even up to 90 min. This confirms that the dye was not adsorbed onto the surface of the catalyst and it could reach the adsorption equilibrium in 30 min. Photodegradation efficiencies of electrospun ZnO
nanostruc-ture samples with different morphologies as a function of ir-radiation time are presented in Fig. 8a. The recorded absorp-tion spectra of MB as a funcabsorp-tion of irradiaabsorp-tion time during the degradation processes are presented in Fig. S5.† The self-degradation efficiency of the control dye solution without any catalyst was also presented for comparison and was found to be∼16% under irradiation for 90 min. A worthy note here is the correlation of distinct particle sizes and morphology of the calcined electrospun ZnO nanostructure samples. There-fore, observations prove that the MB dye (∼5 ppm) has un-dergone complete degradation for the ZNF-2. In contrast, such photodegradation efficiency has not been observed in the other structures. Analysis proves that calcined samples at 500 °C (ZNF-1), 600 °C (ZHT), 700 °C (ZNF-2), 800 °C (ZBF), 900 °C (ZSF) and 1000 °C (ZNP) exhibited about 85%, 76%, 98%, 74%, 59% and 49% degradation, respectively, as can be observed from Fig. 8b.
The photo-degradation of MB follows the pseudo-first-order rate law (Fig. 8c) and the rate expression is given by the equation lnIJC0/C) = kt where k is the degradation rate
con-stant (min−1), and C0 and C represents the initial and final
concentration of MB at a given time period. The observed values of the rate constants are 0.0199, 0.0169, 0.0419, 0.0154, 0.0087 and 0.0062 min−1for ZNF-1, ZHT, ZNF-2, ZBF, ZSF and ZNP, respectively. As observed in Fig. 8d, the ZNF-2 shows a much higher rate constant which is about 6.7 times higher than the ZNP, which exhibits the lowest rate constant. This implies the fact that the ZNF-2 displays higher degrada-tion efficiency when compared to other ZnO nanostructures. Furthermore, the photocatalytic degradation efficiency of ZNF-2 for Rh B and 4-NP were studied and results are shown in Fig. S6 and S7.† The decolourization of pollutants was eval-uated through monitoring the absorption spectra, as shown Fig. S6a and S7a.† It is noted that the intensity of the peaks gradually decrease upon increasing the irradiation time. The corresponding digital images of pollutants taken at definite time interval are shown in Fig. S6b and S7b.† The degrada-tion efficiency of ZNF-2 for Rh B and 4-Nitrophenol were cal-culated to be ∼91% in 3 h and ∼92% in 4 h, respectively. The above results clearly show that ZNF-2 has excellent photocatalytic activities for a wide range of pollutants.
Moreover, it has been clearly implied that the photo-degradation performance of the samples has been purely based on the GB mediated defect emissions along with their well-maintained morphology. Furthermore, the reusability of the ZNF-2 was evaluated in five consecutive cycles and the re-sults in Fig. S8† shows that there is a slight decrease in the degradation efficiency that could be due to the photo corro-sion effect.64,65 To attain an in-depth view on the effect of photo corrosion on the catalyst, we have exposed electrospun ZnO nanostructures to UV irradiation for a time period of 24 h by changing the dye solution and studying the changes in surface morphology and their chemical composition. The ob-served morphological features evidently revealed that the sur-face of the electrospun ZnO nanostructures is severely dam-aged, as illustrated in Fig. S9.† Interestingly, the fibrous
Fig. 7 Deconvoluted photoluminescence spectra of electrospun ZnO nanostructures (a) ZNF-1 (b) ZHT (c) ZNF-2 (d) ZBF (e) ZSF and (f) ZNP. The observed broad emission in the visible range confirms the pres-ence of defects in ZnO.
structure was not significantly altered and agglomerated (ZNF-1, ZHT, ZNF-2 and ZBF). Conversely, an apparent ag-glomeration of ZNP has been noticed and exists as a flake-like structure, as clearly shown in Fig. S10.† In addition, high resolution XPS analysis of the samples proved that the drastic shift in O 1s peak to 533.97 ± 1.0 eV. Similarly, the intense characteristic peaks observed at 1021.5 ± 0.3 eV and 1044.6 ± 0.2 eV in Zn 2p were considerably shifted to 1023.3 ± 0.5 eV and 1046.35 ± 0.4 eV, respectively, as illustrated in Fig. S11.† The findings confirmed the photocorrosion of ZnO during the photodegradation process. Further improvements in inhi-bition of photocorrosion in electrospun ZnO nanostructures present a challenge and much effort is needed to provide a solution to this issue.
The overall analysis of this experiment suggests that the dependence of the enhanced PCA found in ZNF-2 on struc-tural features, as well as defects at the GB region. Moreover, it is imperative to clearly differentiate the properties of both ZNF-1 and ZHT because both of them possess structural
fea-tures with small grains. Furthermore, the strucfea-tures of ZBF, ZSF and ZNP represent significantly higher defects than other structures. Thus, samples possessing excellent structural fea-tures and defects prove to display improved photocatalysis. Interestingly, it should also be noted herein that ZNF-2 showed superior photo degradation performance compared to than other structures, implying the crucial role of defects in the GB region.66–68 In the current study, we have thus highlighted the creation of defects by engineering the GB in electrospun ZnO structures for higher photocatalytic performance.
Conclusions
We have effectively demonstrated the temperature induced deformation of electrospun ZnO nanostructures from fibers to particles and their comparative degradation efficiency of MB. The grain size and GB mediated emission were concerned as primary factors and evaluated the influence of
Fig. 8 (a) Degradation of MB solution in the presence of various electrospun ZnO nanostructures (ZNF-1, ZHT, ZNF-2, ZBF, ZSF and ZNP) under UV exposure and their (b) comparative degradation efficiency. (c) The plot of−lnIJC/C0)versus irradiation time. C0andC are the initial and final
concentration of the MB dye. The observed data are fitted using a pseudo-first order kinetic equation: ln(C/C0) =kt (d) and their rate constant (k).
The calculated rate constants were 0.0199, 0.0169, 0.0419, 0.0154, 0.0087 and 0.0062 min−1for ZNF-1, ZHT, ZNF-2, ZBF, ZSF and ZNP, respec-tively. Inset: SEM images of corresponding electrospun ZnO nanostructures and MB solution in cuvettes before and after UV irradiation in the pres-ence of ZNF-2.
photocatalytic efficiency of ZnO nanostructures. It has been shown that the morphology of electrospun ZnO nanofibers are severely altered at higher temperature annealing. Further-more, it is observed that the density of nanograins are de-creased with a simultaneous increase in size. The effect on GB on the emission characteristics of ZnO have been derived and observations have shown that defects are reduced in well-ordered grains and their distinct nature, observed in ZNF-1 and ZHT. Studies from the photocatalytic measure-ment shows that the ZNF-2 with highly stacked nanograins demonstrates superior performance for the degradation of MB as compared to ZNF-1 and ZHT, which are usually thought to conferring superior performance. Detailed discus-sion on the importance of grains in the ZnO nanofibers have been presented. The morphology of nanofibers starts to de-form from 900°C, with an observed shoddier performance is associated with the destruction of the nanograin assembly. Therefore, the obtained results are well demonstrated by the correlation between defects and GBs, making our efforts more withstanding to finally comprehend the specificity of defects and their effect on the properties. Strong emphasis has been devised from the current study suggesting the opti-mization of nanograins and their boundary areas, in addition to superior features, including morphology, higher surface area and defects. This implies the detailed study of both the GB character distribution and the GB network arrangement for the development of an efficient catalyst.
Acknowledgements
A. S. acknowledges The Scientific & Technological Research Council of Turkey (TUBITAK), BIDEB 2221-Fellowships for Vis-iting Scientists and Scientists on Sabbatical for the fellowship. B. B. thanks (TUBITAK-BIDEB 2216, Research Fellowship Programme for Foreign Citizens) for postdoctoral fellowship. Z. A. acknowledges to TUBITAK-BIDEB (2211-C) for national PhD scholarship and TUBITAK (project no. 213 M185) for PhD scholarship. T. U. also acknowledges The Turkish Acad-emy of Sciences – Outstanding Young Scientists Award Pro-gram (TUBA-GEBIP). Authors thank M. Guler for TEM techni-cal support.
Notes and references
1 G. Panthi, M. Park, H.-Y. Kim, S.-Y. Lee and S.-J. Park, J. Ind. Eng. Chem., 2015, 21, 26–35.
2 P. F. Du, L. X. Song, J. Xiong, Z. Q. Xi, J. J. Chen, L. H. Gao and N. Y. Wang, J. Nanosci. Nanotechnol., 2011, 11, 7723–7728.
3 S. An, B. N. Joshi, M. W. Lee, N. Y. Kim and S. S. Yoon, Appl. Surf. Sci., 2014, 294, 24–28.
4 X. Ren, P. Ying, Z. Yang, M. Shang, H. Hou and F. Gao, RSC Adv., 2015, 5, 16361–16367.
5 Y. Dai, W. Liu, E. Formo, Y. Sun and Y. Xia, Polym. Adv. Technol., 2011, 22, 326–338.
6 J. Y. Park and S. S. Kim, J. Am. Ceram. Soc., 2009, 92, 1691–1694.
7 A. Katoch, G. J. Sun, S. W. Choi, J. H. Byun and S. S. Kim, Sens. Actuators, B, 2013, 185, 411–416.
8 A. K. Das and A. Srinivasan, J. Magn. Magn. Mater., 2016, 404, 190–196.
9 A. Katoch, Z. U. Abideen, H. W. Kim and S. S. Kim, ACS Appl. Mater. Interfaces, 2016, 8, 2486–2494.
10 H. Hou, M. Shang, L. Wang, W. Li, B. Tang and W. Yang, Sci. Rep., 2015, 5, 15228.
11 L. Zhu, M. Hong and G. W. Ho, Sci. Rep., 2015, 5, 11609. 12 A. Senthamizhan, A. Celebioglu and T. Uyar, Chem.
Commun., 2015, 51, 5590–5593.
13 A. Senthamizhan, A. Celebioglu and T. Uyar, J. Mater. Chem. A, 2014, 2, 12717–12723.
14 A. Senthamizhan, A. Celebioglu and T. Uyar, Sci. Rep., 2015, 5, 10403.
15 A. Senthamizhan, A. Celebioglu, B. Balusamy and T. Uyar, Sci. Rep., 2015, 5, 15608.
16 S. Xie, Q. Xu and X. Huang, ChemCatChem, 2016, 8, 480–485. 17 X. Feng, K. Jiang, S. Fan and M. W. Kanan, J. Am. Chem.
Soc., 2015, 137, 4606–4609.
18 S. Anitha, D. J. Thiruvadigal and T. S. Natarajan, Mater. Lett., 2011, 65, 167–170.
19 A. Calleja, X. Granados, S. Ricart, J. Oró, J. Arbiol, N. Mestres, A. E. Carrillo, X. Palmer, F. Cano, J. A. Tornero, T. Puig and X. Obradors, CrystEngComm, 2011, 13, 7224–7230.
20 A. Baranowska-Korczyc, K. Fronc, L. Klopotowski, A. Reszka, K. Sobczak, W. Paszkowicz, K. Dybko, P. Dluzewski, B. J. Kowalski and D. Elbaum, RSC Adv., 2013, 3, 5656–5662. 21 J. Y. Park, K. Asokan, S. W. Choi and S. S. Kim, Sens.
Actuators, B, 2011, 152, 254–260.
22 S. W. Choi, J. Y. Park and S. S. Kim, Chem. Eng. J., 2011, 172, 550–556.
23 W. Liu, W. Pan, J. Luo, A. Godfrey, G. Ou, H. Wu and W. Zhang, Nat. Commun., 2015, 6, 8354.
24 S. Yan and Q. Wu, J. Mater. Chem. A, 2015, 3, 5982–5990. 25 A. Mclaren, T. Valdes-Solis, G. Li and S. C. Tsang, J. Am.
Chem. Soc., 2009, 131, 12540–12541.
26 D. Chen, Z. Wang, T. Ren, H. Ding, W. Yao, R. Zong and Y. Zhu, J. Phys. Chem. C, 2014, 118, 15300–15307.
27 F. Kayaci, S. Vempati, C. Ozgit-Akgun, N. Biyikli and T. Uyar, Appl. Catal., B, 2014, 156–157, 173–183.
28 F. Kayaci, C. Ozgit-Akgun, I. Donmez, N. Biyikli and T. Uyar, ACS Appl. Mater. Interfaces, 2012, 4, 6185–6194.
29 S. Anitha, B. Brabu, D. J. Thiruvadigal, C. Gopalakrishnan and T. S. Natarajan, Carbohydr. Polym., 2013, 97, 856–863. 30 W. Jiao, L. Wang, G. Liu, G. Q. Lu and H.-M. Cheng, ACS
Catal., 2012, 2, 1854–1859.
31 J. Lu, R. Guo, W. Dai and B. Huang, Nanoscale, 2015, 7, 7331–7339.
32 Z. Wang, M. Saito, K. P. McKenna, L. Gu, S. Tsukimoto, A. L. Shluger and Y. Ikuhara, Nature, 2011, 479, 380–383.
33 X. M. Bai, A. F. Voter, R. G. Hoagland, M. Nastasi and B. P. Uberuaga, Science, 2010, 327, 1631–1634.
34 J. Nowotny, T. Bak, T. Burg, M. K. Nowotny and L. R. Sheppard, J. Phys. Chem. C, 2007, 111, 9769–9778.
35 A. M. van der Zande, P. Y. Huang, D. A. Chenet, T. C. Berkelbach, Y. You, G.-H. Lee, T. F. Heinz, D. R. Reichman, D. A. Muller and J. C. Hone, Nat. Mater., 2013, 12, 554–561. 36 S. Anitha, B. Brabu, D. J. Thiruvadigal, C. Gopalakrishnan
and T. S. Natarajan, Adv. Sci. Lett., 2012, 5, 468–477.
37 X. Zhang, J. Qin, Y. Xue, P. Yu, B. Zhang, L. Wang and R. Liu, Sci. Rep., 2014, 4, 4596.
38 J. P. Wang, Z. Y. Wang, B. B. Huang, Y. D. Ma, Y. Y. Liu, X. Y. Qin, X. Y. Zhang and Y. Dai, ACS Appl. Mater. Interfaces, 2012, 4, 4024–4030.
39 J.-H. Lin, R. A. Patil, R. S. Devan, Z.-A. Liu, Y.-P. Wang, C.-H. Ho, Y. Liou and Y.-R. Ma, Sci. Rep., 2014, 4, 6967.
40 D. Zhao, X. Zhang, H. Dong, L. Yang, Q. Zeng, J. Li, L. Cai, X. Zhang, P. Luan, Q. Zhang, M. Tu, S. Wang, W. Zhou and S. Xie, Nanoscale, 2013, 5, 4443–4448.
41 Y. Zheng, C. Chen, Y. Zhan, X. Lin, Q. Zheng, K. Wei, J. Zhu and Y. Zhu, Inorg. Chem., 2007, 46, 6675–6682.
42 D. Liu, Y. Lv, M. Zhang, Y. Liu, Y. Zhu, R. Zong and Y. Zhu, J. Mater. Chem. A, 2014, 2, 15377–15388.
43 J. Wang, P. Liu, X. Fu, Z. Li, W. Han and X. Wang, Langmuir, 2009, 25, 1218–1223.
44 F. Kayaci, S. Vempati, I. Donmez, N. Biyikli and T. Uyar, Nanoscale, 2014, 6, 10224–10234.
45 S. Mukhopadhyay, P. P. Das, S. Maity, P. Ghosh and P. S. Devi, Appl. Catal., B, 2015, 165, 128–138.
46 Q. Wang, Q. Sun, G. Chen, Y. Kawazoe and P. Jena, Phys. Rev. B: Condens. Matter Mater. Phys., 2008, 77, 205411. 47 H. Zeng, G. Duan, Y. Li, S. Yang, X. Xu and W. Cai, Adv.
Funct. Mater., 2010, 20, 561–572.
48 J. D. Ye, S. L. Gu, F. Qin, S. M. Zhu, S. M. Liu, X. Zhou, W. Liu, L. Q. Hu, R. Zhang, Y. Shi and Y. D. Zheng, Appl. Phys. A: Mater. Sci. Process., 2005, 81, 759–762.
49 V. Ischenko, S. Polarz, D. Grote, V. Stavarache, K. Fink and M. Driess, Adv. Funct. Mater., 2005, 15, 1945–1954.
50 S. Pal, A. Sarkar, P. Kumar, D. Kanjilal, T. Rakshit, S. K. Ray and D. Jana, J. Lumin., 2016, 169, 326–333.
51 S. Ghose, A. Sarkar, S. Chattopadhyay, M. Chakrabarti, D. Das, T. Rakshit, S. K. Ray and D. Jana, J. Appl. Phys., 2013, 114, 073516.
52 S. Park, M. S. Kim, H. Kim, J. Lee, G. H. Han, J. Jung and J. Kim, ACS Nano, 2015, 9, 11042–11048.
53 Z. Shami and N. Sharifi-Sanjani, CrystEngComm, 2014, 16, 910–921.
54 L. Lang, D. Wu and Z. Xu, Chem.– Eur. J., 2012, 18, 10661–10668. 55 M. Gao, L. Zhu, W. L. Ong, J. Wang and G. W. Ho, Catal. Sci.
Technol., 2015, 5, 4703–4726.
56 J. K. Kim, S. Bae, W. Kim, M. J. Jeong, S. H. Lee, C.-L. Lee, W. K. Choi, J. Y. Hwang, J. H. Park and D. I. Son, Nano Energy, 2015, 13, 258–266.
57 J. Shim, J. K. Kim, K. S. Lee, C.-L. Lee, M. Ma, W. K. Choi, J. Y. Hwang, H. Y. Yang, B. Angadi, J. H. Park, K. Yu and D. I. Son, Nano Energy, 2016, 25, 9–17.
58 C. Zhang, M. Shao, F. Ning, S. Xu, Z. Li, M. Wei, D. G. Evans and X. Duan, Nano Energy, 2015, 12, 231–239.
59 Y.-J. Yuan, F. Wang, B. Hu, H.-W. Lu, Z.-T. Yu and Z.-G. Zou, Dalton Trans., 2015, 44, 10997–11003.
60 P. Zhang, T. Wang, X. Chang and J. Gong, Acc. Chem. Res., 2016, 49, 911–921.
61 W. He, H. Jia, J. Cai, X. Han, Z. Zheng, W. G. Wamer and J.-J. Yin, J. Phys. Chem. C, 2016, 120, 3187–3195.
62 W. He, H. Zhao, H. Jia, J.-J. Yin and Z. Zheng, Mater. Res. Bull., 2014, 53, 246–250.
63 W. He, H.-K. Kim, W. G. Wamer, D. Melka, J. H. Callahan and J.-J. Yin, J. Am. Chem. Soc., 2014, 136, 750–757.
64 L. Zhang, H. Cheng, R. Zong and Y. Zhu, J. Phys. Chem. C, 2009, 113, 2368–2374.
65 C. Jiang, S. J. A. Moniz, M. Khraisheh and J. Tang, Chem.– Eur. J., 2014, 20, 12954–12961.
66 X. Huang, Z. Zhao, Y. Chen, C.-Y. Chiu, L. Ruan, Y. Liu, M. Li, X. Duan and Y. Huang, Nano Lett., 2014, 14, 3887–3894. 67 K.-S. Kim, W. J. Kim, H.-K. Lim, E. K. Lee and H. Kim, ACS
Catal., 2016, 6, 4443–4448.
68 X. Feng, K. Jiang, S. Fan and M. W. Kanan, ACS Cent. Sci., 2016, 2, 169–174.