4VESTIGATION OF OF
IN PENSION REFORM
A Pli.D. Dissertation
İJe p a rto e îıt ^
To Unchanging UrilVtrsal Laws
A COMPU I'A I lONAL INVESI IGAI ION Ol·' OPTIMAL PARAMEl'ERS IN PENSION REFORM
The Institute of Economics and Social Sciences of
Bilkent University
by
ARZDAR KİRACI
In Partial Fulfilment of the Requirements for the Degree of DOCTOR OF PHILOSOPHY IN ECONOMICS
in
THE DEPAR I'MENT OF ECONOMICS BILKENT UNIVERSITY
ANKARA
HD
к S
' 7 g H f "
I certify that I have read this thesis and have found that it is fully adequate, in scope and in quality, as a thesis for the degree of Doctor of Philosophy in Economics.
Assoc. Pi
Supervisor
I certify that I have read this thesis and have found that it is fully adequate, in scope and in quality, as a thesis for the degree of Doctor of Philosophy in Economics.
Assoc. Prof. Dr. Erdem Başçı Examining Committee Member
I certify that I have read this thesis and have found that it is fully adequate, in scope and in quality, as a ^ ^ i^ fo f the degree of Doctor of Philosophy in Economics.
Assoc. Prof. Dr. Mehmet Caner Examining Committee Member
I certify that I have read this thesis and have found that it is fully adequate, in scope and in quality, as a thesis for the degree of Doctor of Philosophy in Economics.
Assist. Prof. Dr. Siiheyla Özyıldırım Examining Committee Member
I certify that I have read this thesis and have found that it is fully adequate, in scope and in quality, as a thesis for the degree of Doctor of Philosophy in Economics.
Assoc. Prof. Drl Erol Çakmak Examining Committee Member
Approval of the Institute^ Ec
Prof. Dr. Ali Karaosmanoğlu
ABSTRACT
A COMPUTATIONAL INVESTIGATION OF OPTIMAL PARAMETERS IN PENSION REFORM
Kiracı, Arzdar
Ph.D., Department of Economics Supervisor: Assoc. Prof. Dr. Serdar Sayan
July 2000
7’he purpose of this dissertation is to develop a computational framework to identify a set of parametric reform options to rehabilitate publicly run, pay-as-you-go-based pension systems under alternative strategies for reform involving once-and-for-all as well as gradual changes in pension parameters. The techniques developed are applied to the Turkish pension system, which is particularly interesting as it already faces a severe financial crisis despite a relatively young population. The results confirm the need for urgent reform.
Keywords: Computational Methods, Search Algorithms, Pension Reform, Pay-as-you-go- based Pension System
ÖZET
EMEKLİLİK REFORMUNDA OPTİMAL PARAMETRELERİN HESAPLAMALI İNCELENMESİ
Kiracı, Arzdan Doktora, Ekonomi Bölümü Tez Yöneticisi: Doç. Dr. Serdar Sayan
Haziran 2000
Bu tezin amacı, dağıtım esasına göre hizmet eden emeklilik sistemlerine bir anlık ya da kademeli değişim süreci gibi farklı stratejilerde parametrik reform seçeneklerinin tespiti için gerekli hesaplamalı altyapıyı geliştirmektir. Geliştirilen teknikler genç nüfusuna rağmen mali çıkmaza girmiş ve devlet tarafından işletilmekte olan Türk Emeklilik Sistemine uygulanmıştır. Çalışma acil bir reform ihtiyacını doğrulamakta ve kabul edilmiş emeklilik reformu üzerinde yorum yapabilmek ve alternatifler sunmak için gereken analitik altyapıyı sağlamaktadır.
Anahtar Kelimeler: Hesaplamalı Metodlar, Arama Algoritmaları, Emeklilik Reformu, Dağıtım Esasıyla Çalışan Sigorta Sistemleri
TABLE OF CONTENTS
ABSTRACT ... iii ÖZET ... iv TAEİLE OF CONTENTS ... vCHAPTER I
INTRODUCTION ... 1CHAPTER II
A SIMPLE OPTIMIZATION ANALYSIS FOR A PUBLICLY MANAGED PENSION SYSTEM ... 6II. I INTRODUCTION ... 6
11.2 THE NUMERICAL OPTIMIZATION FRAMEWORK ... 11
11.3 A BRIEF DESCRIPTION OF THE DATA SET ... 16
11.4 RESULTS AND CONCLUSIONS ... 19
CHAPTER III
THE ALGORITHM ... 24III. I INTRODUCTION ... 24
III.2 THE DATA ... 31
111.2.1. Workforce Calculation ... 32
111.2.3. Calculation of the Total Number ofRetirees ... 33
111.2.4. Calculation of the Yearly Number ofRetirees ... 35
111.2.5. Real Wage Series ... 37
111.3 THE MODEL ... 38
111.3.1. Explanation of the Variables ... 39
111.3.2. Numerical Optimization Framework ... 40
111.4 EXPLANATION OF THE ALGORITHM ... 44
111.5 RESULTS AND CONCLUSIONS ... 48
CHAPTER IV
IDENTIFICATION OF POLICY OPTIONS FOR REHABILITATING A PUBLICLY MANAGED, PAY-AS-YOU-GO BASED PENSION SYSTEM: AN OPTIMISATION ANALYSIS FOR TURKEY... 53IV. 1 INTRODUCTION ... 53
1V.2 THE NUMERICAL OPTIMISATION FRAMEWORK ... 56
1V.3 IMPLEMENTATION ... 58
IV. 4 RESULTS AND CONCLUSIONS ... 61
CHAPTER V
PARAMETRIC PENSION REFORM WITH HIGHER RETIREMENT AGES: A COMPUTATIONAL INVESTIGATION OF ALTERNATIVES FOR A PAY-AS- YOU-GO BASED PENSION SYSTEM ... 64V. l INTRODUCTION ... 64
V.2 COMPUTATIONAL ANALYSIS OF REFORM OPTIONS ... 68
V.2.1. Pension Reform Through a Once-and-for-all Change in System Parameters .. 69
V.2.3. Sensitivity of Results ... 82
V.3 CONCLUSIONS ... 84
APPENDIX... 86
CHAPTER I
INTRODUCTION
This dissertation is intended to be a collection of individually independent essays, ordered according to evolution of the ideas on the use and development of computational search techniques for an investigation of parametric policy reform alternatives facing the financially troubled pension systems that are publicly managed on the basis of pay-as-you-go (PAYG) schemes.
Four essays making up the dissertation will introduce new numerical techniques to the pension reform literature applicable to any country data. In addition, they will consider the case of the Turkish pension system and tackle various aspects of the problem of identification of pension policy parameters, which would eliminate (or curb the growth in) the intertemporal pension deficits over a prespecified period of time. Pension policy parameters under consideration here are statutory entitlement ages (or minimum retirement ages), contribution and replacement rates.
Each essay will seek an answer to a different question on the basis of the results obtained through the solution of a complicated intertemporal optimization problem in an overlapping-generations set-up. As to be described in greater detail later, the questions taken up in these essays aim at either providing policy guidance, or explaining the behavior of the policy-makers/pension system managers with respect to the choice of different retirement age and contribution/replacement rate configura tions.
Motivation for the study comes from the fact that publicly managed pension systems providing old-age or pension insurance coverage face financial difficulties in many countries across the world. Most of these systems are run on the basis of pay- as-you-go (PAYG) schemes, requiring pension payments to current retirees to be financed out of contributions collected from currently active workers and their employers. The primary reason causing financial difficulties these systems face is the increasing ratio of retirees to workers (the dependency ratio), most typically caused by the natural aging of population over the course of demographic transition. Following from increasing life expectancies and declining fertility rates over time, population aging is essentially a demographic phenomenon and cannot directly be controlled by pension authorities or policy makers. Pension balances would continuously deteriorate eventually causing sizable deficits, unless the resulting increase in dependency ratios could somehow be checked. High dependency ratios have already begun to challenge the financial sustainability of publicly run pension schemes in many countries (particularly, members of the OECD) forcing policy
makers to take measures to curb the growth in pension deficits (Kohl and O’Brien, 1998). Avoiding such deficits requires controlling dependency ratios through changes in statutory entitlement ages (or minimum retirement ages), and/or adjust ments in the values of contribution and replacement rates'.
The purpose of this dissertation is to develop a computational framework to identify a set of parametric reform options to rehabilitate the publicly run, PAYG- based pension systems under alternative strategies for reform involving once-and- for-all as well as gradual changes in pension parameters. The Turkish example is particularly interesting as the state operated pension system in Turkey already faces a severe financial crisis despite a relatively young population/ workforce. Unlike other countries where similar pension systems face financial difficulties largely because of population aging over the course of their demographic transition, a major reason behind the crisis of the Turkish system was the retirement ages that were exceptionally low by international standards. The evident need to increase minimum contribution periods/retirement ages distinguished pension reform efforts in Turkey from the experience of other countries where policy makers had relatively little room to adjust in the retirement ages along with other two parameters. The numerical results reported in the dissertation make it possible to compare the magnitude of required increase in the retirement ages under each reform strategy considered.
' Contribution rates are payroll tax rates by which contributions (or old-age insurance premiums) are collected, and replacement rates are those that tie pension payments to wages/salaries earned prior to retirement.
As pension reform increasingly becomes a priority issue in the policy agendas of many countries, a growing number of studies use numerical techniques to investigate parametric reform options for PAYG-based pension systems. The discussion in this section links up well with this literature as briefly surveyed by Chand and Jaeger (1996) and generational accounting studies. Especially relevant studies could be found in Halter and Hemming (1987), Van den Noord and Herd (1994), and Boll et al. (1994) and ILO (1996). The results here are also likely to provide useful inputs and experiment scenarios for dynamic overlapping generations general equilibrium analyses of social security reform, which are continuously added to an already sizeable literature.
d'he second chapter starts with a simple search for a pension reform through a once-and-for-all change in policy parameters. J'his part describes a very simple algorithm developed to identify all possible configurations compatible with this goal and illustrates its use with reference to the pension reform debate in Turkey, a country whose PAYG-based pension system already faces a severe financial crisis despite a relatively young workforce/population. The results indicate that tor contribution and replacement rates to remain around their current values, the minimum retirement age must be increased substantially.
The third chapter is the extension of the previous study to the pension reform through detailed and more realistic assumptions and modifications in the data set. This chapter contains the explanation of the basic algorithm, which is developed and also used in the following parts of the dissertation. The aim of the introduced
algorithm is to enable to make similar calculations for everybody in search of this kind of parameters with the illustration of this technique for the data of Turkey.
The fourth chapter is the combination of the previous two chapters. This part makes the discussion of identification of parametric reform options to prevent losses generated by a publicly managed, PAYG-based pension system with the use of the improved basic algorithm for this purpose. The computational framework developed in this chapter is used in the article “Identification of parametric policy options for rehabilitating a pay-as-you-go based pension system: An optimization analysis for T urkey,” forthcoming in Applied Economics Letters with Serdar Sayan.
The fifth chapter is concentrated on the extension of the study to the pension reform through gradually increasing retirement ages with the extended algorithm for this purpose. This part discusses the identification of parametric reform options to control losses generated by a publicly managed, PAYG-based pension system under alternative deficit reduction (reform) strategies including one time jumps, as well as gradual changes in contribution and replacement rates and statutory retirement ages, i.e., the parameters characterizing a pension system. For this purpose, three different problems, each corresponding to a different pension reform strategy is considered using search algorithms and dynamic programming techniques. The computational framework developed in this chapter is used in the article “Parametric Pension Reform with Higher Retirement Ages: A Computational Investigation of Alternatives for a Pay-As-You-Go Based Pension System,” forthcoming in Journal of Economic Dynamics and Control with Serdar Sayan.
CHAPTER II
A SIMPLE OPTIMIZATION ANALYSIS FOR A PUBLICLY
MANAGED PENSION SYSTEM
II. 1 INTRODUCTION
Publicly managed pension systems face financial difficulties worldwide. Most of the existing systems are financed by payroll taxes under pay-as-you-go (PAYG) schemes that use contributions collected from current workers’ payrolls to finance pension benefits to current retirees. Under PAYG schemes, the contributions an individual worker makes prior to when he begins to collect his own retirement benefits are typically used to finance benefits paid to other retirees. While these contributions are essentially savings out of the incomes of current workers, they are not readily available for various financing needs of workers. Instead, the
contributions made through payroll taxes entitle them to benefits to be collected in
2
the future at a predetermined rate .
A trouble with this system is that it is often difficult to maintain politically
acceptable configurations of key policy parameters that are also compatible with the
predetermined social and economic goals of the social security institutions and the requirements for a fiscally sound management of the system. The three key policy parameters in this context are contribution (payroll tax) rates, replacement rates that tie the levels of pension benefits to wages earned prior to retirement, and minimum retirement ages.
Increasing the difficulty that lies in the way of policy makers/system managers who need to decide on such configurations of policy parameters is the need to operate under various exogenous constraints. These exogenous constraints include such demographic factors as average life expectancies and age composition of the workforce, and legal and structural factors such as the nature and enforceability of social security regulations. In many cases, exogenous changes such as a variation in the age composition of population or a shift in the tendency to underreport earnings occur suddenly or over time, causing actuarial balances of the pension funds to get disturbed. In such cases, holding on to the original configuration of policy
- This is the reason why PAYG systems are considered to be based on “defined benefit” (as
opposed to “defined contribution”) schemes where the benefit rates are specified in advance, even though the cost to the social security administration o f providing those benefits is uncertain.
parameters for extended periods of time would typically lead to a deterioration of fiscal balances sometimes causing growth in pension deficits to go unmanageable.
It may be argued, therefore, that in countries where pension ilinds are publicly managed on a PAYG basis, sustainability of the system depends critically on the ability of policy makers to make timely adjustments in policy parameters in response to changes in exogenous factors, demographic and structural alike. In a country where the pension system is set up when the population is relatively young, for example, small contributions from a large number of workers enable the system to pay generous benefits to a relatively small group of retirees. However, when the population begins to age due to baby booms of previous periods, reductions in birth rates and/or increasing life expectancies over the course of the country’s demo graphic transition, dependency ratios may increase and maintaining the initial configuration of policy parameters may become increasingly difficult. This is, in fact, what is presently observed in many countries across the world and it largely explains the reason behind financial difficulties that the social security administra tions of these countries face: When population ageing sets in, the retiree population begins to grow, increasing the burden of pension payments. If deterioration in fiscal balances is to be avoided, a new configuration of policy parameters must be introduced. This can be achieved either by changing one parameter at a time, or changing all three parameters at once. It can be shown that there are infinitely many combinations of contribution and replacement rates, and minimum retirement ages that are compatible with the goal of maintaining actuarial balances at their initial
levels following an exogenous shock. Obviously, each choice between alternative combinations would imply a different intergenerational distribution of the costs and benefits of the social security system. From a policy making point of view, therefore, some configurations would be more desirable than others whereas some would not be politically acceptable at all because of the resistance from pensioners’ associations or trade unions etc. In any case, for policy makers to make informed decisions, all available alternatives should be presented to them.
The purpose of this chapter is to present results concerning possible policy parameter configurations that are compatible with the maintenance over time of a selected balance between amounts of contributions (premiums) collected from workers and pensions paid to the retirees in Turkey, a country whose PAYG-based pension system already faces a severe financial crisis despite a relatively young workforce/population. For this purpose, a numerical optimization algorithm is developed to identify various combinations of PAYG policy parameters that may be chosen to stop the growth of the social security deficit in Turkey. The case of Turkish social security system is especially interesting for several reasons. Firstly, the financial crisis has hit the Turkish social security institutions earlier than it would otherwise be expected mainly because of the populist moves of the policy makers who short-sightedly reduced the legal level of minimum retirement age below the levels in almost every other country in the world (James, 1995)^. Under these
circumstances, increasing the minimum retirement age through modifications to the existing law is a more important policy tool in Turkey than in many other countries. Secondly, the existence of certain structural barriers causes actual premia collection in Turkey to stay consistently lower than the potential levels, as commonly observed in many other countries where the volumes of unrecorded transactions reach significant levels. Despite the availability since the early 1940s of quite comprehen sive laws regulating social security in the country, the lack of enforceability leads to substantial leakages from the system, particularly in the form of un(der)reported payments to labor by employers or their failure to comply with the legal require ments concerning timely transfer of contributions collected to social security institutions (ILO, 1996). Finally, the market for private pension funds in Turkey is still thin (Ergenekon, 1998), and even if steps are to be taken towards a more comprehensive reform involving privatization of social security, the existing public institutions need to be rehabilitated in such a way as to stop at least the growth in the social security deficit. Currently, choosing a new configuration of policy parameters and reducing the leakage rates can only achieve this goal. The consequences of these policies are investigated in this chapter, and despite the focus of the discussion on the Turkish case, the technique described here could be used for other countries as well.
The approach used in this chapter fits well into the branch of the growing social security literature that is concerned with pension system reform through an investiga tion of parametric alternatives as briefly surveyed by Chand and Jaeger (1996). Particularly relevant examples of this literature could be found in Halter and
Hemming (1987), Van den Noord and Herd (1994), and Boll, Raffelhiischen, Walliser (1994) among others. Despite eertain similarities in frameworks of inves tigation, the one employed in the present essay has at least two salient features. First, it parametrically introduces leakages reducing potential revenues of social security institutions in Turkey, pointing to the magnitude of the contribution that structural constraints make to current deficits. Secondly, the numerical solution technique employed makes it possible to simultaneously consider the entire set of alternative policy parameter configurations designed to reduce/stabilize deficits. This represents a substantial improvement over the techniques employed in other studies that consider the effects on fiscal/actuarial balances of social security by changing any one of the three parameters at a time, which is explained in the next section. Section 3 presents some information on the relevant characteristics of the social security system in Turkey and briefly describes the database employed. Finally, Section 4 discusses the numerical results and concludes the chapter with a general discussion of policy alternatives.
II.2 THE NUMERICAL OP flMlSA flON FRAMEWORK
Total losses generated by each of the three publicly managed social security institutions currently correspond to one of the major components of public sector deficits funded directly by the Treasury in Turkey. Furthermore, the losses tend to increase very rapidly both in absolute value and in their proportion to the GDP. Even now, the existing system absorbs most of the direct subsidies and transfers by the
government and if the current parameter configurations are to be maintained, the total deficit of the pension system is projected to increase from 1.8% to 10.1% of GDP by the year 2050. Perhaps an even more striking figure is that the accumulated deficit is expected to reach to 31.6 per cent of the GDP until 2050 under present parameters (ILO, 1996). In the light of these alarming numbers, the goal of the numerical optimization exercise below was chosen as the complete elimination (over time) of pension deficit between 1995 to 2060, and parameter configurations calculated were required to be compatible with zero difference between the sums of future (expected) pension payments and total contribution collection in real present value terms'*. Given this goal, the problem at hand could formally be defined as the minimization of
(1+8)'
subject to the exogenously given (projected) values of
rw, : Average real wage earned by workers at time /,
rwa I : Average real wage earned by the retirees who are aged a at time l just prior
to their retirement.
Pa, I : Population at the age of a at time (,
' Obviously, the alternative configurations could have been found also by requiring this difference to take a positive value (rather than zero) to reflect social policy goals o f governments who are willing to make positive transfers to the retirees out o f Treasury sources.
where
a : Age index running from the beginning of working-life, ao=20, to the end of
life at 75+;
/ : Time index running from to =1995 to the end of time horizon, T=2060,
and t ’ = t - to.
Identification of alternative policy parameter configurations that are compatible with zero deficit requires finding the set of 3x65 policy vectors that will minimize the difference in (1) for any given values of parametric constants of the problem: the
leakage rate, I , the discount factor, and the wage ceiling that puts an upper limit
to the contributions collectable from wages, %. The elements of each vector (C/?,
RR, A) for 65 years are defined as
CRt : Average contribution (payroll tax) rate at year t,
RRt : Average replacement rate used to tie pension benefits to wages earned by
workers at year t, and
A : Legally allowed minimum of the retirement age.
With this notation in mind, the problem is to find endogenously determined values of all policy parameter triplets {CRt, RRt, A) at any given time, for given parametric values of the leakage rate, the discount factor, and the wage ceiling, on the one hand, and given projected values of real wages and age composition of population, so as to
minimize the difference. A, between the total present value of real contributions (i.e., the first term on the right hand side of identity sign) to be collected, and total present value of pension payments to be made to the retiree population over a time horizon from 1995 to 2060.
It must be noted that the resulting CR, RR and A vector configurations would only be compatible with the previously explained goals concerning the balance between contribution receipts and pension expenditures and the exercise would not take into consideration survivors’ benefits, health care payments, or old-age benefits to the needy. Subject to the availability of data, these aspects of social security could be incorporated into the analysis in a rather straightforward fashion. However, since the main area of concern for the applied part of this study is pension deficits in Turkey, unnecessary complications to the analysis and notation are avoided by leaving them out of the optimization exercise here. Likewise, the use of relevant averages for real wages and various parameters including the CR and RR aim to limit the scope of analysis to essential details only.
Within this set-up, the optimal value vectors of CR, RR and A were found through the numerical algorithm developed for this purpose. The algorithm was run
<5, and X . Computationally, the algorithm requires that the following ratio be less than 0.0001 for each configuration of parameters^:
(1 - ^)L=,995 7 7 7 ^ ^ Po,) + - S . =a )
(
2)
(1
+6
)'(1
+6
)'In searching for the optimal values, the following procedure was used. First, keeping in mind that relevant values for real wages, rw, and population figures, p, come from projection data, the total present value of real pension payments was calculated by changing the replacement rates with increment of 0.05 within the interval [0, 1] for the assumed value of 6, and for each possible value of the retirement age, A. After storing the results from this stage, a search routine was employed to find CRs that will be compatible with the ratio in (2) being smaller than 0.0001 for each previously stored value of RR and the associated value of A. Finally, optimal (CR, RR, A) configurations are plotted in three dimensions as shown in the next section where a discussion of the results follows a brief description of the important characteristics of the Turkish pension system.
^ It can be shown that this amounts to minimizing the difference between the contributions collected and the pension payments as defined in (1) to the desired degree o f precision for A. Requiring that the ratio in (2) be strictly smaller than 0.0001, yields a precision level with 4 digits after the point, but using 0.00001 instead would increase precision to 5 digits after the point etc.
II.3 A BRIEF DESCRIPTION OF THE DATA SET
The Turkish Social Security System is made up of three different and distinct branches each operating on a PAYG basis: SSK, Bag-Kur (hereafter, BK) and Emekli
Sandığı (hereafter, ES). Of these, SSK (Social Security Institution) provides coverage
to blue-collar workers employed in the public sector and blue-collar and white-collar workers in the private sector; BK covers farmers, artisans and other self-employed people, and the ES is the pension fund administration for white-collar workers employed by local and central governments. The losses generated by these three institutions together currently correspond to one of the major components of public sector deficits funded directly by the Treasury. Furthermore, the losses tend to increase very rapidly both in absolute value and in proportion to the GDP. Pro jections for the period between 1995 and 2050 indicate that the GDP shares of
individual deficits by these institutions will rise from 1.21% to 7.48% for SSK, from 0.53% to 1.83% for ES, and from 0.07% to 0.75% for BK if the current policies are maintained (ILO, 1996).
The primary reason causing this situation is the early ages of retirement coupled with the natural ageing of population. Despite differences across social security institutions, the retirement age is very low by international standards. As compared to nearly 65 years of age which is typical of OECD countries, the median retirement age is about 53 for people covered by SSK and ES, and slightly higher than 60 for BK (Gillion and Cichon, 1996). Consequently, there arises a trend of rapidly increasing ratios of pensioners to contributors from one year to another. In a recent parametric
reform study carried out by the ILO (1996), the contribution and replacement rates required to curb the growth of pension deficits in Turkey were calculated by assuming an average retirement age of 55 for men and 53 for women first, and then the effects of increasing the retirement age on fiscal balances of Turkish pension system were investigated through simulation exercises. Since a salient feature of the algorithm employed here is its ability to find values of A compatible with optimal
CR and RR values without relying on parametrically changed levels of retirement
ages, no prior information about the average age at which people choose to retire is needed. Instead, all possible values of minimum retirement age are considered in the present analysis.
The projection data needed came from different sources and new series were generated under appropriate assumptions whenever necessary^. For population projections, the same data produced by the Turkish State Institute of Statistics (SIS) were used as the ILO (1996) study. Since SIS population projections were reported only for the beginning year of each decade until the year 2060, yearly population projections were obtained by assuming exponential growth between the beginning years of any two decades. Then, to obtain data on working population, 1994 workforce participation rates (i.e., the ratios of workforce to population) and information on the composition during the same year of the workforce by gender and age were used as reported by SIS (1994). By aggregating female and male workers, a
A detailed and expanded explanation how the data is generated can be found in Chapter 111 section 2
single workforce participation rate independent of the gender of workers was found for each age group for 1994. Finally, working population projections obtained by using projected population figures under the assumption that the participation rates would remain constant at their 1994 values for each age group were fed into (1) as for 20<ci<A-7. As for the retiree population, the tables in SIS (1994) showing the stocks of female and male retirees covered by each o i SSK, BK and ES in 1995 were used. While the tables reported the number of male and female workers who retired for different reasons (ageing, health and disabilities) separately, only those who retired due to ageing were considered here. So, after aggregating over sexes and excluding those who were forced to retire because of poor health or disability reasons, the numbers of people who have chosen to become pensioners at different ages were summed up across three institutions and the ratio of the number of retirees to total population was found for year 1995. Then, the projections concerning annual stocks of pensioners were generated under the assumption that this ratio would stay constant until 2060, the year marking the end of model horizon, and the resulting values were fed into (1) as PaS^ for A ^ .
The other important set of data for the solution of optimization exercise was the real wage series. For this purpose, the real wage series in Bulutay (1992) was used for the period between 1965 and 1989^. In order to project the real wage series
’ Although this real wage series went as far back as 1950, only the real wages after 1965 were taken into consideration as relevant since the retiree stock at the beginning o f the time horizon included people who had been retired for as long as 30 years prior to 1995.
into 2060, the real wages until 1989 were extended by using assumed rates of
productivity growth and expected inflation*. Finally, the wage ceiling, x , was taken to be equal 0.4 (40%) as in Gillion and Cichon (1996) and the discount factor, ¿>, was set equal to 0.05 as in ILO (1996).
11.4 RESUI/rS AND CONCLUSIONS
The following figure shows all possible configurations of CR, RR and A that are compatible with zero difference between total present values of pension expenditures and contribution receipts (both in real terms) over the 1995-2060 period.
Figure 1
* It was assumed that the rate o f labor productivity growth would be maintained at its long-term (1950-1989) value o f 2.73 % calculated from Bulutay (1992). Expected inflation rates were assumed to be equal to previous year’s rate until 1998 and to be the following thereafter: 50% for 1998-2000; 20% between 2000-2005; 10% between 2005-2010, 5% between 2010-2020, and 3% between 2020- 2060.
The current situation is marked in the figure with the existing average constant contribution rate of 20% for SSK (TUSIAD, 1997), the largest of all three, and a minimum allowable retirement age of 38. The marked three stars show applicable replacement rates for people covered by each of the three social security institutions, i.e., 95% for SSK, 78% for BK and 67% for ES (Güzel, Okur and Şakar, 1990).
The bold black line in figure 1 shows the required (as opposed to actual) contribution rates for these replacement rates to be maintained by allowing people to retire as early as 38 years of age, and without allowing for a growth in pension deficits. The required contribution rates that correspond to RRs of 0.67 (ES), 0.78
(BK) and 0.95 (SSK) are 1.55, 1.83 and 2.17, respectively. Given the wage ceiling of
40%, a CR of 1.55 (155%) implies that 62% of the wages earned have to be contributed to the system by white-collar workers covered by ES. This is perhaps the most feasible of all, because for higher RRs applicable to the pensioners of other two institutions, the required CRs point to visibly higher levels of contributions that are as high as 87% of the wages earned by SSK workers.
As far as the policy options are concerned, the following figure 2 summarizes the possibilities for retirement age for a (currently realistic) leakage rate of 20%. All possible combinations of the CR, RR and A for balancing the pension deficit over time are shown on the left for the assumed leakage rate. The cross-section on the right shows retirement ages associated with constant CR=20Vo and RR= 0.67, 0.78 and 0.95. By these plots, current replacement rates of ES, BK and SSK require
minimum retirement ages varying between 61 and 63 (all significantly higher than the currently allowed minimum retirement age of 38), if the average CR were to set
Figure 2
Similar cross-section plots could be generated for other politically acceptable values of CRs if the replacement rates are to be maintained at current values. Since each different configuration implies a different intergenerational distribution of pension system resources, the policy makers may be inclined not to retain
replacement rates as well. In general, once a consensus on the need to curb the growth of pension deficits is reached, the particular parameter vector picked would depend on the relative political powers of parties involved, e.g., retirees’ associa tions, trade unions etc.
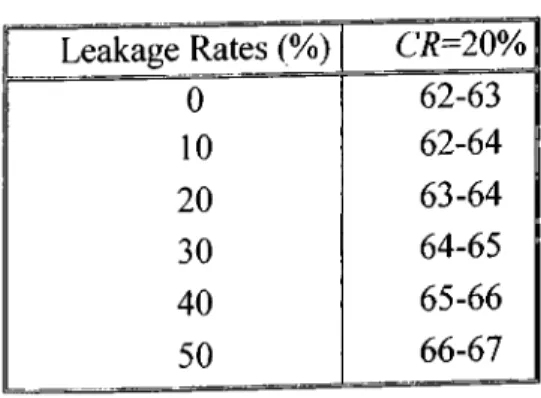
Alternative plots for alternative leakage rates could also be produced by using the method developed here. In order to give a better idea about the flexibility of the results produced by the algorithm, a wider set of policy choices associated with dilferent leakage rates is presented in the following table 1, which shows the retirement ages that are compatible with actual replacement rates of ES, BK and SSK for a given contribution rate of 20% and alternative leakage rates.
Table 1 Leakage Rates (%) C/?=20% 0 62-63 10 62-64 20 63-64 30 64-65 40 65-66 50 66-67
It is obvious from the numbers in the table that for CRs and RRs to remain around their current values, the minimum retirement age must be increased substantially. It appears not to be feasible to maintain retirement ages below 40 along with the current replacement rates, since this would require CR values exceeding 100% even if policy makers are willing to increase contribution rates. These conclusions hold for
all conceivable leakage rates including the case of zero leakages. Yet, the consideration given to positive leakage rates here indicates that the set of policy tools to fight pension deficits is larger for policy makers in countries like Turkey, where certain structural factors make the collection of contributions difficult. Therefore, coupled with the ability to eliminate structural impediments lowering contribution receipts, the existence of a political determination to close pension deficits in these countries may result in a need for smaller adjustments in conventional parameter combinations as compared to other countries where leakages have been non-existent. In any case, for the policy makers to pick one of the possible configurations (with or without leakages), the entire set of choices must be made available to them so that they are aware of the results of their actions. Only then it would be up to them to decide which configuration to choose.
CHAPTER III
THE ALGORITHM
III.] INTRODUCTION
Starting in Germany and completing its development in England and Holland, the Social Security System has become an important part of today’s economies. It is important because it is a concern for about 90% of the population in the countries where the institution is well developed and in the countries on the way to industrialization'^. This system provides security for the working population during work life and benefit during retirement. In addition, the security system provides a
In 1995 83.6 was the ratio o f the insured population and 67.1 was the ratio o f population covered by heath services in Turkey. (State planning Organization Economic And Social Indicators 1950-
1998).
compulsory saving mechanism, which increases total savings in the economy and aims to decrease the poverty among the old and disabled people.
All social security systems work according to the fund management system. Inflows of this fund are the contributions made by working people and outflows of this fund are the pensions paid to the retirees, or to the people who already contributed for a specified period of time. So the longer one contributor works the more benefit to the system and the longer a retiree lives the more cost to the system.
A publicly managed pension institution, which is based on the pay-as-you-go (PAYG) system with a relatively high percentage of young population“^, would have been an ideal time period for the working and retired population, because a low contribution would suffice to finance the relatively low number of retired people". However, populist movements of frequent changing'^ governments trying to gain votes by shifting the burden to the future generations or governments by allowing retirement at an age below 45 and even lower change this fact. If that happens to be, then the system causes an ever-increasing burden to the society, where none of the contributors and retirees are happy.
In Turkey 73.5 o f the population and 64.1 o f the workforce is below 40 years o f age. (Statistical yearbook o f Turkey 1994)
" Active to passive insured member ratio is the ratio o f the number o f people paying premium to people receiving retirement payments. If the number is large then little contribution o f active payers is enough to finance passive retirees.
'■ Between the years 1950 to 1997 37 and between the years 1969 to 1998 24 government changes took place in Turkey. (Turkish National Assembly Library)
It is a fact that key policy variables, which are the parametric variables replace ment rate (RR) and contribution rate (CR), and the structural variable the minimum retirement age, needs only some slight adjustment in case of demographic changes if the system is operating in some optimum configuration. In case of a temporary increase in the birth rate, the changes in the parametric variables might correspond to a few percent increase in CR or decrease in RR, which might also be tolerated without a change in these parameters. A structural change, however, is needed in case of a permanent change in demographic figures, so that if the birth rate slows or if the life expectancy increases, the percentage of the old people is going to increase so that the retirement age has to be increased. The population increase has slowed down in big cities in Turkey, where most of the people who benefit from the social security institution live. In addition, except for the immigrations, the native population of the big cities, where most of them are insured, does not grow'^.
There are three publicly managed social security institutions'"' in Turkey, where total losses generated by each of the three currently correspond to one of the major components of public sector deficits funded directly by the Treasury in Turkey. The losses are due to the deficit between the income received and payments made in the security system such that according to the ILO report the total deficit of
In Turkey there is immigration from east, where the population is not insured to west where most o f the insured people live.
The Turkish social security system is made up o f three different and distinct branches each operating on a PAYG basis: S S K , B a ğ -K u r and E m ekli S a n d ığ ı.
the pension systems has increased from 1.8% to 10.1% of GDP in 50 years and the reports of ILO warns that the accumulated deficits will be three times larger than the expected GNP of the year 2050 (ILO, 1996).
One of the two main reasons for this large deficit is the fact that the real premium paying contributors have to finance an unsustainable number of pensioners. The retirement age should have stayed at 55 for male and 50 for female workers, however, with the populist policies of political parties, it is allowed to retire after 5000 premium-paying days, which corresponds to 13 year and 10 days (Güzel, Okur and Şakar, 1990). In addition, with the law issued in 1976 the payment duration was set to 25 years for male and to 20 years for female workers, which in turn enabled retirement at age 43 for male and 38 for female workers when they started working with the age of 18. There is no situation like this in any country in the world (James, 1995), where the young retirees become a big burden for the system and for the society. The second reason is that there is also a problem in the collection of the contributions'^, which increases the deficit so that the total contributions stay lower than the total pension of the system. Therefore, in spite of the young population there is a problem in the Turkish Social Security System, and on any other security institution that allows a retirement with the age of 38.
As an example, in B ag -K u r, which is made up o f about 3 million members from which 27% never paid their premiums and only 2.8 percent has no dept to pay to the institution {B a g -K u r database
Turkey will not be the only country facing the pension problem because most of the industrial countries also started facing that problem due to the aging of their populations. For most of these countries the retirement age is set to an age between 55 to 60 years, but if technological advances continue to increase the average age of the population then this will require again an increase in the retirement age'^. In this case the similar situation as in Turkey will emerge if not by medical costs, optimistically, just by the insufficient premium collection.
Since the early 1980s, the prospects of an aging population have widely been recognized and discussed as a key fiscal and macroeconomic problem, as detailed in studies by Heller, Hemming, and Kohnert (1986), OECD (1988b), Hageman and Nicoletti (1989), Cutler and others (1990), Van den Noord and Herd (1993,1994), World Bank (1994), Leibfritz and others (1995), and Masson and Mussa (1995). To analyze the need for pension reform in the major industrial countries, OECD studies by Van den Noord and Herd (1993 and 1994) and Leibfritz and others (1995) report estimates of unfunded public pension liabilities under the present pension arrange ments and discuss the effectiveness of selected parametric reforms.
In addition, the Turkish Security System has to be adjusted so that it should be prepared for the aging of the young population and the western countries should be
Such a demographic transition will naturally have various economic and fiscal impacts. The expected economic effects o f transition include reductions in labor supply, increases in the share o f consumption relative to output and hence, a lower saving rate and a slow-down in capital formation. As for fiscal effects, population ageing is expected to place serious pressures on public pension systems and, more generally, on societies' intergenerational transfer burdens.
prepared for the super old generations. Alternative ideas'^ were developed to get the system out of the crisis with no computational justifications, which requires try and fail methods to find the optimum configurations which can end up in years of experiments. Using expected future data, however, it is possible to develop an algorithm for computers that can increase the speed of adjustment and avoid possible experiments with the system that can result in loss of patience and trust to the institution. Such an algorithm should suggest all possible combinations of policy variables leaving the decision to the policy-maker who make the arrangements considering the other variables, which affect the social life.
This chapter follows the path of Chand and Jaeger (1996), who investigated the parametric alternatives for pension reforms. Other interesting cases of this literature could be found in Halter and Hemming (1987), Van den Noord and Herd (1994), and Boll, Raffelhiischen, Walliser (1994) among others. The difference of this investiga tion from the proceeding ones is that in some cases leakages from the system had to be considered. These reduce the potential revenues of social security institutions in Turkey, pointing to the importance of the magnitude of the contribution that structural constraints make to current deficits. In addition, the numerical solution technique employed makes it possible to simultaneously consider the entire set of alternative policy parameter configurations designed to reduce deficits. This
The market for private pension funds in Turkey is still thin (Ergenekon, 1998), and even if steps are to be taken towards a more comprehensive reform involving privatization o f social security, existing public institutions need to be rehabilitated in such a way as to stop at least the growth in the social security deficit.
represents a substantial improvement over the techniques employed in other studies that consider the effects on fiscal/actuarial balances of social security by changing any one of the three parameters at a time. This numerical solution technique and data for estimations and real behavior of the population is explained in the next section in order to make the results as realistic as possible. Different pension indexation options are discussed by Hemming and Kay (1982) and Hills (1993). The 1992 Reform Act in Germany is discussed in a very detailed manner by Boll, Raffelhiischen and Walliser (1994) by using the generational accounting principle suggested by Auerbach, Gokhale and Kotlikoff (1991, 1992).
The aim in this dissertation is to design a system for policy makers such that they are endowed with many key political variables as possible. In order to make the alternatives acceptable, it was firstly required to show that it is impossible to continue this way and then to show alternative solution policies in order to make the system survive. The explanation of the data used in this part is in section 2 and in the following section the calculations are explained with examples if possible. After the calculations in the model section 3, the expected results are obtained and illustrated in the results section 4. The details are left to the appendix part with appropriate footnote references.
III.2 THE DATA
In order to make estimation for a smooth change in the parametric and structural variables in the social security system and also to make the system work as a self financing institution, future predicted data by ILO reports (March 1996) and real data issued by SIS (State Institute of Statistics-DIE 1970-1997) are used. ILO future estimates for the female and male populations, participation rates out of population, unemployment rates for male and female out of workforce and death rates for male and female populations for the years 1995-2060 have been utilized. Data issued by SIS contained the change in the population behavior after the changes in the retirement age, unemployment rates and sickness rates for the time period 1970-1990 for male and female populations.
The data’s published from both of the institutions were not enough to obtain yearly and age group data, therefore estimations of the required data had to be regenerated. The numbers of the ILO were published for each decade after year 2000, which needed to be recalculated so that yearly estimates, could be used with the help of the following formulas:
Pop,^k = (1 + s f * ^ ^ * log(l + g )
Pop,
or
where the following variables represent
/*i>/7t+k : the population at time t+k
: the growth rate of the population between t and t+k, which is assumed to have stayed constant during the corresponding decade.
III.2.1. Workforce Calculation
Using these population estimates the workforce is calculated. The workforce participation ratios prepared by SIS in 1994 were taken as base and were used to calculate the workforce for the future years in the following way:
Workforce Participation Ratio(s,a) =
Population's, a)
where se{male, female} and for age group ae} !, 2, ..., 75+} in the year 1994. It is assumed that this workforce participation ratio does not change also in the future years, giving the workforce at any time after 1994 in the following way:
Workforce{s,a,t) - Workforce Participation Raiio(s,a) * Population(s,a,t)
where year t e (1995,1996,...,2060}, se(male, female} and age group a e ( l , 2,..., 75+}.
75+ male
Total Workforce(t) = fV(t) = ^ ^ Work/brce(s, a,t)
a=0 s=female
III.2.2. Age Group Estimation
In the original data the population estimates were the sum of 5-year age totals, i.e., the population estimates were given as for the ages 0-4, 5-9, ..., 70-74, 75+. In order to obtain the population and workforee estimates for eaeh age, they were divided into a linear and eontinuous fashion so that the total sum of the 5-year age gave the same number as in the eorresponding 5-year age group.
Considering this with an example, for the age group 0-4. The starting point is 0 and workforee starts without any workers. Afterwards the workforee inereases linearly in sueh a way that till the age 4 the amounts in the ages 1, 2, 3 increased according to the formulas yi=a*l+b, y2=a*2+b, y3=a*3+b and y4=a*4+b. At the end the sum yi+y2+y3+y4 is equal to the workforce for the ages 0-4.
III.2.3. Calculation of the Total Number of Retirees
In order to find a result that covers the whole nation, the retired people of all the three social security institutions, which are SSK, Emekli Sandığı (ES) and Bağ-
751- male
Total Retirees at time t = ^ ^ Retirees(s, a,t) =
a=0 s=fem ale
75+ male
^ (SSK(s, a, t) + BK(s, a,t) + ES(s, a, t)) c/=0 female
To find the number of retirees at time t, the following ratio is assumed to be constant for all age groups and all sexes as it was the case for the workforce participation ratio where the 1995 retiree population data has been taken as constant in the following way:
Retirees Ratio{s,a) = Retirees{s,a,\995) Reiirees(s,a,t)
Population(s, ¿1,1995) Population(s, a)
where year te ( 1995,1996,...,2060}, se(male, female} and age group ae{l,2,...,75+}.
Then the total number of retirees for each year t becomes:
75+ male
Total Retirees at time t = Y Y Retirees Ratio(s, a, t) * Population{s, a, t) = i/=0 s=fem ale
m Retirees(s,a,t) ? v ^ V V — ^--- * Population(s,a,t) = Tf>sJ^,aiePopulation{s,a) ^ Retirees{s,a,\995) , ■ , v y y --- ^ ' -- = *Populationis,a,t) Populationis, ¿7,1995)
The specialty of the developed algorithm is that it considers the people for each age group and each time period that are going to quit the workforce and start to get their retirement benefit separately. Though it is difficult to find the people that are
going to retire each year now and in the future without a statistical survey the following trick was used to estimate the yearly and by age group retirees.
1II.2.4. Calculation of the Yearly Number of Retirees
The trick for the yearly retiree calculation is based on the change in the participation and unemployment rates. In a population where nobody looses his/her job and nobody retires, the participation rates do not change in the consequent years. For example, for the year 2009 the estimated man population at the age 64 is 180634 and one year later the survived people from this generation, i.e., in year 2010 with age 65 are 176448. The participation in the year 2009 and age 64 was 74.4, which implies that 134391 of the man were in the workforce, however, in the year 2010 if people would not quit working and the same participation rate would be applicable, this would imply that at the year 2010 131277 people would be working. However, the participation rate at the age 65 is 35.9, which implies that actually 63344 men are still working. So the expected workforce was 131277, but it happens to be 63344, what happened to the 67933 people?
The reason for the participation rate change for the age groups is the fact that people quit working. This happens because people either die, loose their jobs or they start to get their retirement benefit. If it is assumed that the death rate is uniformly affecting all the man/woman population without distinguishing if the man/woman works or not, then the surviving population will still have the same participation rate.
Therefore, people either retire or loose their jobs. In addition, the change in the unemployment is usually too small to be considered for age groups, so it cannot explain the large changes in the participation rates. As a result, 67933 people are the men/women who retire at this age in 2010. For each year and age group the same calculation is made separately during the whole analysis and the whole paragraph can be summarized in the following figure 3:
Figure 3
This way the algorithm was successful in explaining 50% of the male retiree number and 90% successful in explaining the female retiree data. I'he deviation comes from the fact that the data’s are estimations instead of exact survey and, in addition; death rates are not equal in the working population and the rest of the population. In the following years unemployed people may also be managing
somehow to get retired by paying their premium and start to receive payments without working, which is also another discrepancy. However, the unexplained data is also used in calculations so that they are responsible from the lower and upper bound for retirement ages, which is explained in the following section.
In the experimental process explained in the following part there is a minimum requirement age restriction so that all the calculated number of new entrants cannot retire prior the minimum retirement age, and only people due health or accidental reasons are allowed to retire. The people are assumed to postpone their retirement until the legal retirement age is reached.
III.2.5. Real Wage Series
The other important set of data for the solution of optimization exercise was the real wage series. For this purpose, the real wage series in Bulutay (1992) was used for the period between 1965 to 1989. Although this real wage series went as far back as 1950, only the real wages after 1965 were taken into consideration as relevant since the retiree stock at the beginning of the time horizon included people who had been retired for as long as 30 years prior to 1995. In order to project the real wage series into 2060, the real wages until 1989 were extended by using assumed rates of
productivity growth and expected inflation'*^. Actually, from the structure of the problem the real wage was acting like a constant in the optimization problem and because of the long horizon, the same real wage appeared in the benefit and cost functions so that the real wage could be collected as coefficients reducing its effect in the problem. Finally, the wage ceiling, Wc, was taken to be equal 0.4 (40%) as in Gillion and Cichon (1996) and the discount factor, S had intermediate values between 0 to 0.01.
III.3 THE MODEL
fhe problem of the Turkish System or any system, which allows early retirement is that there are an excess number of retirees that could have been working and contributing to the social security system. However, it is difficult to force people to postpone their retirement if they were allowed to retire earlier today. Therefore, in the first years of the adjustment process the designed model allows the country to continue facing deficits at a decreasing rate but at the end of the model horizon there is no debt caused by the structural change. In addition, after the end of the plan the pay-as-you-go model can continue working with the new parameters without any problem.
'* It was assumed that the rate o f labor productivity growth would be maintained at its long-term (1950-1989) value o f 2.73 % calculated from Bulutay (1992). Expected inflation rates were assumed to be equal to previous year’s rate until 1998 and to be the following thereafter: 50% for 1998-2000; 20% between 2000-2005; 10% between 2005-2010, 5% between 2010-2020, and 3% between 2020- 2060.
The developed algorithm here gives the administration lots of key policy variables and a policy time path, which can be chosen according to the political view. The policy variables are A (retirement age), RRi (replacement rate) and CRi (contribution rate). The policy path is the time dimension of these key policy variables, which allows them to be low today and high tomorrow. The plan for Turkey is to have a balanced system at the end of 2060, i.e., the collected premium should be able to finance the retiree fees starting from 1995 and ending at 2060. This huge sum can be summarized in the following equation:
(1+8)'
(1
+8
)'II1.3.1. Explanation of the Variables
The developed and on a computer implemented algorithm obtained solutions for the key policy variables A (retirement age), RRt (replacement rate) and CRi (contribution rate) satisfying the previous equality using the calculated w f (total workforce), rp (total retiree number) for each age group and each year. The last mentioned numbers or densities were changing of course if the minimum retirement age is allowed to change. In addition, the expected real wage increase Rwt and the
Wc (wage ceiling) were used as exogenous variables by the system. For the fair
but this does not rule out the possibility that they can be changing through time. The algorithm is easily modifiable to perform this task too.
III.3.2. Numerical Optimization Framework
In this part a general solution method is explained and the simplified form of it is used. The first one refers to a dynamic policy optimization where CRt is time de pendent and the second one is used if it is counted as a constant.
The first optimization framework can be summarized to minimize the difference
^—I'^060 1 r. /· >2060 1 _ .
(1 + Ô)' (1 + Ô)'
subject to the exogenously given (projected) values of
t : time index for years 1995 to 2060,
a : age group index for ages 15 to 75 \
A : legally allowed minimum of the retirement age,
Rwi : average real wage earned at time t, which is applied to the workforce
uniformly,
Rm>, : average real wage earned by the retirees rp^^x, who retired at the age a at
fPu,T. · retired people at age group a at year t and at the minimum retirement age A,
vv/a,t,T : workforce at age group a at year t and at the minimum retirement age A,
CR : average contribution (payroll tax) rate,
RR : the replacement ratio to finance the retired social security members,
6 : discount factor,
/ : the uncollected part of benefits,
Wc : wage ceiling.
Both of these sums are in the order of lO’^, which makes the reduction the difference A to a number near zero very difficult. In addition, even a reduction to such a small difference was not important because a precision of 20 digits after the comma for the calculated variable was not required. So the objective for minimization was changed to the following formula, after which the results satisfy the required precision that is correct up to four digits after comma. The modified objective as follows:
>(l+8>
(1
+8
)'(1- o z ! l 7 r ^ ^ + Z ; ! 1 7t; ^
subject to the mentioned constraints. The number of constraints may be larger and they might also be time dependent functions, which make the problems difficult to solve’*^. However, with increased computational cost, the first optimization problem will still work.
In the second optimization framework where the CR, is a constant, the calculation reduces to an easy formula in the following way:
2060 =1995 1 ( 'Z^a=l5 C r ^ (1 + 8) (1
_ / ) V ^ y WcRw, y
wf\, ^
As mentioned, the data published by ILO and SIS was not detailed and did not allow the calculation of the yearly retiring people for each year exactly. The calculated retirees were explaining 70% of the data and the unexplained rest of retired people data was used to calculate upper and lower bounds in the following way:
Firstly, the retirees calculated by the algorithm were eliminated from the estimated yearly retirement data. The rest is assigned the minimum retirement fee as lower bound and highest fee as upper bound, which will allow an error correction possibility. The lower bound will give an age where below that age the system will not be working definitely and the upper bound will give a retirement age above