© TÜBİTAK
Analysis of Some Leguminous Plants For Pyrimidine
Constituents*
Yusuf TURAN
Balıkesir University, Faculty of Education, Biology Department, Balıkesir-TURKEY
Received: 13.8.1997
Abstract: The pyrimidine and pyrimidine-derived secondary compounds of Phaseolus aureus and Glycine max were investigated. Batches, each consisting of one hundred 12-day-old seedlings of either P. aureus or of G. max were separately extracted in cold dilute (0.6 M) perchloric acid. After preliminary purification of extracts by charcoal adsorption and elution, and by PVP treatment, the extracts were subjected to paper chromatography and high voltage paper electrophoresis. The UV-absorbing bands were detected by viewing chromatograms and electrophoretograms under UV-light and, where possible, identified. The results presented in this work show that these experimental plants do not synthesize and accumulate any significant amount of a pyrimidine-derived secondary product. Key Words:Phaseolus aureus, Glycine max, pyrimidine metabolism, secondary products.
Baklagillerden Bazı Bitkilerin Pirimidin Analizi
Özet:Phaseolus aureus ve Glycine max’da pirimidin ve pirimidinlerin türevi olan sekonder bileşikleri araştırılmıştır. On iki günlük yüzer adet P. aureus ve G. max çimleri ayrı ayrı soğuk seyreltik (0.6 M) perklorik asitle ekstre edildiler. Charcoal adsorpsiyonu ve elusyon, daha sonra da PVP muamelesiyle bir ön saflaştırmadan sonra ekstraktlar, kağıt kromatografisi ve yüksek voltajlı kağıt elektroforezine uygulandılar. Kromatogram ve elektroforetogramların UV-ışığını absorbe eden bantları UV-ışığı altında belirlendi ve mümkün olduğunca tanımlandı. Bu çalışmanın sonuçları, deney bitkilerinin herhangi bir pirimidin türevi sekonder ürünü dikkate değer miktarda sentezlemediğini ve biriktirmediğini göstermektedir.
Anahtar Sözcükler:Phaseolus aureus, Glycine max, pirimidin metabolizması, sekonder ürünler.
Introduction
There have been several investigations published suggesting that seedlings of Pisum sativum synthesize and accumulate two unusual amino acids, willardiine and isowillardiine (1-3), seeds and seedlings of Lathyrus tingitanus accumulate lathyrine (4-6) and that seedlings of Albizzia julibrissin produce albizziine (7,8). All these compounds have been shown to originate from uracil as their precursor, and are konwn as pyrimidine-derived secondary products (9-16).
The investigations concerning the interface between pyrimidine primary and secondary metabolism in plants could be only carried out with representatives of two groups one that produces pyrimidine-derived secondary products and another that does not. As described above, the examples of the producer group are already known. Thus, the main aim of the present study was to analyze the tissues of two leguminous plants, for pyrimidine constituents, which have not previously been investigated in this respect.
It appears that as yet there has been no report describing the synthesis of pyrimidine-derived secondary products by P. aureus and G. max. However, before suggesting the use of these plants as “non-producers” for comparison with plant species forming secondary products, they were examined to make certain that they do not synthesize such compounds.
Material and Methods
Plant material. Phaseolus aureus Roxb. and Glycine max (L) Merr. seeds were purchased locally in Swansea, UK. Dry seeds were well washed and allowed to imbibe for 15 hr in the dark in distilled water prior to being sown. The seeds were then set to germinate in plastic trays 26 cm x 22 cm x 6 cm depth, containing presoaked vermiculite, obtained from Vitagrow Ltd., Stoneferry, Hull., UK. All trays, which had drainage holes in the bottom, were watered daily with distilled water. Seedlings were grown in a constant temperature room at 25°C with a light cycle of 16 hr light (6 klx) and 8 hr dark.
Chemicals. Analytical grade chemicals and solvents were from British Drug Houses (BDH) Ltd., Poole, Dorset, UK. Activated charcoal (Norit PN.5 Formerly OL’) and Polyclar AT were also obtained from BDH, Poole, Dorset, and purified before use, as described below. Purines and pyrimidines were purchased from Sigma (London) Chemical Company Ltd., Surrey, UK.
Extraction of purine and pyrimidines. The procedure used was essentially that described by Brown (17). It involved extraction at 4°C, and all the solvents and apparatuses used were pre-cooled to this temperature. Plant tissues were rinsed in distilled water to remove any adhering traces of growing medium, and lightly blotted with paper tissues. After weighing seedlings were finely ground in 0.6 M perchloric acid using a mortar and pestle. Approximately 1 ml of perchloric acid was allowed per gr of tissue. The homogenate was centrifuged at 12,000 g for 20 min at 4°C. The supernatant was retained, and the debris was reextracted a further three times in the same manner. The pooled supernatant from the four extractions was adjusted to pH 7.4 by addition of a concentrated solution of KOH, and the extract was kept at 4°C to facilitate precipitation of insoluble KCIO4. The latter was removed by centrifuging at 5000 g for 10 min at 4°C. The supernatant was subjected to preliminary purification using activated charcoal and, if required, Polyclar AT to free it from various pigments and phenolics.
Charcoal adsorption. Activated charcoal was purified before use by a modification of Brown’s procedure (17). The charcoal (150 gr) was suspended in 6 M HCI and the suspension was boiled for 30 min with continuous stirring. The suspension was allowed to cool, then filtered on Whatman No. 1 filter paper under vacuum. This procedure was repeated until the filtrate was colourless (approximately the 10th filtrate). The charcoal was washed with distilled
water twenty times to remove all traces of Cl
-, as indicated by silver nitrate solution (1% w/v). It was then suspended in a solution of aqueous ethanol (25% v/v) containing 5% (v/v) of ammonia solution (sp. gr. 0.88), and stirred continously for 24 hr before being filtered. This ammonical ethanol treatment was repeated as often as necessary to yield a colourless supernatant. Finally, the charcoal was washed ten times with distilled water, and air-dried at 140°C for 15 hr.
Before the charcoal adsorption procedure, the extract was adjusted to pH 3.5 with glacial acetic acid. Approximately 1 gr of purified active charcoal was added per 20 gr fresh weight of the original plant material, and the suspension was stirred continuously for 2 hr. The extract was then allowed to settle for 20 hr at 4°C, and finally centrifuged at 5,000 g for 30 min. The charcoal was washed by resuspending twice in distilled water and centrifuging in the same manner. The washings were pooled with the non-adsorbed fraction.
Adsorbed compounds were eluted from the charcoal by continuously stirring in aqueous ethanol (25% v/v) containing 5% (v/v) of ammonia solution (sp. gr. 0.88), for 2 hr. After allowing the flask to stand for 20 hr at 4°C, the charcoal was removed by centrifuging at 5000 g for 30 min. To ensure complete elution, the procedure was repeated four more times. Eluates were pooled and filtered three times through Whatman No. 1 filter paper under vacuum to remove traces of charcoal. Finally, the pooled eluate was combined with the non-adsorbed fraction and evaporated to dryness in vacuo at 40°C, and then subjected to paper chromatography and paper electrophoresis for separation and investigation of the components. Purification of extracts with Polyclar AT (PVP). Before use, Polyclar AT was cleaned by Andersen and Sowers’ method (18). This involved suspension in a solution containing 9 gr of sodium chloride, 0.25 gr of potassium ferricyanide, and 20 gr of sodium carbonate per liter of water. The suspension was stirred continuously until the yellow colour of the ferricyanide disappeared, and then the mixture was filtered under vacuum through Whatman No. 1 filter paper. This procedure was repeated several times until the PVP no longer decolorize the ferricyanide. The PVP was collected by filtration and washed several times with distilled water. It was then stirred for 1 hr with each of the following solutions in sequence: (a) 10 % (w/v) sodium carbonate, (b) 1.2 M hydrochloric acid, and (c) distilled water. Finally, after washing with 3 M hydrochloric acid, the Polyclar AT was washed repeatedly with distilled water and air-dried. All washes were in the proportion of 1 volume of Polyclar AT to 4 volumes of washing solution. The plant extract to be treated with Polyclar AT was adjusted to pH 3.5 with glacial acetic acid. Approximately 1 gr of the prepared PVP was added per 20 gr fresh weihgt of the plant tissue, and the suspension was stirred continuously for 20 min at 4°C. After clarification by centrifuging at 5,000 g for 10 min, the supernatant was filtered through Whatman No. 1 paper under vacuum to reove traces of PVP, then evaporated to dryness in vacuo and analysed as required.
Chromatography and electrophoresis. Descending paper chromatography was carried out on Whatman No. 3 MM paper (46 x 57 cm) at room temperature. Samples to be chromatographed were applied as bands, and chromatograms were developed for 15-20 hr. In
all separations authentic reference samples were included alongside the unknown samples. The solvent systems used for paper chromatography were (a) Butan-1-ol: Glacial acetic acid: Water (60:15:25), (b) ol: Ammonia solution (sp. gr. 0.88): Water (70:10:20) (c) Propan-2-ol: Concentrated HCl Water (65:15:20), (d) EthanPropan-2-ol: Ammonia solution (sp. gr. 0.88): Water (80:10:10) and (e) tert-Butyl alcohol: Butanone: Ammonia solution (sp.gr. 0.88): Water (40:30:10:20).
High voltage paper electrophoresis (HVE) was effected on Whatman 3MM paper by using the apparatus Shandon Southern, model L-24. The sample was applied as a narrow band in the middle of a strip (23 x 57 cm) of paper. Reference samples were placed alongside the sample band. The buffer used was formic acid: acetic acid at pH 2, prepared by mixing glacial acetic acid (50 ml) with formic acid (40 ml of 98-100%, v/v) and making up to a final volume of 1 liter with distilled water. The voltage gradient applied was 28 V cm-1
for 2 hr.
Elution of compounds from chromatograms and electrophoretograms. Elution of bands from paper strips was carried out in an elution cabinet using Dent’s capillary elution technique (19). The eluent was water. Eluates were evaporated to dryness in vacuo at 40 °C in a rotary film evaporator and in a vacuum desiccator over concentrated sulphuric acid.
Identification of compounds by spectrophotometry. Compounds were identified by cochromatography and coelectrophoresis with authentic samples. Preliminary identification was facilitated by reference to the UV-spectral properties of the compounds. An eluate from a similar size piece of blank chromatography paper from the same RF as the sample was used to provide a spectrophotometric blank. A similar procedure was applied in examining electrophoretograms. Absorption spectra were recorded at pH 2 and pH 12 using a Cecil CE 5501 Double Beam Spectrophotometer.
Results and Discussion
Batches, each consisting of one hundred 12-day-old seedings of either Phaseolus aureus or of Glycine max were separately homogenized in cold dilute (0.6 M) perchloric acid, as described in Methods. After preliminary purification of the extracts by charcoal adsorption and elution, and by Polyclar AT treatment, the extracts were subjected to chromatography and high voltage electrophoresis, as described respectively in the Methods section. The UV-absorbing bands were detected by viewing chromatograms and electrophoretograms under UV-light and, where possible, identified as described below:
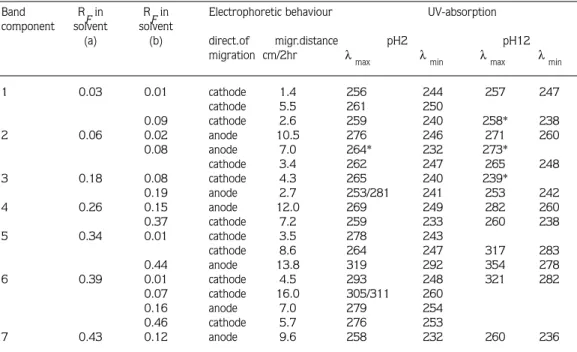
1. Phaseolus aureus. After paper chromatography in the solvent system butan-1-ol: acetic acid: water (solvent a), seven bands were detected under UV-light. These bands were eluted and, after further chromatographic and electrophoretic purification, their major constituents were identified where possible. Details are given in Table 1.
Band 1: On paper chromatography in solvent system (a) viewing in UV-light revealed a dark narrow band with an RF value of 0.03. When it was re-chromatographed in solvent (b), two bands were obtained with RF values of 0.01 and 0.09, respectively. On high voltage paper
electrophoresis in formic acid: acetic acid: water buffer at pH 2, the band of RF 0.01 gave three weak bands. One migrated 6 cm towards the anode and was seen to have a similar rate of migration to ATP and CTP. Its RFin solvent (a) and (b) was also simiar to those of ATP and CTP. The ultraviolet absorption spectrum of this band corresponded at both pH 2 and 12 to ATP (Table 1). Two other bands migrated 1.4 cm and 5.5 cm towards the cathode, respectively. These could not be identified by their UV absorption spectra (Table 2). The band of R
F 0.09
migrated 2.6 cm towards the cathode and, upon re-chromatography in solvent (c), had an RF of 0.63 . This could not be identified by spectrophotometry (Table 2).
Band 2: This was a broad band with an R
F of 0.06 in solvent system (a). Under UV-light,
darker horizontal zones could be seen within this band, and it was therefore taken to be heterogeneous. After re-chromatography in solvent (b), three bands were observed under UV-light with RF values of 0.00, 0.02 and 0.08, respectively. The bands of RF 0.00 and 0.02 were still not homogenous. High voltage paper electrophoresis of the band at the origin separated it into three bands. In the formic acid: acetic acid: water buffer at pH 2, two of these bands migrated to wards the anode; one moved 7.0 cm and the other 9.5 cm. The third band, which was seen as a bright blue fluorescent band under UV-light, migrated 3.5 cm towards the cathode in 2 hr. Each band was eluted, together with a blank of corresponding area, for spectrophotometry (Methods section). The UV-absorption spectra of the first band, which moved 7.0 cm anode, at pH 2 and pH 12, were those of a guanosine nucleotide (Table 1), the second band, moved 9.5 cm anode, showed spectral properties typical of a uridine nucleotide (Table 1) and the third band, moved 3.5 cm cathode, did not exhibit selective absorption in the UV-spectrum. The chromatographic and electrophoretic behaviours of these two bands were identical to the authentic reference samples of GTP and UTP. The band of RF 0.02 from solvent (b) gave two bands when it was separated by high voltage electrophoresis. They migrated 5.0 cm and 10.5 cm, respectively, towards the anode. UV-spectrophotometric examination of the band migrating 5.0 cm, gave similar absorption spectra to ADP (Table 1), and its chromatographic and electrophoretic behaviours were identical to the ADP reference sample. The second band, which migrated 10.5 cm, did not appear to be any of the more usual purine or pyrimidine derivatives (Table 2). The third band, R
F of 0.08, from the separation in solvent
(b) was further separated into two bands by high voltage paper electrophoresis at pH 2. One migrated 7.0 cm towards the anode and the other which was seen as a blue fluorescent band under UV-light, migrated 3.4 cm towards the cathode. They were both subjected to spectrophotometric investigation (Table 2) but neither could be identified.
Band 3: This band had an RF value of 0.18 in solvent system (a). It was re-chromatographed in solvent (b), and three bands were then detected, with RF values of 0.03, 0.08 and 0.19, respectively. Each band was separately eluted and subjected to high voltage electrophoretic separation. The first and third bands migrated towards the anode 6.2 cm and 2.7 cm, respectively, and the second band 4.3 cm towards the cathode. The band which migrated 6.2 cm towards the anode exhibited chromatographic and electrophoretic behaviour similar to that of the authentic sample of UMP. When it was investigated spectrophotometrically, at both pH 2 and pH 12, it showed the characteristic absorption spectra of UMP (Table 1). The other two bands were not identifiable by high voltage paper electrophoresis (Table 2).
Band 4: The RF value of this band was 0.26 in solvent (a). Following re-chromatography in solvent (b), two bands were seen under UV-light with RF values of 0.15 and 0.37, respectively. When these two bands were individually subjected to high voltage paper electrophoresis, the first migrated 12 cm towards the anode and second migrated 7.2 cm towards the cathode in 2 hr. Each band was eluted together with a corresponding blank and examined spectrophotometrically, but neither was identifiable (Table 2).
Band 5: This was a wide band with an RF of 0.34 in solvent system (a). Under UV-light darker zones could be seen within this band. It was re-chromatographed in solvent (b), and yielded four bands of RF 0.01, 0.07, 0.20 and 0.44 respectively. When these bands were individually separated with high-voltage paper electrophoresis, the first band yielded two bands, both of which migrated towards the cathode, one 3.5 cm and the other 8.6 cm. The other bands from chromatography in solvent (b) each yielded a single band. The second and third bands migrated towards the cathode 5.0 cm and 6.5 cm, respectively. The fourth band moved 13.8 cm towards the anode in 2 hr. These bands were separately eluted and investigated by spectrophotometer. The band which migrated 6.5 cm towards the cathode corresponded, at both pH 2 and pH 12, to guanosine (Table 1). The second band from solvent (b), which moved 5.0 cm towards the cathode, showed non-specific absorption, and the other bands did not appear to be any of the more usual purine or pyrimidine derivatives (Table 2).
Band 6: This was a broad band of RF 0.39 in solvent (a). Darker zones were visible within the band under UV-light. After re-chromatography in solvent (b), four bands were seen under UV-light with RF values of 0.01, 0.07, 0.16 and 0.46, respectively. The second band (RF 0.07) was also heterogeneous, and it was re-chromatographed in solvent (c), but only one band was observed (RF of 0.76). The latter band and the first, third and fourth bands from solvent (b) were separately exposed to high voltage electrophoresis, and each then gave a single band. The third band from solvent (b) migrated 7.0 cm towards the anode. The first and fourth bands
Band RF in RF in Electrophoretic behaviour UV-absorption Identity compo- solvent solvent
nent (a) (b) direct.of migr.distance pH2 pH12
migration cm/2hr λ
max λmin λmax λmin
1 0.03 0.01 anode 6.0 257 231 259 228 ATP 2 0.06 0.00 anode 7.0 256 229 258 231 GTP anode 9.5 262 231 262 242 UTP 0.02 anode 5.0 257 231 259 228 ADP 3 0.18 0.03 anode 6.2 262 231 262 242 UMP 5 0.34 0.20 cathode 6.5 254 227 260 232 Guanosine 7 0.43 0.40 cathode 0.7 262 231 261 242 Uridine
Solvent systems are described in the Materials and Methods section. Electrophoresis was with a voltage gradient of 28
V/cm in formic acid:acetic acid: water buffer (40: 50: 910 by vol.) at pH2.
from solvent (b) and the band from solvent (c) migrated 4.5 cm, 5.7 cm and 16 cm, respectively, towards the cathode in 2 hr. None of these compounds were identifiable by UV-spectrophotometric analysis (Table 2).
Band 7: The RF value of this band was 0.43 in solvent system (a). When it was re-chromatographed in solvent (b), two bands were seen under UV-light, one at RF 0.12 and the other at 0.40. On high voltage paper electrophoresis in the formic acid: acetic acid: water buffer at pH 2, the band of RF 0.12 migrated 9.6 cm towards the anode and the band of RF 40 migrated 0.7 cm towards the cathode in 2 hr. The UV-absorption spectra of the latter band corresponded, at pH 2 and pH 12, to uridine (Table 1) while the other band was not identifiable (Table 2) by spectrophotometric comparison.
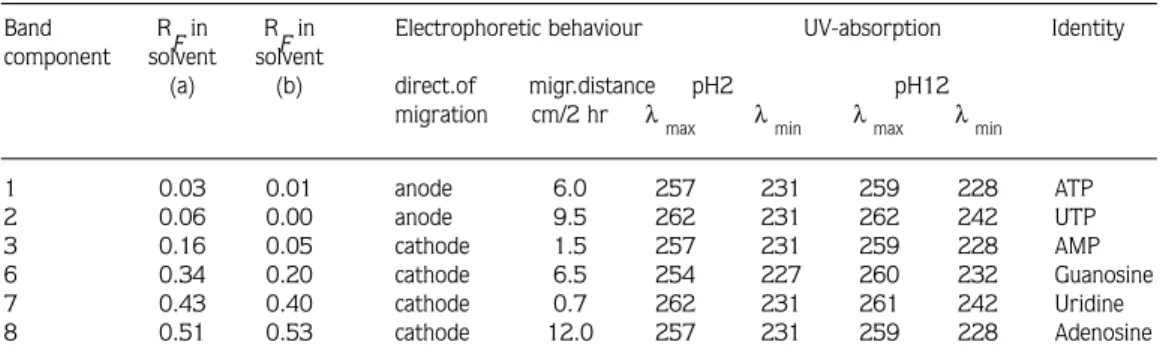
2.Glycine max: The same technique as that used for identification of the compounds in the Phaseolus aureus seedlings extract was applied to Glycine max seedlings. After paper chomatography in solvent (a), eight bands were visible under UV-light. The examination and, where possible, identification of these bands follows:
Band 1: Paper chromatography in solvent (a) produced a blue band of RF 0.03. This band was re-chromatographed in solvent (b), and resulted in two bands of RF 0.01 and 0.07, respectively. High voltage paper electrophoresis of the band with the RF value of 0.01 separated
Band R
Fin RFin Electrophoretic behaviour UV-absorption
component solvent solvent
(a) (b) direct.of migr.distance pH2 pH12
migration cm/2hr λ
max λmin λmax λmin
1 0.03 0.01 cathode 1.4 256 244 257 247 cathode 5.5 261 250 0.09 cathode 2.6 259 240 258* 238 2 0.06 0.02 anode 10.5 276 246 271 260 0.08 anode 7.0 264* 232 273* cathode 3.4 262 247 265 248 3 0.18 0.08 cathode 4.3 265 240 239* 0.19 anode 2.7 253/281 241 253 242 4 0.26 0.15 anode 12.0 269 249 282 260 0.37 cathode 7.2 259 233 260 238 5 0.34 0.01 cathode 3.5 278 243 cathode 8.6 264 247 317 283 0.44 anode 13.8 319 292 354 278 6 0.39 0.01 cathode 4.5 293 248 321 282 0.07 cathode 16.0 305/311 260 0.16 anode 7.0 279 254 0.46 cathode 5.7 276 253 7 0.43 0.12 anode 9.6 258 232 260 236
* inflexion. Solvent systems are described in Methods section. Electrophoresis was with a voltage gradient of 28 V/cm in formic acid: acetic acid: water buffer (40: 50: 910 by vol.) at pH2.
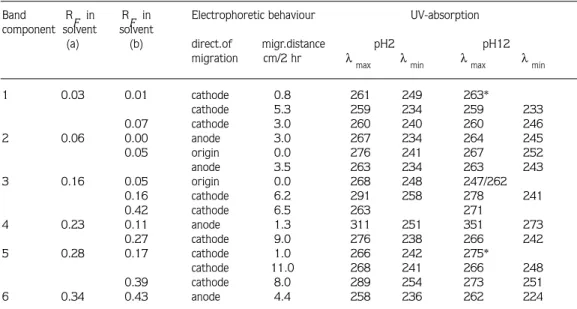
it into three bands. In formic acid:acetic acid: water buffer at pH 2, one of these migrated 6.0 cm towards the anode and other two migrated 0.8 cm and 5.3 cm, respectively, towards the cathode in 2 hr. After UV-spectrophotometric examination, the band which migrated towards the anode appeared to consist of ATP (Table 3). The other two bands from electrophoresis could not be identified (Table 4). The band of RF 0.07 migrated 3.0 cm towards the cathode and was not identifiable by spectrophotometry (Table 4).
Band 2: This band was found to be heterogeneous and to have an RF value of 0.06 in solvent (a). It was re-chromatographed using solvent (b), and two bands were then detected under UV-light ( RF 0.00 and 0.05, respectively).The band of RF 0.00 yielded two bands on high voltage paper electrophoresis in formic acid: acetic acid: water buffer at pH 2, two of which migrated towards the anode, one 3.0 cm and the other 9.5 cm. The other band from solvent (b) also yielded two bands on electrophoresis, one of which remained on the origin, and the other of which migrated 3.5 cm towards the anode. The band which migrated towards the anode 9.5 cm corresponded spectrophotometrically, at pH 2 and pH 12, to UTP (Table 3). The other bands did not appear to be any of the more usual purine or pyrimidine derivatives (Table 4).
Band 3: The RF value of this band was 0.16 in solvent system (a). Following re-chromatography in solvent (b), three bands were seen under UV-light ( RF of 0.05, 0.16 and 0.42, respectively). When these bands were further separated by high voltage paper electrophoresis, the first band yielded two bands, one of which was on the origin and the other of which migrated 1.5 cm towards the cathode. The second and third bands from solvent (b) each resulted in a single band, both of which migrated towards the cathode (6.2 cm and 6.5 cm, respectively, in 2 hr). The band which migrated 1.5 cm towards the cathode was re-chromatographed in solvent (e), yielding an RF of 0.03, and on UV-spectropotometric investigation, corresponded to AMP (Table 3). None of the compounds from the other bands were identifiable (Table 4).
Band R
F in RF in Electrophoretic behaviour UV-absorption Identity component solvent solvent
(a) (b) direct.of migr.distance pH2 pH12
migration cm/2 hr λ
max λmin λmax λmin
1 0.03 0.01 anode 6.0 257 231 259 228 ATP 2 0.06 0.00 anode 9.5 262 231 262 242 UTP 3 0.16 0.05 cathode 1.5 257 231 259 228 AMP 6 0.34 0.20 cathode 6.5 254 227 260 232 Guanosine 7 0.43 0.40 cathode 0.7 262 231 261 242 Uridine 8 0.51 0.53 cathode 12.0 257 231 259 228 Adenosine
Solvent systems are described in Materials and Methods section. Electrophoresis was with a voltage gradient of 28 V/cm in formic acid:acetic acid: water buffer (40: 50: 910 by vol.) at pH 2.
Band 4: This band appeared as a bright blue fluorescence under UV-light and its RF value was 0.23 in solvent system (a). After re-chromatography in solvent (b), again one blue fluorescent band of RF 0.11 and also one weak band of RF 0.27 were observed. When these were individually separated by high voltage paper electrophoresis, each yielded single bands. The blue band migrated 1.3 cm towards the anode and the other, 9.0 cm towards the cathode. They were not identifiable by UV-spectrophotometry (Table 4).
Band 5: In solvent (a), this band had an RF value of 0.28. When it was re-chromatographed in solvent (b), two bands were seen under UV-light with RF values of 0.17 and 0.39, respectively. Upon high voltage paper electroporesis, the band of RF 0.17 yielded two bands and both migrated towards the cathode (1.0 cm and 11, cm respectively). The other band from solvent (b) resulted in a single band which migrated 8.0 cm towards the cathode by electrophoresis. These three bands from the electrophoresis were separately re-chromatographed in solvent (d) and each yielded a single band with RF values of 0.14, 0.19 and 0.34, respectively. As can be seen in Table 4, they did not correspond to any of the more usual purine or pyrimidine derivaties.
Band 6: The RF value of this band was 0.34 in solvent system (a). Under UV-light, it appeared as a blue fluorescence, and darker zones were visible within it. It was re-chromatographed in solvent (b), and yielded four bands with RF values of 0.016, 0.07, 0.20 and 0.43, respectively. When these bands were separately applied to high-voltage paper
Band R
F in RF in Electrophoretic behaviour UV-absorption component solvent solvent
(a) (b) direct.of migr.distance pH2 pH12
migration cm/2 hr λ
max λmin λmax λmin
1 0.03 0.01 cathode 0.8 261 249 263* cathode 5.3 259 234 259 233 0.07 cathode 3.0 260 240 260 246 2 0.06 0.00 anode 3.0 267 234 264 245 0.05 origin 0.0 276 241 267 252 anode 3.5 263 234 263 243 3 0.16 0.05 origin 0.0 268 248 247/262 0.16 cathode 6.2 291 258 278 241 0.42 cathode 6.5 263 271 4 0.23 0.11 anode 1.3 311 251 351 273 0.27 cathode 9.0 276 238 266 242 5 0.28 0.17 cathode 1.0 266 242 275* cathode 11.0 268 241 266 248 0.39 cathode 8.0 289 254 273 251 6 0.34 0.43 anode 4.4 258 236 262 224
* inflexion. Solvent systems are described in Methods section. Electrophoresis was with a voltage gradient of 28 V/cm in formic acid: acetic acid: water buffer (40: 50: 910 by vol.) at pH 2.
electrophoresis, the first yielded a single band which migrated 2.5 cm towards the cathode. The second band yielded two bands, one of which was on the origin and had a blue colour, and the other of which migrated 14 cm towards the anode. The third and fourth bands each resulted in single bands That from the third band migrated 6.5 cm towards the cathode and that from the fourth band migrated 4.4 cm towards the anode. UV-spectrophotometry of the band which migrated 6.5 cm towards the cathode showed the characteristic absorption spectra of guanosine (Table 3). The one which migrated 4.4 cm towards the anode could not be identified (Table 4) and the others yielded non-specific absorption.
Band 7: This was a weak band of R
F0.43 in solvent (a). It yielded a single band in solvent
(b) with an R
Fvalue of 0.40. On high voltage paper electrophoresis in formic acid:acetic acid:
water buffer at pH 2, it migrated 0.7 cm towards the cathode in 2 hr and was seen to be homogeneous. The chromatographic and electrophoretic behaviour and the UV-absorption spectra of this compound were similar to those of uridine (Table 3).
Band 8: The RF value of this band was 0.51 in solvent (a). When it was re-chromatographed in solvent (b), again only a weak band was visible under UV-light with an RF of 0.53. After high voltage paper electrophoresis, a band was detected that migrated 12 cm towards the cathode in 2 hr. It was eluted together with a corresponding blank for spectrophotometry and, as can be seen in Table 3, its UV-absorption spectra corresponded, at both pH 2 and pH 12, to adenosine.
The purine and pyrimidine contents of Phaseolus aureus and Glycine max seedlings were investigated as described above. As all known pyrimidines have ελmaxvalues of the same order of magnitude, the visual appearance of the bands on paper in UV-light is a good guide to concentration and indicates that none of the unidentified compounds represent significant amounts of pyrimidine products. Furthermore, the UV-absorbing components which were not identifiable (Table 2 and 4) by paper chromatography, high voltage paper electrophoresis, or by their UV-absorption spectra, had chromatographic, electrophoretic and spectrophotometric properties different from those of any known pyrimidine-derived secondary products. Additionally, after separation of these plant extracts by paper chromatography and/or electrophoresis, the papers were dipped into ninhydrin solution (0.2% w/v in acetone), but nothing unusual appeared. The results presented here (Table 1 and 3) therefore show that these plants do not accumulate any significant amount of a pyrimidine-derived secondary product.
It was concluded that Phaseolus aureus and Glycine max could be suitable for use as examples of non-producers for comparison with plants which form pyrimidine-derived secondary products, in studies concerning the interface between pyrimidine primary and secondary metabolism.
Reference
1. Brown, E.G. and Silver, A.V. The natural occurence of uracil 5-peptide and its metabolic relationship to guanosine 5’-monophosphate. Biochim. Biophys. Acta. 119: 1-10, 1966.
2. Lambein, F. and Van Parijs, R. Isolation and characterization of 1-alanyl-uracil (willardiine) and 3-alanyl-uracil (isowillardiine) from Pisum sativum. Biochem. Biophys. Res. Commun. 32: 474-479, 1968.
3. Brown, E.G. and Mangat, B.S. Structure of a pyrimidine amino acid from pea seedlings. Biochim. Biophys. Acta. 177: 427-433, 1969.
4. Bell, E.A. Isolation of a new amino acid from Lathyrus tingitanus. Biochim. Biophys. Acta. 47: 602-603, 1961. 5. Nowacki, E. and Przybylska, J. Tingitanine, a new free amino acid from seeds of Tangier pea(Lathyrus tingitanus).
Bull. Acad. Polon. Sci. Ser. Sci. Biol. 9: 279-283, 1961.
6. Ramachandran, L.K. and Rao. K.K. The occurrence of putrescine and a new guanidino amino acid in seeds of Lathyrus tingitanus. Biochem. Biophys. Res. Commun. 13: 49-53, 1963.
7. Gmelin, R., Strauβ, G. and Hasenmaier, G. Über neue Aminosäuren aus Mimosacean. Hoppe Seylers Zetischrift Fur Physiologische Chemie. 314: 28-32, 1959.
8. Kjaer, A. and Olesen Larsen, P. Amino acid studies. Part II. Structure and synthesis of Albizziine (L-2-Amino-3-uredopropionic acid), an amino acid from higher plants. Acta Chem. Scan. 13: 1565-1574, 1959.
9. Ashworth, T.S., Brown, E. G. and Roberts, F.M. Biosynthesis of willardiine and isowillardiine in germinating pea seeds and seedlings. Biochem. J. 129: 897-905, 1972.
10. Al-Baldawi, N.F. and Brown, E.G. Metabolism of ( 6-14C) orotate by shoots of Pisum sativum, Phaseolus vulgaris andLathyrus tingitanus. Phytochem. 22: 419-421, 1983.
11. Ahmmad, M.A.S., Maskall, C.S. and Brown, E.G. Partial purification and properties of willardiine and isowillardiine synthase activity from Pisum sativum. Phytochem. 23: 265-270, 1984.
12. Brown, E. G. and Al-Baldawi, N.F. Biosynthesis of the pyrimidinyl amino acid lathyrine by Lathyrus tingitanus L. Biochem. J. 164: 589-594, 1977.
13. Brown, E.G. and Mohamad, J.Biosynthesis of lathyrine; A novel synthase activity. Phytochem. 29: 3117-3121, 1990.
14. Brown, E.G. and Mohamad, J. Partial purification and properties of lathyrine synthase. Phytochem. 36: 285-287, 1994.
15. Brown, E.G. and Turan, Y. Pyrimidine metabolism and secondary product formation; Biogenesis of albizziine, 4-hydroxyhomoarginine and 2,3-diaminopropanoic acid. Phytochem. 40: 763-771, 1995.
16. Brown, E.G. and Turan, Y. Formation of albizziine and 2,3-diaminopropanoic acid from uracil in Albizia seedlings. Phytochem. 41: 1491-1495, 1996.
17. Brown, E.G. The acid-soluble nucleotides of mature pea seeds. Biochem. J. 85: 633-640, 1962.
18. Anderson, R.A. and Sowers, J.A. Optimum conditions for banding of plant phenols to insoluble polyvinylpyrrolidone. Phytochem. 7: 293-301, 1968.
19. Dent, C.E. The amnino-aciduria in Fanconi Syndrome. A study making extensive use of techniques based on paper partition chromatography. Biochem. J. 41: 240-253, 1947.