Localization of Diagnostically Relevant Regions of
Interest in Whole Slide Images
Ezgi Mercan∗, Selim Aksoy†, Linda G. Shapiro∗, Donald L. Weaver§, Tad Brunye ¶, Joann G. Elmore‡ ∗Dept. of Computer Science & Engineering, University of Washington, Seattle, WA 98195, USA
†Dept. of Computer Engineering, Bilkent University, Bilkent, 06800, Ankara, Turkey ‡Dept. of Medicine, University of Washington, Seattle, WA 98195, USA §Dept. of Pathology , University of Vermont, Burlington, VT 05405, USA
¶Dept. of Psychology , Tufts University, Medford, MA 02155, USA E-mail:{ezgi@cs, shapiro@cs, jelmore@u}.washington.edu [email protected], [email protected], [email protected] Abstract—Whole slide imaging technology enables
patholo-gists to screen biopsy images and make a diagnosis in a digital form. This creates an opportunity to understand the screening patterns of expert pathologists and extract the patterns that lead to accurate and efficient diagnoses. For this purpose, we are taking the first step to interpret the recorded actions of world-class expert pathologists on a set of digitized breast biopsy images. We propose an algorithm to extract regions of interest from the logs of image screenings using zoom levels, time and the magnitude of panning motion. Using diagnostically relevant regions marked by experts, we use the visual bag-of-words model with texture and color features to describe these regions and train probabilistic classifiers to predict similar regions of interest in new whole slide images. The proposed algorithm gives promising results for detecting diagnostically relevant regions. We hope this attempt to predict the regions that attract pathologists’ attention will provide the first step in a more comprehensive study to understand the diagnostic patterns in histopathology.
I. INTRODUCTION
Cancer is a leading cause of death with over 200 types having different characteristics. The diagnosis for cancer is made through a microscopic examination of a tissue sample by highly-trained pathologists. Even though the daily clinical practice typically involves the use of glass slides and light microscopes, digital pathology has also found widespread use in medical education, research, teleconsultation, and archival systems. Consequently, the development of computer-aided diagnosis systems that analyze digitized biopsy slides has became an important research problem in the medical imaging and pattern recognition domains.
A particularly interesting technological development is the whole slide imaging technology that enables the diagnostic process to be done in digital form. Whole slide imaging involves high-resolution image scanners that consist of illumi-nation systems, microscope optical components, and focusing systems, which produce a virtual slide that is a comprehensive digital rendering of the entire glass slide [1]. The virtual slides are often scanned using objectives with40× magnification that result in an average of100, 000 × 80, 000 pixel images, which are about30 GB in size in uncompressed format. The patholo-gists can navigate these slides over a range of magnifications,
identify regions of interest, and make diagnoses.
Histopathological image analysis aims to imitate this pro-cess with the goal of relieving the workload of the pathologists by filtering out obviously benign areas, providing an objective quantification of the image content to reduce the inter- and intra-observer variations in the diagnoses, and serving as a second reader to provide an additional diagnosis for borderline cases [2]. Most of the previous work focused on the classifica-tion of manually selected regions of interest involving feature extraction, feature selection, and supervised learning tasks. However, manual selection of the image areas that contain isolated tissue structures with no ambiguity regarding their diagnoses ignores the localization problem that involves the identification of regions of interest in new large images. Lo-calization of diagnostically relevant regions of interest in whole slide images is a different problem than the categorization of manually identified regions. In the latter, features belong to the same context, and the classification typically involves the discrimination of cancerous cases from benign cases. In the former, it is difficult to determine which pixel neighborhoods are related and should be modeled together. The two tasks also have different false positive versus true positive accuracy requirements. A gold standard for localization is more difficult to establish. Indeed, it is known that pathologists may pay more attention to different parts of the whole slide, and even when they look at the same locations, they may come up with different diagnoses [3].
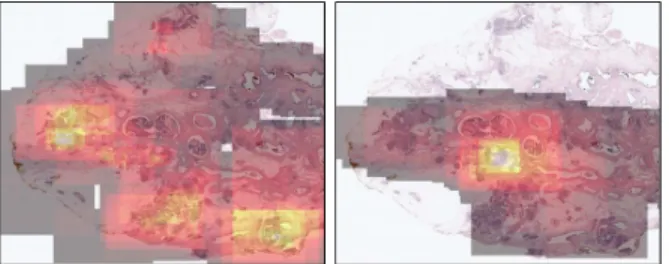
In this paper, we focus on the localization of diagnostically relevant regions of interest (ROI) in whole slide images. Our goal is to develop an ROI detector that makes a binary decision (relevant versus non-relevant) for given image windows. We use the viewport tracking data of three pathologists to generate the training and test examples. The tracking data contain the screen coordinates together with time logs to describe the viewing behavior of the pathologists on challenging breast histopathology images; examples are shown in Figure 1. The logs show which parts of the images are viewed by each pathologist and for how long.
Given a set of logs for multiple different whole slide images, we must create feature vectors that can be used 2014 22nd International Conference on Pattern Recognition
Fig. 1. Illustration of the viewing behavior of two pathologists as heat maps indicating the amount of time a particular pathologist spent on a particular image area. The heat maps are computed using cumulative time spent on each pixel throughout the whole viewing session. Brighter values indicate longer viewing times. Note that different pathologists can have very different viewing behavior.
to classify ROIs. First, we apply a set of rules to identify important actions such as zoom-in, zoom-out, panning and fixation in the viewport logs. Using the selected viewports, we train a binary model using logistic regression and support vector machines for predicting ROIs in new images. The image features used consist of color histograms computed in the L*a*b* space and texture features computed using local binary patterns for small image patches. The features from these patches are used to build a codebook for computing a bag-of-words representation for larger image windows. The final decision is made using sliding windows in whole slide images, and the accuracy is computed by comparing the windows that are classified as relevant to the windows identified from the pathologists’ logs.
The rest of the paper is organized as follows. Section II discusses the related work. Section III describes the data set used in this study. Section IV presents the methodology that is used to identify important actions in the viewport logs. Section V describes the bag-of-words representation and the following classification framework. Section VI presents the experiments using whole slide breast histopathology images. Finally, Section VII provides the conclusions.
II. RELATED WORK
Histopathological image analysis studies often focus on methods that are specifically designed with respect to the peculiarities of the tissue type and structure under investigation as well as the biopsy type and the particular staining used. Since our work involves breast biopsy images, our discussion of the related work in this section mainly focuses on the breast histopathology domain with some related examples from other tissue types and whole slide image analysis.
The typical workflow in the literature for histopatholog-ical image analysis involve the identification of regions of interest, feature extraction, feature selection, and supervised classification. As discussed above, identification of regions of interest are often done manually via expert pathologists. Feature extraction from these regions typically involves color information in the RGB or L*a*b* color spaces and texture features computed in terms of co-occurrence, Gabor or local binary pattern statistics [4], [5], [6], [7], [8], [9], [10]. Another feature of interest involves structural modeling of image win-dows by first segmenting nuclei, and then computing features from the graphs constructed using Voronoi tessellation,
Delau-nay triangulation, or minimum spanning tree representations of the nuclei locations [4], [5], [6] or neighborhood graphs of the nuclei [11]. Other features such as counts of nuclei within image windows, angles representing the arrangements of nuclei, and texton histograms are also used [11]. Both the color and texture features as well as the structural features are computed globally from the whole image windows, as the localization problem is ignored.
Given a large number of features, feature selection is typically used to reduce their number and find the most informative ones. This is often performed via well-known feature reduction and selection algorithms such as principal components analysis [6], sequential floating forward search [7], [8], minimum redundancy maximum relevance feature selection [10], and spectral clustering [5]. Finally, classification is done either in the binary setting of benign versus cancerous images or by using a small number of unambiguous and relatively easy classes. Examples for learning and classification methods include k-nearest neighbor classifiers [8], support
vector machines [4], [5], [6], [11], random forest classifiers [10], classifier ensembles [7], and multiple instance learning [9], [12].
Analysis of whole slide images, also studied in this paper, leads to a different framework where sliding windows are used to analyze all image areas. This involves the use of conven-tional feature extraction methods discussed above in multi-scale [7], [8], [13] and multi-field-of-view [10] settings to characterize the image content at multiple scales and perform the analysis task at an acceptable speed. This typically involves the use of multi-processor computer systems or computer clusters [8], [14].
An important observation that we made while working with multiple pathologists is that there may be important differences among the pathologists’ beliefs regarding the relevance and importance of different tissue features toward making the final diagnosis for the whole biopsy slides. However, none of the prior studies discussed in this section considers these differ-ences, and perform both training and performance evaluation by using manually selected regions of interest for which there is no ambiguity about the diagnoses. A notable exception is described in [15] where color histograms are used with a support vector machine classifier for identifying diagnos-tically relevant regions in whole slide images. However, the experiments presented in that paper use a very limited data set for evaluation, so the high accuracy rates may be difficult to justify for this difficult task. Our study differs from all of the above in the fact that both the training data and the test data are obtained from the pathologists’ viewing logs for full whole slide images, and the proposed work aims to develop a region-of-interest detector which is similar in a sense to a visual saliency operator for identifying diagnostically relevant regions in breast biopsy slides.
III. DATA SET
The data used in this work is collected in the scope of
Digital Pathology (digiPATH) project that aims to evaluate the
accuracy and efficiency of pathologist’ interpretation of digital images vs. glass slides. The complete data set consists of 240 digital images of breast biopsies from 5 different diagnostic
categories ranging from benign to cancer. The biopsies were selected from diagnostically difficult cases in the Breast Can-cer Surveillance Consortium archives [16]. The H&E stained biopsy slides were scanned at 40X magnification, resulting in an average image size of 90, 000 × 70, 000 pixels. Each image is interpreted independently by 3 expert pathologists, who specialize in breast pathology clinically and are involved in teaching and research, and 20 community pathologists for diagnosis, with involvement of total of 200 pathologists.
One of the specific aims of digiPATH is to analyze recorded viewing data of pathologists to identify visual scanning pat-terns associated with diagnostic accuracy and efficiency. To this end, detailed eye-tracking and cursor-tracking data are being collected while pathologists interpret digital slides using a software package similar to Google Maps. The software allows panning and zooming actions of high-resolution digital images and records the changes on the screen. At the end of a tracking session, participants are asked to provide a diagnosis and to draw a rectangle around the region that is most relevant to their diagnosis. Data collection from pathologists is ongoing, and some images have not yet been interpreted.
In this work, we selected a subset of 20 images from the original digiPATH data. Our subset represents 5 cancer categories and their relative difficulties as in the original dataset. We using the tracking logs of three expert pathologists and diagnostically relevant regions of interest marked by these pathologists.
IV. ROIDETECTION IN VIEWPORT TRACKING DATA
A viewport is the visible part of the actual image on the pathologist’s screen. Each entry on the viewport log corre-sponds to a rectangular part of the actual image, which is defined by the actual image coordinates with respect to the top-left pixel on the screen, the screen size and the zoom level (Figure 2). From the viewport information, we calculate the displacement between two log entries as the number of pixels between the centers of two consecutive viewports. Each viewport log entry also contains a time stamp that we use to calculate the duration a pathologist viewed the rectangular viewport to which a log entry corresponds. We developed an algorithm to detect possible regions of interest from the viewport tracking data, using the zoom level, displacement and duration information associated with each log entry.
We define three actions over the viewport tracking data: Zoom peak, slow panning and fixation. Zoom peaks are the points where the zoom level is higher than the previous and the next viewport logs. A zoom peak defines an area where pathologist intentionally looked closer by zooming in. Slow
pannings are the points where the zoom level is constant
and displacement is small. We used a 100 pixel threshold on the screen level (100 × zoom on the actual image) to define slow pannings. The quick pans intended for moving the viewport to a far region result in a high number of pixels in displacement, and they are eliminated by our threshold. In comparison, slow pannings are intended for investigating a slightly larger and closer area without completely moving the viewport. Fixations are the points where the duration is longer than2 seconds. A fixation captures the areas to which a pathologist paid extra attention by investigating them longer.
Since different pathologists can have very different viewing behavior, combination of these three actions were necessary to identify the regions of interest from the viewport logs.
Zoom peak:
zoom(i) > zoom(i − 1)
zoom(i) > zoom(i + 1) (1)
Slow panning:
zoom(i) = zoom(i − 1)
displacement(i) < zoom(i) ∗ 100 pixel (2)
Fixation:
duration(i) > 2 sec (3)
(a)
(b)
Fig. 2. (a) An example visualization of the viewport log of a particular pathologist for the image in (b). The x-axis represents the log entry. The red bars represent the zoom level, the blue bars represent the displacement, and the green bars represent the duration. The zoom and duration values are shown on the vertical axis on the right of the figure, and the displacement values are shown on the vertical axis on the left of the figure. Note that the x-axis is not time; the actual time spent on each viewport is shown by the height of the green bars. The three types of selected actions are circled on the bars. (b) The rectangular regions visible on the pathologist’s screen at the points selected from viewport log are drawn on the actual image. A zoom peak is a red circle in (a) and it corresponds to a red rectangle in (b), a slow panning is a blue circle in (a) and it corresponds to a blue rectangle in (b), a fixation is a green circle in (a) and it corresponds to a green rectangle in (c).
After analyzing viewport tracking logs, the areas that correspond to one of zoom peak, slow panning or fixation points are marked as regions of interest. See Figure 2 for an example visualization. In other words, the union of all the viewport rectangles that correspond to these three actions is marked as a collection of the diagnostically important regions [17]. We would like to be able to predict such regions in new whole slide images.
V. ROIPREDICTION IN WHOLE SLIDE IMAGES
The bag-of-words model is a simple yet powerful represen-tation technique based on frequency of basic blocks (words). It is commonly used in document classification and has also been used for computer vision [18]. In this work, we are using the bag-of-words model to detect salient regions from whole slide images that are expected to be looked at by a pathologist and to be diagnostically relevant. This is designed as a basic but efficient and effective first step toward predicting the regions that attract pathologists’ attention. For this purpose, a word is a 120 × 120 pixel patch cut from a whole slide image. A bag is a3, 600 × 3, 600 pixel window also cut from a whole slide image, and each bag is a collection of words.
A. Building Visual Vocabulary
A visual vocabulary is a collection of image patches, each of which corresponds to a distinct word in the bag-of-words model. In order to build a vocabulary, all candidate visual
words (120×120 image patches) are extracted from the regions
marked as diagnostically relevant by experts.
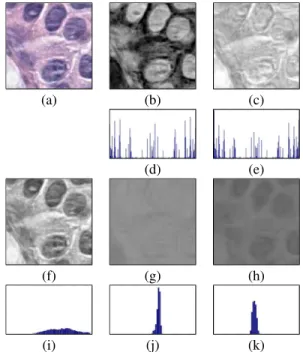
We selected two widely used features, LBP [19] and L*a*b* histograms, to represent visual words. For the first set of features, a well-known color deconvolution algorithm [20] is used to calculate one gray-scale image for the structures dyed with haematoxylin and one for the structures dyed with eosin. Then, LBP histograms are calculated on these two gray-scale images separately and are concatenated. The second set of features contains three color histograms that are calculated separately on CIE-L*a*b* color space channels and concatenated (see Figure 3).
We used an efficient implementation of the K-means algo-rithm [21] to cluster the candidate words and obtained cluster centers as the words from which to build a visual vocabulary. Since the number of clusters gives the vocabulary size, we tried different values of K with LBP, L*a*b* and concatenated LBP+L*a*b* features.
B. Bag-of-Words Representation
In document classification, each document is represented by a vector of word frequencies. Similarly, a histogram is calculated for each visual bag that is a 3, 600 × 3, 600 pixel window from a whole slide image. We used a sliding win-dow approach for extracting 3, 600 × 3, 600 pixel windows overlapping by 2, 400 pixels both horizontally and vertically. Each sliding window contains 30 × 30 = 900 patches that are visual words. First, each of these patches is assigned the cluster number of the closest cluster center calculated by K-means in the previous step. Conceptually, each sliding window is represented as a collection of visual words from the vocabulary. Then, a histogram with the same size as the vocabulary is calculated for each sliding window. The histogram represents the frequency of each cluster in that sliding window.
C. Binary Classification
The problem of detecting diagnostically relevant regions can be formulated as a classification problem. Using a sliding window approach, each3, 600×3, 600 pixel region is classified
(a) (b) (c)
(d) (e)
(f) (g) (h)
(i) (j) (k)
Fig. 3. (a) Original120 × 120 pixel patch, (b) deconvolved color channel that shows good contrast for nuclei dyed with haematoxylin, (c) deconvolved color channel that shows good contrast for eosin dye, (d) LBP histogram calculated on haematoxylin channel, (e) LBP histogram calculated on eosin channel, (f, g, h) L, a and b channels of the image in L*a*b* color space, (i, j, k) color histograms of L, a and b channels. At the end, LBP histograms on two channels are concatenated to produce the first set of features, color histograms on L*a*b* channels are concatenated to produce the second set of features.
(a) (b) (c)
(d) (e) (f)
Fig. 4. Example results from the K-means clustering. Each set shows 16 example patches from a cluster produced by the K-means algorithm with 100 clusters on LBP+L*a*b* features. Each cluster corresponds to a visual word and will be used to build visual vocabulary. Note that the example patches from the same cluster shows similar texture and color characteristics.
as either relevant or not. We trained a classifier using the positive samples from the regions marked by experts and the negative samples from the rest of the image.
Training set: Expert pathologists evaluated each of the
whole slide images and marked at least one area that is diagnostically important. Using the same sliding window and bag-of-words approach, we calculated histograms for these regions and used them as positive samples. We randomly
sampled the unmarked parts of the whole slide images and collected equal number of sliding windows as negative samples from each image.
Test set: After training the classifier, each sliding window
of size3, 600 × 3, 600 pixel is used as a test sample.
Ground truth: As explained in Section IV, a set of
ROIs for each whole slide image is calculated by analyzing viewport tracking data. These ROIs are the regions that attract the attention of the pathologist and therefore are expected to be diagnostically important. The purpose of classification is to assign a positive label to sliding windows that overlap with these regions. Thus while the classifiers were trained on regions that the pathologists explicitly declared to be of diagnostic importance, they were tested on a larger set of regions that attracted their attention and were marked as ROIs as explained in Section IV.
In the classification task described above, we used logistic regression and support vector machines, both of which are linear classifiers that assign a score to predicted class.
VI. EXPERIMENTS
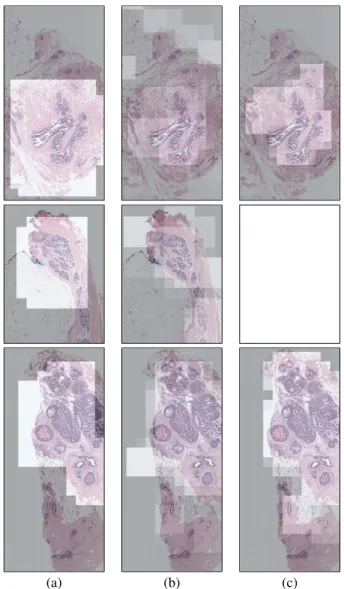
In order to evaluate the performance of the trained clas-sifiers, we ran 10-fold cross-validation experiments. In each fold, we trained a classifier with positive and negative samples from 18 images and tested with a sliding window on 2 test images. Both logistic regression and SVM models produce a probability for each sliding window. Since our sliding windows overlap, we pick the maximum probability for each pixel from its corresponding windows. Figure 5 shows examples of ground truth compared with the probability maps produced by logistic regression and SVM. Ground truth can be inter-preted as the areas the pathologist actually looked at for a considerable amount of time, whereas the probability maps are the predictions of our model about where the pathologist is expected to look.
Quantitative evaluations were made by comparing each sliding window label to the ground truth. We compared two classifier models (logistic regression and SVM), three feature sets (L*a*b*, LBP and LBP+L*a*b*) and two visual vocabu-lary sizes (K=50 and K=100).
TABLE I. COMPARING THE CLASSIFICATION ACCURACY FOR DIFFERENT CLASSIFIERS,FEATURES AND VOCABULARY SIZES.
L*a*b* LBP LBP+L*a*b*
LogReg K=50 73.70 72.80 73.13
K=100 73.38 75.52 75.01
SVM K=50 78.73 79.60 79.16
K=100 78.57 78.88 78.63
The classification accuracies for different settings are re-ported in Table I. The SVM model results in higher accuracy (79.60% at best) than the logistic regression (75.52% at best) in each case, while there is small difference between feature sets with both classifiers. Except for logistic regression with vocab-ulary size 50, LBP results in higher accuracy, which indicates that texture and structure is a better indicator of diagnostically relevant regions than only color. Vocabulary size, K, has also an insignificant effect on accuracy. Increasing vocabulary size
from K=50 to K=100 helps the logistic regression achieve higher accuracy while it is insignificant for the SVM, which already scores better with a smaller vocabulary.
(a) (b) (c)
Fig. 5. Probability maps: (a) Ground truth calculated by analyzing the viewport logs. (b) Map showing the probabilities assigned by the logistic regression. (c) Map showing the probabilities assigned by the SVM (with LBP histograms and K=50).
In our experiments, a detection means that the score assigned to a window by the classifier is higher than0.5. See Figure 5 for example heat map images of the probabilities assigned by the classifiers to each window, where a brighter area means a higher probability. Our results show a nice overlap with the ground truth. Sometimes the ground truth regions contain parts of the background because the pathologist actually views the structure in the middle of the screen and the whole area on the screen is recorded in viewport logs and picked by our algorithm. Consider the part of background in Figure 5 (a) that is classified as ’not relevant’ by both classifiers. The quantitative evaluation considers these areas
false negatives even though the area picked by the classifiers
VII. CONCLUSIONS
This work focuses on localization of regions of interest in whole slide images of breast biopsy slides. We are making the first attempt at understanding the viewing patterns of the pathologists by predicting the areas that are diagnostically relevant. This work constitutes the first step in understanding the relationship between whole slide scanning patterns and diagnostic accuracy and efficiency.
Our purpose is to learn the image characteristics of a region that attracts the attention of the pathologist and to detect these regions of interest in unseen whole slide images. The localization of ROIs is a well known problem in medical image analysis but there is no generic approach that applies to all kinds of whole slide imaging. In this paper, we apply the well known bag-of-words model to score a whole slide image according to diagnostic relevancy. We compare our scores to actual viewing data from pathologists, and we propose a simple analysis to extract regions that attract attention from view logs. Our experiments show that the standard image characteris-tics like color and texture are important factors that direct the pathologist’s attention to specific areas. The further analysis of these regions of interest could lead to identification of viewing patterns associated with accurate and efficient diagnosis. We hope the data and initial analysis methodology introduced in this paper promise a novel approach to learn from pathologists’ scanning behavior to better understand their whole slide image analysis methods.
ACKNOWLEDGMENT
This work was supported by the National Cancer Institute under Grant No. R01-CA172343 and Grant No. K05 CA 104699. S. Aksoy was supported in part by a Fulbright Visiting Scholar grant.
REFERENCES
[1] F. Ghaznavi, A. Evans, A. Madabhushi, and M. Feldman, “Digital imaging in pathology: While-slide imaging and beyond,” Annual Review
of Pathology: Mechanisms of Disease, vol. 8, pp. 331–359, 2013.
[2] M. N. Gurcan, L. E. Boucheron, A. Can, A. Madabhushi, N. M. Rajpoot, and B. Yener, “Histopathological image analysis: A review,” IEEE
Reviews in Biomedical Engineering, vol. 2, pp. 147–171, October 2009.
[3] D. Treanor, C. H. Lim, D. Magee, A. Bulbitt, and P. Quirke, “Tracking with virtual slides: a tool to study diagnostic error in histopathology,”
Histopathology, vol. 55, pp. 37–45, 2009.
[4] S. Doyle, M. Hwang, K. Shah, A. Madabhushi, M. Feldman, and J. Tomaszeweski, “Automated grading of prostate cancer using architec-tural and texarchitec-tural image features,” in IEEE International Symposium on
Biomedical Imaging: From Nano to Macro, Arlington, Virginia, April
12–15, 2007.
[5] S. Doyle, S. Agner, A. Madabhushi, M. Feldman, and J. Tomaszewski, “Automated grading of breast cancer histopathology using spectral clustering with textural and architectural image features,” in IEEE
International Symposium on Biomedical Imaging: From Nano to Macro,
Paris, France, May 14–17, 2008.
[6] S. Naik, S. Doyle, S. Agner, A. Madabhushi, M. Feldman, and J. Tomaszewski, “Automated gland and nuclei segmentation for grading of prostate and breast cancer histopathology,” in IEEE International
Symposium on Biomedical Imaging: From Nano to Macro, Paris,
France, May 14–17, 2008.
[7] J. Kong, O. Sertel, H. Shimada, K. L. Boyer, J. H. Saltz, and M. N. Gurcan, “Computer-aided evaluation of neuroblastoma on whole-slide histology images: Classifying grade of neuroblastic differentiation,”
Pattern Recognition, vol. 42, pp. 1080–1092, 2009.
[8] O. Sertel, J. Kong, H. Shimada, U. V. Catalyurek, J. H. Saltz, and M. N. Gurcan, “Computer-aided prognosis of neuroblastoma on whole-slide images: Classification of stromal development,” Pattern Recognition, vol. 42, pp. 1093–1103, 2009.
[9] M. M. Dundar, S. Badve, V. C. Raykar, R. K. Jain, O. Sertel, and M. N. Gurcan, “A multiple instance learning approach toward optimal classification of pathology slides,” in International Conference on
Pattern Recognition, Istanbul, Turkey, August 23–26, 2010.
[10] A. Basavanhally, S. Ganesan, M. Feldman, N. Shih, C. Mies, J. Tomaszewski, and A. Madabhushi, “Multi-field-of-view framework for distinguishing tumor grade in er+ breast cancer from entire histopathology slides,” IEEE Transactions on Biomedical Engineering, vol. 60, no. 8, pp. 2089–2099, August 2013.
[11] A. Chekkoury, P. Khurd, J. Ni, C. Bahlmann, A. Kamen, A. Patel, L. Grady, M. Singh, M. Groher, N. Navab, E. Krupinski, J. Johnson, A. Graham, and R. Weinstein, “Automated malignancy detection in breast histopathological images,” in SPIE Medical Imaging:
Computer-Aided Diagnosis, 2012.
[12] M. M. Dundar, S. Badve, G. Bilgin, V. Raykar, R. Jain, O. Sertel, and M. N. Gurcan, “Computerized classification of intraductal breast lesions using histopathological images,” IEEE Transactions on Biomedical
Engineering, vol. 58, no. 7, pp. 1977–1984, July 2011.
[13] S. Doyle, M. Feldman, J. Tomaszewski, and A. Madabhushi, “A boosted bayesian multiresolution classifier for prostate cancer detection from digitized needle biopsies,” IEEE Transactions on Biomedical
Engineer-ing, vol. 59, no. 5, pp. 1205–1218, May 2012.
[14] S. Samsi, A. K. Krishnamurthy, and M. N. Gurcan, “An efficient computational framework for the analysis of whole slide images: Application to follicular lymphoma immunohistochemistry,” Journal of
Computational Science, vol. 3, pp. 269–279, 2012.
[15] C. Bahlmann, A. Patel, J. Johnson, J. Ni, A. Chekkoury, P. Khurd, A. Kamen, L. Grady, E. Krupinski, A. Graham, and R. Weinstein, “Automated detection of diagnostically relevant regions in H&E stained digital pathology slides,” in SPIE Medical Imaging: Computer-Aided
Diagnosis, 2012.
[16] N. V. Oster, P. A. Carney, K. H. Allison, D. L. Weaver, L. M. Reisch, G. Longton, T. Onega, M. Pepe, B. M. Geller, H. D. Nelson et al., “Development of a diagnostic test set to assess agreement in breast pathology: practical application of the guidelines for reporting reliability and agreement studies (grras),” BMC women’s health, vol. 13, no. 1, p. 3, 2013.
[17] V. Raghunath, M. O. Braxton, S. A. Gagnon, T. T. Bruny´e, K. H. Allison, L. M. Reisch, D. L. Weaver, J. G. Elmore, and L. G. Shapiro, “Mouse cursor movement and eye tracking data as an indicator of pathologists attention when viewing digital whole slide images,”
Journal of Pathology Informatics, vol. 3, no. 1, p. 43, 2012.
[18] J. Sivic and A. Zisserman, “Efficient visual search of videos cast as text retrieval,” IEEE Transactions on Pattern Analysis and Machine
Intelligence, vol. 31, no. 4, pp. 591–606, 2009.
[19] D.-C. He and L. Wang, “Texture unit, texture spectrum, and texture analysis,” IEEE Transactions on Geoscience and Remote Sensing, vol. 28, no. 4, pp. 509–512, 1990.
[20] A. Ruifrok and D. Johnston, “Quantification of histochemical staining by color deconvolution,” Analytical and Quantitative Cytology and
His-tology/the International Academy of Cytology [and] American Society of Cytology, vol. 23, no. 4, pp. 291–299, 2001.
[21] T. Kanungo, D. M. Mount, N. S. Netanyahu, C. D. Piatko, R. Silverman, and A. Y. Wu, “An efficient k-means clustering algorithm: Analysis and implementation,” IEEE Transactions on Pattern Analysis and Machine