The Effect of Directors’ Index on Firm
Performance: An Evidence from BIST100
Firms
Nida ABDIOGLU
Asst. Prof., Balikesir University Bandirma Faculty of Economics and Administrative Science [email protected]Recep KILIC
Asst. Prof., Balikesir University Bandirma Faculty of Economics and Administrative Science [email protected]Yönetici Endeksi (D-INDEX)’nın Firma Performansı Üzerıne Etkisi: Bist 100 Şirketleri Üzerıne Bir Araştırma
Özet
Bu çalışmada, BIST100 endeksinde yer alan şirketler için kurumsal yönetim kalitesi ve firma performansı arasındaki ilişki incelenmektedir. Kurumsal yönetim kalitesi, temsilci çatışmalarını azaltan bir mekanizma olarak kabul edilmiş ve bu azalışın artan firma performansıyla sonuçlanacağı varsayılmıştır. Çalışmada, Yönetici endeksi (D-INDEX), kurumsal yönetim kalitesinin bir göstergesi kabul edilmiş ve çalışmayı literatürde yer alan benzer çalışmalardan farklılaştırmak amaçlanmıştır. Bu endeksi oluşturmak için Bushee vd. (2010) çalışmasından yararlanılmıştır. Ampirik bulgulara göre D-INDEX’in firma performansı üzerinde herhangi bir etkisi bulunmamıştır. İkinci aşama olarak, firma performansı ve D-INDEX arasındaki ilişki farklı endüstrilerdeki şirketler için incelenmiş ve elektrik endüstrisindeki şirketlerden yüksek kurumsal yönetim kalitesine sahip şirketlerin, yüksek performansa sahip olduğu sonucuna ulaşılmıştır. Söz konusu şirketlerin kurumsal yönetimdeki değişiklikleri çabuk uygulamaya geçirmeleri bu sonuca ulaşmada etkili olmuştur..
Anahtar Kelimeler: Firma Performansı, D-INDEX,
Kurumsal Yönetim Kalitesi, BİST 100, Panel Veri
The Effect of Directors’ Index on Firm Performance: An Evidence from BIST100 Firms
Abstract
This study investigates the relation between corporate governance quality and firm performance of firms listed in Borsa İstanbul 100 index (BIST100). With accepting corporate governance as a mechanism to reduce the agency conflicts between managers and shareholders, we assume that this reduction results with increased firm performance. We differentiate this study from the existing literature by accepting directors’ index (D-INDEX) as a proxy for corporate governance quality for the companies existed in BIST100. We follow Bushee et al. (2010) to create INDEX. Our findings indicate that D-INDEX does not have any effect on corporate performance of BIST100 firms. As a second step, we examine the relation between firm performance and D-INDEX for each industry in our dataset. We find that among the firms in electricity industry those have high level of corporate governance quality have high level of firm performance. We explain this result with the quick adjustments of these firms to the changes in corporate governance.
Keywords: Firm Performance, D-INDEX, Corporate Governance Quality, BIST100, Panel Data
ESKİŞEHİR OSMANGAZİ ÜNİVERSİTESİ İİBF DERGİSİ
254
1. Introduction
Following corporate scandals including those effecting Enron, Tyco, and Worldcom, the implications of corporate governance principles have played a critical role in determining the success of the companies around the world. Turkish Capital Market Board also issued corporate governance principles with the aim of enhancing the corporate governance regulations in July 2003. Calculation of Corporate Governance Index has started in August 2007. By creating the index, regulators thought to increase transparency and governance quality of the market. Following the improvements in Turkish Capital Market in terms of corporate governance quality, this study shed lights the relation between corporate governance quality and performance of firms listed in Borsa İstanbul 100 Index (BIST100). The intuition behind agency theory has motivated us to examine the effect of corporate governance quality on firm performance. Put differently, with accepting corporate governance as a mechanism to reduce the agency conflicts between managers and shareholders, we assume that this reduction results with increased firm performance.
Several strand of literature examine the relation between corporate governance quality and firm performance (Gompers et al., 2003; Bebchuk and Cohen, 2005; Bebchuk et al., 2009). They generally report a higher performance level for the firms which have high level of governance quality. Although growing body of literature examine the effect of different proxies of corporate governance quality on firm performance, we differentiate this study from the existing literature by accepting directors’ index (D-INDEX) as a proxy for corporate governance quality for the companies existed in BIST100. We follow Bushee et al. (2010) to create D-INDEX. This index examines the strength of board characteristics for a particular firm and includes five different dimensions: CEO-chairman duality, the presence of board interlocks, existence of a corporate governance committee, board size and the percentage of independent directors. Since corporate boards are one of the internal corporate governance mechanisms that monitor the management to protect shareholders (e.g., Fama and Jensen, 1983; Hermalin and Weisbach, 2003; Adams and Ferreira, 2007; and Harris and Raviv, 2008), we use the effectiveness of board as a proxy for corporate governance quality.
We examine the relation between corporate governance quality and firm performance for the firms listed in BIST100 between 1999 and 2013. We have 328 firm year observations in our Panel-data set. ‘Return on Assets’ is our proxy for firm performance. We use following firm specific characteristics: total firm assets, operating expenses, liquidity, leverage, firm age and research and development expenditures. We use ‘Fixed Effect Panel Regressions’ in our analysis so that we account for time-invariant firm-level omitted variables that could bias our results.
Our findings indicate that D-INDEX does not have any effect on corporate performance of BIST100 firms. As a second step, we examine the relation between firm performance and D-INDEX for each industry in our dataset. We find that among the firms in electricity industry those have high level of corporate governance quality have high level of firm performance.
The remainder of the paper is organized as follows. In Section 2, we provide a review of related literature. In Section 3, we present our hypotheses. Section 3 provides details of the data and methodology. In Section 4, we report our main findings. We conclude in Section 6.
2. Literature Review
Prior empirical work examines the relation between corporate governance and firm performance by taking into account different proxies for corporate governance quality. By creating a Governance Index which includes 24 distinct corporate governance provisions, Gompers et al. (2003) find a positive relation between corporate performance and strong shareholder rights. They find an evidence for an investment strategy which focus on purchasing shares in the firms with strong shareholder rights and sell shares in the firms with weak shareholder rights. This strategy results with increased abnormal returns. In contrast to the findings of Gompers et al. (2003), Core et al. (2006) do not find that weak governance causes weak stock returns. Core et al. (2006) investigate whether stock returns for strong governance firms are greater than weak governance firms. Their results do not support the positive relation between strong shareholder rights and corporate performance.
In addition, Bebchuk and Cohen (2005) find a negative relation between staggered boards and Tobin’s Q. They do not analyse which IRRC provision other than staggered boards has a negative impact on firm value. However, Bebchuk et al. (2009) analyse which particular governance provisions used by Gompers et al. (2003) are affective on firm value. Although Gompers et al. (2003) use aggregate of provisions provided by Investor Responsibility Research Center, Bebchuk et al. (2009) create an entrenchment index (E-INDEX) based on six provisions: staggered boards, limits to shareholder bylaw amendments, poison pills, golden parachutes, and supermajority requirements for mergers and charter amendments. They conclude that these 6 provisions largely drive the reduction in firm value as well as large negative abnormal returns. They do not find any correlation between the other eighteen IRRC provisions not in entrenchment index and firm valuation or abnormal returns.
ESKİŞEHİR OSMANGAZİ ÜNİVERSİTESİ İİBF DERGİSİ
256
Brown and Caylor (2006) create their governance index, Gov-Score, by using 51 Institutional Shareholder Services (ISS) governance factors. They argue that studies using IRRC data can only examine the impact of external governance, although effective corporate governance requires both external and internal proxies. Brown and Caylor (2006) investigate the internal governance provisions matter for firm value. These factors include eight categories of corporate governance including audit, compensation and board of directors. Consistent with the literature they find a positive relation between governance proxy and firm value. In addition, they create an index based on seven provisions from Gov-Score and they find that these provisions drive the relation between governance measure and firm value1.
There is also related strand of the literature which examines the relation between several board characteristics and firm performance. Dahya and McConnell (2005) find a positive association between corporate performance and the ratio of independent directors. Yermack (1996) reports a negative relation between board size and firm performance. Prior studies also examine the effect of different board characteristics on firm performance and they find that board shareholdings, board quality and board diversity also affect board efficiency and firm performance (e.g., Shivdasani, 1993; Shivdasani and Yermack, 1999; Guner et al., 2008; Adams and Ferreira, 2009). Although above studies examine the effect of separate governance characteristics on corporate performance, we use Bushee’s D-INDEX as a proxy for governance quality. By using D-INDEX we aim to measure the average impact of different board characteristics on D-INDEX.
3. Hypothesis
According to Jensen and Meckling (1976), separation between ownership and control leads managers to take decisions in their own interests. However, managers should maximise the value of firm on behalf of shareholders. If they act in their own self-interests and take actions to maximise present value of cash flows they will take from the firm’s operations, this causes large amounts of agency costs. Denis and McConnell (2003, p. 2) define corporate governance as: “the set of mechanisms -both institutional and market based- that induce the self-interested controllers of a company (those that make decisions regarding how the company will be operated) to make decisions that maximize the value of the company to its owners (the suppliers of capital)”. Thus, corporate governance mechanisms have an important role in reducing the agency cost by monitoring managers’ actions and as
1 Brown and Caylor (2006, pg. 416) use following provisions: “(1) board members are elected annually; (2) company
either has no poison pill or one approved by shareholders; (3) option re-pricing did not occur within the last three years; (4) average options granted in the past three years as a percentage of basic shares outstanding did not exceed 3%; (5) all directors attended at least 75% of board meetings or had a valid excuse for non-attendance; (6) board guidelines are in each proxy statement; and (7) directors are subject to stock ownership guidelines.”
a result aligning principals’ goals with those of agents’ goals (Brickley and James, 1987). The reduced agency cost should increase the performance of the firms. Following this idea, we argue that the firms which have high level of governance quality should have higher performance and we test this hypothesis.
Corporate governance mechanisms are characterized as being internal or external to the firm (Denis and McConnell, 2003)2. In this paper, we take into account one
of the internal governance mechanisms: the effectiveness of board. Following Bushee et al. (2010), we use D-INDEX as a proxy for corporate governance quality for the companies. Instead of using a single measure of governance quality, we use D-INDEX which includes 5 different dimensions: CEO-chairman duality, the presence of board interlocks, attendance of board meetings, board size and the percentage of independent directors.
4. Data and Methodology
4.1. Data
We use Public Disclosure Platform to collect both firm specific characteristics and corporate governance data for the period 2009-2013. We include the stocks listed in BIST100 index. When we merge the firm specific characteristics and governance variables we ended up with 328 firm year observations in our Panel-data set3.
4.2. Variables
We closely follow the extant literature in identifying and defining firm specific characteristics that are effective on firm performance. The independent variables used in this study are as follows:
D-INDEX: This variable consists of five different dummy variables for: board size, percentage of independent directors, CEO-chairman duality, presence of board interlocks, and existence of corporate governance committee. Bushee et al. (2010) use ‘attendance of board meetings’ as a fifth dummy variable. Since Public Disclosure Platform does not provide this data, we use ‘existence of corporate governance committee’ as the fifth dummy variable. The proxy for board size is the logarithm of the number of directors (LNDIR). Companies have the highest market value when board size is small. Because communication, coordination and decision making problems are small for these companies (Yermack, 1996). In order to create our second dummy variable, we calculate the percentage of directors that are
2 Monitoring by a board of directors and board characteristics are examples of internal mechanisms. The takeover
market is an example for the external control mechanisms.
3 Existence of missing values in both firm specific characteristics and governance variables drops the number of
ESKİŞEHİR OSMANGAZİ ÜNİVERSİTESİ İİBF DERGİSİ
258
dependent (PNID). By using k-means cluster analysis, we create dummy for PNID which is equal to one (zero) if they are in high (low) group. Since independent directors’ careers do not depend on the firm management, they are considered as effective monitors (Bushee et al., 2010; Rosenstein and Wyatt, 1990; Byrd and Hickman, 1992). Thus, the percentage of directors that are dependent is a proxy for inefficient governance (Bushee et al., 2010). We create our third dummy variable (CEO) which is equal to one if the CEO and chairman positions are combined, and zero otherwise. The combination of the CEO and chairperson positions is accepted as a proxy for poor governance since it means that board will not objectively monitor management (Bushee et al., 2010). Our fourth dummy variable (DLOCK) is equal to one if a director serves on another board, and zero otherwise. According to Bushee et al. (2010, pg.12) “ Interlocked directors (directors who serve on each other’s boards) are considered indicative of “weaker” governance because such directors have reciprocating relationships that create incentives to vote in ways that benefit their counterparts and, hence, themselves (Hallock, 1997).” Finally, since we can not reach the data for attendance of board meetings, we use existence of corporate governance committee (CGC) in a firm as a corporate governance quality measure. As a result we create a dummy variable (CGC) which is equal to one, if a company has not got a corporate governance committee, and zero otherwise. We argue that the existence of corporate governance committee in a firm is a proxy for efficient governance. D-INDEX variable is equal to the sum of these five dummy variables which takes values between zero and five. A value of zero (five) indicates a board with the most effective (weakest) governance structure.
Firm Size (SIZE): We take the logarithm of total assets as a proxy for firm size. Operating Expenses (EXP): We take the logarithm of operating expenses to create this variable.
Liquidity (LIQ): We define liquidity as the ratio of current assets to current liabilities. Leverage (LEV): This variable is the ratio of debt in current liabilities plus long-term total debt to total assets.
Firm Age (AGE): This variable is the number of year that firm listed in BIST100. R&D/Sales (RD): RD is calculated by taking the ratio of Research and Development Expenditures to Net Sales of the firm.
4.3. Methodology
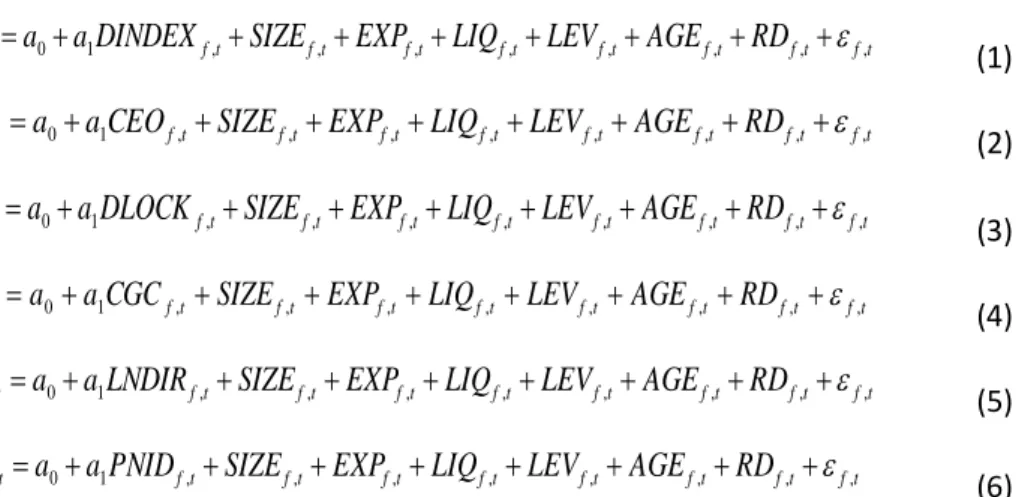
We test our hypothesis with following models:
t f t f t f t f t f t f t f t f t
f a aDINDEX SIZE EXP LIQ LEV AGE RD
ROA, 0 1 , , , , , , , , (1) t f t f t f t f t f t f t f t f t
f a aCEO SIZE EXP LIQ LEV AGE RD
ROA , 0 1 , , , , , , ,
, (2) t f t f t f t f t f t f t f t f tf
a
a
DLOCK
SIZE
EXP
LIQ
LEV
AGE
RD
ROA
,
0
1 ,
,
,
,
,
,
,
, (3) t f t f t f t f t f t f t f t f tf a aCGC SIZE EXP LIQ LEV AGE RD
ROA, 0 1 , , , , , , , , (4) t f t f t f t f t f t f t f t f t
f a aLNDIR SIZE EXP LIQ LEV AGE RD
ROA , 0 1 , , , , , , ,
, (5) t f t f t f t f t f t f t f t f tf a aPNID SIZE EXP LIQ LEV AGE RD
ROA, 0 1 , , , , , , , , (6)
The dependent variable ROAf,t is the Return on Assets in firm f, at time t. It is the ratio of net income to total assets. We use ROA as a proxy for firm performance. Independent variables are explained in section 4.2. We use the value of each independent variable in firm f at time t. The first model tests our main hypothesis in which we argue that firm performance should be higher in higher corporate governance quality firms. We use as a proxy for corporate governance quality in this model. In the other models, we test the effect of each component of D-INDEX on firm performance.
We use fixed effect panel regression in our analysis. Using this regression allows us to account for time-invariant company-level omitted variables that could bias our results. These firm fixed effects control for unobserved heterogeneity in firm characteristics that could affect the performance of firm. We also use year dummies in our regression in order to control for cross-sectional dependence (Gujarati, 2004). This helps us to remove deterministic time trends from our analyses.
5. Empirical Results
Table 1 represents the descriptive statistics of the variables we use in our model. The average firm earned a 6% annual return on assets, has firm age of 1.57 years, and a liquidity of 2.13. The average assets of firms is 21.39, operating expenses is 18.81, RD is 0.004 and leverage is %48. The average directors’ index is 2.76, indicating a below average (i.e. 2.5) level of internal governance quality.
ESKİŞEHİR OSMANGAZİ ÜNİVERSİTESİ İİBF DERGİSİ
260
Table 1:Descriptive Statistics
Variable N Mean Sd p25 p50 p75 ROA 333 0.056 0.074 0.016 0.053 0.085 D-INDEX 333 2.757 1.140 2 3 4 SIZE (ln) 333 21.395 1.394 20.385 21.501 22.329 EXP (ln) 333 18.818 15.470 17.685 18.734 19.686 LIQ 333 2.128 1.884 1.058 1.520 2.312 LEV 333 0.488 0.211 0.332 0.497 0.647 AGE 333 1.568 7.721 10 17 23 RD 328 0.004 0.008 0 0.0002 0.003
Note: This table reports the descriptive statistics for the variables used in this study. ROA is return
on assets which is defined as the ratio of net income to total assets. D-INDEX is the directors’ index. SIZE is firm size which is equal to the logarithm of total assets. EXP is the logarithm of operating expenses. LIQ is liquidity which is defined as the ratio of current assets to current liabilities. LEV is leverage, which is equal to the ratio of total debt to total assets. AGE is firm age defined as the number of year that firm listed in BIST100. RD is the ratio of research and development expenditures to net sales of the firm.
Table 2 reports the pearson correlation coefficient for the variables used in this study. At univariate level, D-INDEX and ROA are positively correlated, indicating that low governance quality firms have high performance. But the correlation is not significant. According to Table 2, only liquidity, leverage and RD have significant relation with ROA. We find a negative relation between firm size and ROA which is consistent with our expectation. Moreover, the table reports a negative relation between leverage and ROA. Firms with high liquidity ratios have higher performance. Finally, ROA is positively and significantly correlated with R&D expenditures.
Table 2: Correlation Matrix
ROA
D-INDEX
SIZE EXP LIQ LEV AGE R
D ROA 1 D-INDEX 0.0964 1 SIZE -0.0262 -0.0194 1 EXP 0.0234 0.0795 0.6739* 1 LIQ 0.3280* -0.0396 -0.2953* -0.3404* 1 LEV -0.3464* 0.006 0.4180* 0.4465* -0.6883* 1 AGE -0.1341 -0.0621 -0.1227 -0.0743 0.0113 -0.1676* 1 RD 0.2641* -0.0241 -0.0237 0.0237 0.3134* -0.1497* -0.0485 1
Note: This table presents the Pearson correlation coefficients of the variables used in this study. ROA is return on assets which is defined as the ratio of net income to total assets. D-INDEX is the directors’ index. SIZE is firm size which is equal to the logarithm of total assets. EXP is the logarithm of operating expenses. LIQ is liquidity which is defined as the ratio of current assets to current liabilities. LEV is leverage, which is equal to the ratio of total debt to total assets. AGE is firm age defined as the number of year that firm listed in BIST100. RD is the ratio of research and development expenditures to net sales of the firm.
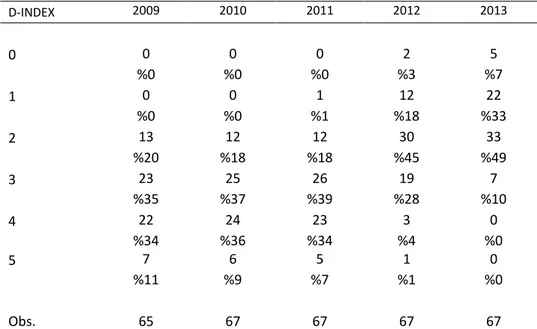
Table 3 shows the time series changes in D-INDEX. In 2009, %35 of the firms has D-INDEX value of 3, and %34 of the firms has D-INDEX value of 4. None of the firms has the highest governance quality (which is shown by D-INDEX value of zero). In 2010 and 2011, large amount of firms have D-INDEX value of 3 or 4. Although in 2011 %18 of the firms have D-INDEX value of 2, this value is %45 in 2012. This increase demonstrates that the corporate governance quality of the firms increases between 2011 and 2012. We can see this jump in D-INDEX, when we compare 2012 and 2013. While %18 of the firms has D-INDEX value of 1, in 2013 this value increases to %33. Also the percentage of firms which have D-INDEX value of 2 increases to %49 in 2013. This increase in corporate governance quality is a result of the issuance of corporate governance principles by Turkish Capital Market Board. Although the corporate governance index principles were introduced in 2005, the adaption of these principles took some time. That’s why we see the effect of these principles in the recent years.
ESKİŞEHİR OSMANGAZİ ÜNİVERSİTESİ İİBF DERGİSİ
262
Table 3:Time Series Changes in D-INDEX
Note: This table shows the time series changes in D-INDEX. The numbers illustrate the number of companies with each score. The percentages are calculated by scaling the number of companies by the total number of observations per year.
We start our multivariate analyses by examining whether there is any relation between D-INDEX and performance of the firms listed in BIST100. Table 4, coloumn 1, reports the results of our main fixed effect panel regression. We use D-INDEX as our main independent variable and examine whether it is effective on ROA. We do not find any significant result for the coefficient of D-INDEX. Thus we conclude that when we accept Bushee’s Directors’ Index as a main proxy for corporate governance quality, the governance quality of our BIST100 firms is not effective on their performance.
We test our main hypothesis by using each component of D-INDEX in different fixed effect panel regressions in Table 4, between the coloumns 2 and 6. In coloumn 2 and in coloumn 3 of Table 4 , we use CEO-Chairman duality and DLOCK as a proxy for governance quality. In the following coloumns of Table 4 we use CGC, LNDIR, PNID as proxies for governance quality. According to our regression results, board size, percentage of independent directors, CEO-chairman duality, presence of board interlocks, and existence of corporate governance committee do not have a significant relation with firm performance. We argue that since the adaption of corporate governance principles by the firms take time, we couldn’t see the effect of it in our regression results. If we examine this relation for a
D-INDEX 2009 2010 2011 2012 2013 0 0 0 0 2 5 %0 %0 %0 %3 %7 1 0 0 1 12 22 %0 %0 %1 %18 %33 2 13 12 12 30 33 %20 %18 %18 %45 %49 3 23 25 26 19 7 %35 %37 %39 %28 %10 4 22 24 23 3 0 %34 %36 %34 %4 %0 5 7 6 5 1 0 %11 %9 %7 %1 %0 Obs. 65 67 67 67 67
longer time period in the future, ie. between 2009-2019, we might find significant results in line with our expectations.
Besides this, we examine the firm specific characteristics that are effective on ROA. We find that large firms have higher firm performance in line with Basti et al. (2011). We also find that firms with less leverage have higher performance following Fang et al. (2009). According to our results, firms with lower level of R&D expenditures have higher performance.
Table 4: The Effect of D-INDEX on Firm Performance
ROA ROA ROA ROA ROA ROA
D-INDEX 0.004 [0.396] CEO -0.011 [0.207] DLOCK 0.012 [0.196] CGC 0.013 [0.212] LNDIR 0.012 [0.601] PNID 0 [0.692] SIZE 0.029* 0.028* 0.033* 0.026 0.030* 0.029* [0.084] [0.097] [0.056] [0.127] [0.082] [0.089] EXP 0.013 0.014 0.013 0.014 0.013 0.013 [0.284] [0.248] [0.302] [0.268] [0.283] [0.294] LIQ -0.008* * -0.008* * -0.007* * -0.008* * -0.008* * -0.008* * [0.025] [0.032] [0.044] [0.021] [0.022] [0.026] LEV -0.268* ** -0.271* ** -0.264* ** -0.271* ** -0.271* ** -0.270* ** [0.000] [0.000] [0.000] [0.000] [0.000] [0.000] AGE 0 -0.002 -0.002 0.002 -0.002 0 [0.942] [0.413] [0.468] [0.654] [0.574] [0.918]
ESKİŞEHİR OSMANGAZİ ÜNİVERSİTESİ İİBF DERGİSİ
264
RD -2.274* -2.007 -2.223* -2.311* -2.259* -2.184 [0.092] [0.140] [0.099] [0.086] [0.094] [0.109] Constant -0.684* -0.624* -0.716* * -0.640* -0.675* -0.664* [0.053] [0.073] [0.043] [0.066] [0.058] [0.062] R-squared 0.03 0.05 0.03 0.02 0.04 0.03 N 328 328 328 328 328 328Year Fixed Effects Yes Yes Yes Yes Yes Yes Firm Fixed Effects Yes Yes Yes Yes Yes Yes
Note: This table presents the results of fixed effect panel regressions which examine the relation between D-INDEX and firm performance. ROA is return on assets which is defined as the ratio of net income to total assets. D-INDEX is the directors’ index. SIZE is firm size which is equal to the logarithm of total assets. EXP is the logarithm of operating expenses. LIQ is liquidity which is defined as the ratio of current assets to current liabilities. LEV is leverage, which is equal to the ratio of total debt to total assets. AGE is firm age defined as the number of year that firm listed in BIST100. RD is the ratio of research and development expenditures to net sales of the firm. CEO measures CEO duality which is equal to one if the positions of CEO and Chairman are combined and zero otherwise. LNDIR is the logarithm of the number of directors. PNID is the percentage of directors that are not independent. To form these indicators, we split the distribution of LNDIR and PNID into high and low groups using k-means cluster analysis. For the high (low) group the variable equals one (zero). DLOCK is equal to one if there are any interlocks on the board of directors and zero otherwise. CGC is equal to one, if a company has not got a corporate governance committee, and zero otherwise. Year dummies (Year FE) are included in all regressions. The numbers in brackets are p-values. * indicates 10% significance level, ** indicates 5% significance level and *** indicates 1% significance level. N is the number of observations.
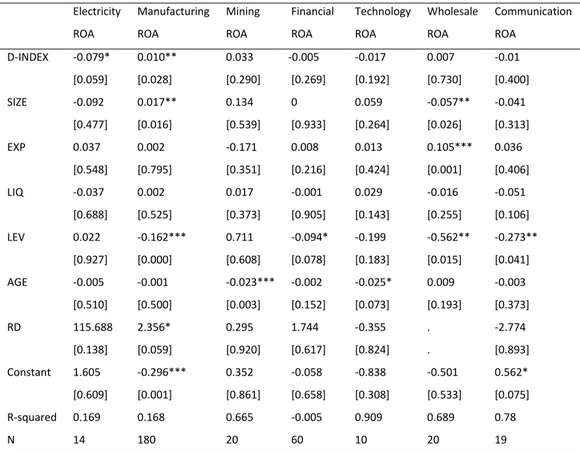
Finally, we compare the effect of D-INDEX on ROA for the firms belong to different industries by using OLS regressions in Table 5. In the first coloumn, we run our OLS regressions for electricity industry. We find that the firms with high governance quality in electricity industry have higher performance. We conclude that since the companies in this sector renovate themselves quickly, they can adapt to the changes immediately. According to coloumn 2, the firms in manufacturing industry have higher performance if they have lower governance quality. Since the sector is stagnant, we might not see the impact of the changes in CG quality rapidly. Even we find a negative relation between CG quality and performance. We do not find any significant results between ROA and D-INDEX for the other industries.
TABLE 5: The Relation between D-INDEX and Firm Performance for Different Industries
Electricity Manufacturing Mining Financial Technology Wholesale Communication ROA ROA ROA ROA ROA ROA ROA
D-INDEX -0.079* 0.010** 0.033 -0.005 -0.017 0.007 -0.01 [0.059] [0.028] [0.290] [0.269] [0.192] [0.730] [0.400] SIZE -0.092 0.017** 0.134 0 0.059 -0.057** -0.041 [0.477] [0.016] [0.539] [0.933] [0.264] [0.026] [0.313] EXP 0.037 0.002 -0.171 0.008 0.013 0.105*** 0.036 [0.548] [0.795] [0.351] [0.216] [0.424] [0.001] [0.406] LIQ -0.037 0.002 0.017 -0.001 0.029 -0.016 -0.051 [0.688] [0.525] [0.373] [0.905] [0.143] [0.255] [0.106] LEV 0.022 -0.162*** 0.711 -0.094* -0.199 -0.562** -0.273** [0.927] [0.000] [0.608] [0.078] [0.183] [0.015] [0.041] AGE -0.005 -0.001 -0.023*** -0.002 -0.025* 0.009 -0.003 [0.510] [0.500] [0.003] [0.152] [0.073] [0.193] [0.373] RD 115.688 2.356* 0.295 1.744 -0.355 . -2.774 [0.138] [0.059] [0.920] [0.617] [0.824] . [0.893] Constant 1.605 -0.296*** 0.352 -0.058 -0.838 -0.501 0.562* [0.609] [0.001] [0.861] [0.658] [0.308] [0.533] [0.075] R-squared 0.169 0.168 0.665 -0.005 0.909 0.689 0.78 N 14 180 20 60 10 20 19
Note: This table reports the relation between firm performance and D-INDEX for different industries existed in our sample. ROA is return on assets which is defined as the ratio of net income to total assets. D-INDEX is the directors’ index. SIZE is firm size which is equal to the logarithm of total assets. EXP is the logarithm of operating expenses. LIQ is liquidity which is defined as the ratio of current assets to current liabilities. LEV is leverage, which is equal to the ratio of total debt to total assets. AGE is firm age defined as the number of year that firm listed in BIST100. The numbers in brackets are p-values. * indicates 10% significance level, ** indicates 5% significance level and *** indicates 1% significance level. N is the number of observations.
6. Conclusion
In this paper, we focus on the effect of corporate governance quality on firm performance. In order to measure governance quality, we use D-INDEX which is a proxy for board effectiveness. Since increased corporate governance quality decreases the agency cost, we expect to find a higher firm performance for those firms which have higher board effectiveness. However, in our empirical results we report that there is not any relation between D-INDEX and firm performance for the firms listed in BIST100. We also investigate whether each indicator of D-INDEX
ESKİŞEHİR OSMANGAZİ ÜNİVERSİTESİ İİBF DERGİSİ
266
is effective in firm performance. Those indicators are: CEO-chairman duality, the presence of board interlocks, existence of corporate governance committee, board size and the percentage of independent directors. We do not find any significant relation between firm performance and each component of D-INDEX. As a result, we conclude that increased corporate governance quality is not a determinant of firm performance. One of the reasons of this insignificant relation should be the sample period we use in this study. In order to see the effect of changes in D-INDEX, the analysis should be made after 2013. As it can be seen in Table 3, D-INDEX value of 1 jumps to %33 in 2013, while it is %18 in 2012. We have to investigate whether D-INDEX will increase in the following years and see whether it is effective in firm performance.
As a second step, we analyse the relation between D-INDEX and firm performance for the firms existed in different industries. While we find a positive relation between corporate governance quality and firm performance for the firms in electricity industry, we find a negative relation for these variables in manufacturing industry. Since the companies in electricity industry renovate themselves quickly, they can adapt to the changes immediately. However, since the manufacturing sector is stagnant, we might not find a positive relation between CG quality and firm performance for this sector. As a future research, the reasons behind different results for different industries might be investigated.
References
Adams, R. and D. Ferreira, 2007. A theory of friendly boards. The Journal of Finance, 62, 217-250.
Adams, R. and D. Ferreira, 2009. Women in the boardroom and their impact on governance and performance. Journal of Financial Economics, 94, 291-309. Basti, E., Bayyurt, N. and A. Akin, 2011. A Comparative Performance Analysis of Foreign and Domestic Manufacturing Companies in Turkey. European Journal of Economics and Political Studies, 4(2), 125-137.
Bebchuk, L., and A.Cohen, 2005. The Costs of Entrenched Boards. Journal of Financial Economics, 78, 409–33.
Bebchuk, L., Cohen, A. and A.Ferrell, , 2009. What Matters in Corporate Governance. The Review of Financial Studies, 22 (2), 783-827.
Brickley, J. and C. James, 1987. The Takeover Market, Corporate Board Composition and Ownership Structure: The Case of Banking. Journal of Law and Economics, 30, 161-180.
Brown, L., and M. Caylor. 2006. Corporate Governance and Firm Valuation. Journal of Accounting and Public Policy, 25, 409–34.
Bushee, B.J., Carter, M.E., J. Gerakos, 2010. Institutional Investor Preferences for Corporate Governance Mechanisms. Working Paper. The Wharton School of the University of Pennsylvania.
Byrd, J., and K. Hickman., 1992. Do outside directors monitor managers? Evidence from tender offer bids. Journal of Financial Economics, 32, 195–221.
Core, J., Guay,W., T. Rusticus, 2006. Does weak governance cause weak stock returns? An examination of firm operating performance and investors' expectations. Journal of Finance, 61, 655–687.
Dahya, J. and J. J. McConnell 2005. Outside Directors and Corporate Board Decisions, Journal of Corporate Finance, 11, 37-60.
Denis, D.K., J.J. McConnell, 2003. International Corporate Governance. Journal of Financial and Quantitative Analysis, 38, 1-36.
Fama, E. F. and M. C.Jensen, 1983. Separation of ownership and control. Journal of Law and Economics, 26, 301-324.
Fang, V.W., Noe, T.H., S. and Tice, 2009. Stock Market Liquidity and Firm Value. Journal of Financial Economics, 94 (1), 150-169.
ESKİŞEHİR OSMANGAZİ ÜNİVERSİTESİ İİBF DERGİSİ
268
Gompers, P. A., Ishii, J.L., and A. Metrick, 2003. Corporate governance and equity prices. Quarterly Journal of Economics, 118, 107–155.
Gujarati, D.N., 2004. Basic Econometrics. The McGraw−Hill Companies.
Guner, A.B., Malmendier, U. and G. Tate, 2008. Financial expertise of directors. Journal of Financial Economics, 88, 323–354.
Hallock, K. 1997. Reciprocally interlocking boards of directors and executive compensation.
Journal of Financial and Quantitative Analysis, 32, 331–44.
Harris, M. and A.Raviv, 2008. A Theory of Board Control and Size. Review of Financial Studies, 21 (4), 1797-1832.
Hermalin, B.E. and M.S.Weisbach, 2003. Boards of directors as an endogenously determined institution: a survey of the economic literature. Economic Policy Review, 9, 7-26.
Jensen, M.C. and W.H., Meckling, 1976. Theory of the firm: managerial behavior, agency costs and ownership structure. Journal of Financial Economics, 3, 305-360 Rosenstein, S., and J. Wyatt., 1990. Outside directors, board independence, and shareholder wealth. Journal of Financial Economics, 26,175–91.
Shivdasani, A. and D., Yermack, 1999. CEO involvement in the selection of new board members: An empirical analysis. The Journal of Finance, 54, 1829-1853 Shivdasani, A., 1993. Board composition, ownership structure, and hostile takeovers. Journal of Accounting and Economics, 16, 167-198
Yermack, D. 1996. “Higher market valuation of companies with a small board of directors.” Journal of Financial Economics, 40, 185-212.