p53 mutation as a source of aberrant b-catenin accumulation in cancer cells
Tolga Cagatay
1and Mehmet Ozturk*
,11
Department of Molecular Biology and Genetics, Bilkent University, 06533 Ankara, Turkey
b-catenin is involved in both cell – cell interactions and wnt pathway – dependent cell fate determination through its interactions with E-cadherin and TCF/LEF transcrip-tion factors, respectively. Cytoplasmic/nuclear levels of b-catenin are important in regulated transcriptional activation of TCF/LEF target genes. Normally, these levels are kept low by proteosomal degradation of b-catenin through Axin1- and APC-dependent phosphoryla-tion by CKI and GSK-3b. Deregulaphosphoryla-tion of b-catenin degradation results in its aberrant accumulation, often leading to cancer. Accordingly, aberrant accumulation of b-catenin is observed at high frequency in many cancers. This accumulation correlates with either mutational activation of CTNNB1 (b-catenin) or mutational inacti-vation of APC and Axin1 genes in some tumors. However, there are many tumors that display b-catenin accumulation in the absence of a mutation in these genes. Thus, there must be additional sources for aberrant b-catenin accumulation in cancer cells. Here, we provide experimental evidence that wild-type b-catenin accumu-lates in hepatocellular carcinoma (HCC) cells in association with mutational inactivation of p53 gene. We also show that worldwide p53 and b-catenin mutation rates are inversely correlated in HCC. These data suggest that inactivation of p53 is an important cause of aberrant accumulation of b-catenin in cancer cells.
Oncogene (2002) 21, 7971 – 7980. doi:10.1038/sj.onc. 1205919
Keywords: b-catenin; p53; mutation; hepatocellular carcinoma; wnt pathway
Introduction
The protein product of b-catenin gene plays a dual role, acting as a structural component of cell – cell adherence junctions, as well as a nuclear transcriptional co-activator when complexed with members of the T-cell factor/lymphoid enhancer factor (TCF/LEF) family of DNA binding proteins (reviewed in Polakis, 2000). Transcription co-activator function of b-catenin is regulated in a concentration-dependent manner based on a controlled proteosome-dependent degrada-tion system. Under cellular condidegrada-tions, which do not
require TCF/LEF-dependent transcription, b-catenin is targeted to the proteosome by casein kinase 1(CKI)-and glycogen synthase kinase-3b (GSK-3b)-mediated phosphorylation of its N-terminally located serine/ theronine residues (Polakis, 2000; Amit et al., 2002; Liu et al., 2002). This phosphorylation occurs in a multi-molecular complex, which contains APC and Axin1 tumor suppressor proteins, in addition to b-catenin and CKI/GSK-3B dual-kinase system. The Wnt signaling is the major known activator of b-catenin and this is achieved by wnt-dependent inhibition of GSK-3b kinase activity leading to accumulation of b-catenin protein in target cells (Barker et al., 2000; Polakis, 2000).
Cytoplasmic and/or nuclear accumulation of b-catenin is a highly frequent event affecting various cancers including colorectal, lung, breast, cervix cancers, melanoma, HCC and hepatoblastoma (Candi-dus et al., 1996; Rimm et al., 1999; Chung, 2000; Johnsson et al., 2000; Lin et al., 2000; Park et al., 2001; Shinohara et al., 2001; Ueda et al., 2001; Hommura et al., 2002; Inagawa et al., 2002). In colorectal cancers, b-catenin accumulation is often associated with muta-tional inactivation of APC gene, which affects almost 80% of these tumors (Kinzler and Vogelstein, 1998). About 50% of colorectal cancers with wild-type APC gene display oncogenic mutations affecting b-catenin directly (Sparks et al., 1998). In hepatoblastomas, APC mutations are rare, but these tumors display b-catenin mutations at very high frequency (Koch et al., 1999; Wei et al., 2000; Park et al., 2001). In other tumors, aberrant accumulation of b-catenin protein is not always associated with a mutation affecting these genes. For example, it has been recently reported that 8 – 13% of HCCs are affected by a b-catenin mutation, whereas 33 – 69% of these tumors display aberrant b-catenin protein accumulation (Hsu et al., 2000; Devereux et al., 2001; Wong et al., 2001). Among other candidate genes, Axin1 was found to be mutated in a small fraction (7 – 9%) of HCCs (Satoh et al., 2000; Laurent-Puig et al., 2001), whereas APC mutations were exceptional, if not absent (Huang et al., 1999). Thus, it is estimated that between 35 and 80% of HCCs, the aberrant b-catenin accumulation is not associated with a mutation affecting b-catenin, Axin1 or APC gene. Aberrant accumulation of catenin protein without associated mutations on b-catenin, APC or Axin1 gene is not limited to HCC, since mutations affecting these genes are absent or exceptional in several other common malignancies such
Received 15 May 2002; revised 22 July 2002; accepted 30 July 2002 *Correspondence: M Ozturk; E-mail: [email protected]
as cancers of the breast, lung and cervix, and melanomas (Candidus et al., 1996; Rimm et al., 1999; Lin et al., 2000; Ueda et al., 2001; Shinohara et al., 2001; Hommura et al., 2002). Thus, in many tumors, aberrant accumulation of b-catenin cannot be linked to a known mutation affecting wnt pathway, raising the possibility that mutations affecting the genes involved in other pathways may also contribute to aberrant accumulation of b-catenin in cancer cells.
Here, we report on aberrant accumulation of wild-type b-catenin protein in association with p53 gene mutation in HCC cells. In addition, ectopic expression of mutant p53 in two different HCC cell lines resulted in the up-regulation of wild-type b-catenin levels. Based on previously published and our own data, we also show that there is an inverse relationship between worldwide distribution of p53 and b-catenin mutation rates in HCCs. These observations suggest that p53 mutations may lead to aberrant accumulation of b-catenin protein in HCC, thereby reducing a selective pressure for b-catenin mutation during hepatocellular carcinogenesis.
Results
Comparative analysis ofb-catenin and p53 genes in hepatocellular carcinoma cell lines
A total of 12 HCC cell lines were analysed for b-catenin gene mutation by SSCP, fragment length analysis and nucleic acid sequencing. Heterozygous b-catenin gene mutations were identified in two cell lines (Table 1). HepG2 cell line displayed an interstitial deletion leading to a truncated protein product lacking amino acids from 25 to 140 (sequencing data not shown, see later for genomic deletion), whereas
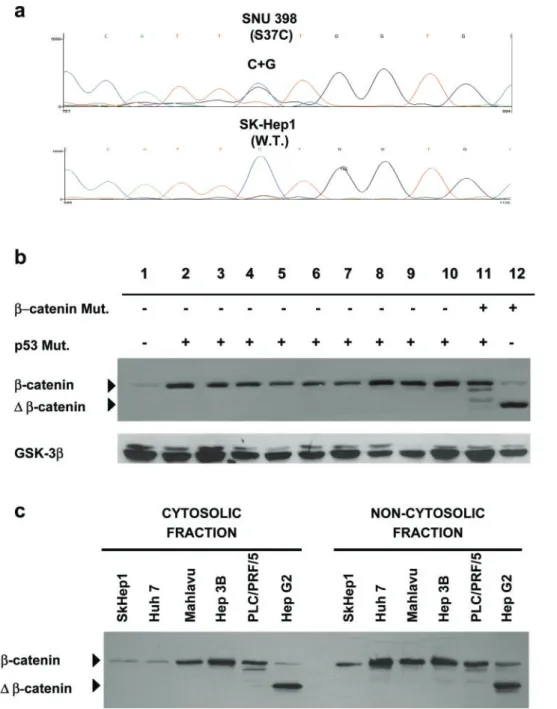
SNU398 cells displayed a heterozygous TCT?TGT mutation leading to a serine to cystein substitution (S37C) of a GSK-3b phosphorylation site in b-catenin protein (Figure 1a). The b-catenin gene was wild type in other cell lines. To our knowledge, b-catenin gene status of SK-Hep1, Mahlavu, SNU387, SNU182, FOCUS and Hep3B has not been reported previously, but we confirmed wild-type status of b-catenin in Huh7, PLC/PRF/5 (Alexander), SNU423 and SNU475 cell lines (Satoh et al., 2000), as well as the interstitial deletion in HepG2 cell line (de La Coste et al., 1998). On the other hand, in our hands, it was SNU398, but not SNU449, which displayed a missense b-catenin mutation, in apparent opposition to previously, published data (Satoh et al., 2000).
Table 1 compares the status of b-catenin and p53 genes in these cell lines. The great majority of HCC cell lines (10 of 12; 84%) displayed a p53 mutation, in contrast to only 2 of 12 (17%) cell lines displaying a b-catenin mutation. Either p53 or b-b-catenin was mutated in these cell lines, except SNU398 cells, which displayed both p53 and b-catenin mutations, and SK-Hep1 wild type for both p53 and b-catenin.
Aberrant accumulation of wild-typeb-catenin in mutant p53 cell lines
We analysed all 12 cell lines for a possible accumula-tion of b-catenin protein by Western blotting. As shown in Figure 1b, both HepG2 and SNU398 displayed a strong increase in the levels of mutant b-catenin proteins. Selective accumulation of the mutant, but not wild-type b-catenin was most evident in HepG2 cell line due to faster migration of truncated b-catenin (D b-catenin) protein (Figure 1b). As expected, SK-Hep1 cells expressed wild-type b-catenin at low levels. On the other hand, all remaining cell lines (n=9) displayed increased levels of wild-type b-catenin protein (Figure 1b). This unexpected accumulation of wild-type b-catenin was as important as the accumula-tion of mutant b-catenins (compare lanes 2 – 10 with lanes 11 and 12 in Figure 1b). We also compared cytosolic and non-cyotosolic forms of b-catenin in selected cell lines. The accumulation was evident in both cytosolic and non-cyotosolic forms of wild-type b-catenin, similarly to mutant forms, in four cell lines tested, with the exception of Huh7, which displayed an accumulation of non-cyotosolic b-catenin only (Figure 1c). A closer examination of the wild-type b-catenin protein levels in comparison to p53 status in these cell lines revealed a perfect correlation between p53 gene mutation and b-catenin protein accumulation (Figure 1b and Table 1). This observation led us to hypothesize that p53 mutations may lead to aberrant accumulation of wild-type b-catenin protein in cancer cells.
Ectopic expression of mutant p53 causes the accumulation of wild-typeb-catenin protein
To test whether p53 mutation is a direct cause of wild-type b-catenin accumulation in HCC cells, we
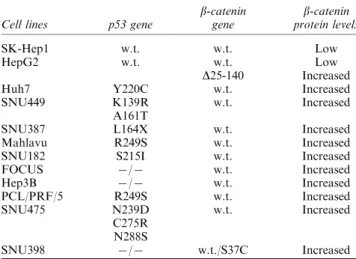
Table 1 Comparative analysis of p53 and b-catenin status of hepatocellular carcinoma
b-catenin b-catenin
Cell lines p53 gene gene protein levels
SK-Hep1 w.t. w.t. Low
HepG2 w.t. w.t. Low
D25-140 Increased
Huh7 Y220C w.t. Increased
SNU449 K139R w.t. Increased
A161T
SNU387 L164X w.t. Increased
Mahlavu R249S w.t. Increased
SNU182 S215I w.t. Increased
FOCUS 7/7 w.t. Increased Hep3B 7/7 w.t. Increased PCL/PRF/5 R249S w.t. Increased SNU475 N239D w.t. Increased C275R N288S SNU398 7/7 w.t./S37C Increased
w.t., wild type; 7/7, gene deletion and/or protein loss. Data on the status of p53 gene in SK-Hep1, HepG2, Hep 3B, PLC/PRF/5 and Huh7 has been previously reported (Sayan et al., 2001a), data for SNU475, SNU449, SNU387 and SNU182 was obtained from the IARC p53 mutation database version R6 (http://www.iarc.fr/p53/ Index.html; Olivier et al., 2002)
p53 mutation and wnt pathway T Cagatay and M Ozturk 7972
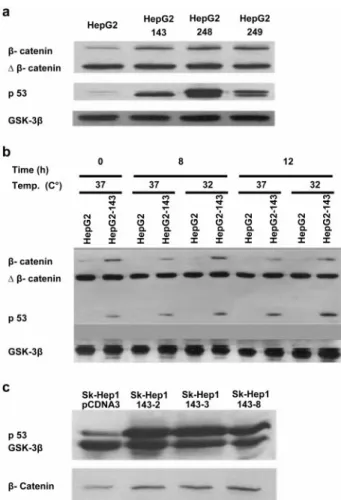
generated several stable clones following transfection of wild-type p53-expressing HepG2 cell line with mutant p53 expression plasmids. HepG2-143, HepG2-248 and HepG2-249 clones expressing mutant V143A, p53-R248W and p53-R249S proteins respectively, displayed an increase in the wild-type b-catenin levels, with no
apparent change in the levels of mutant D b-catenin protein (Figure 2a). Time- and temperature-dependent comparison of parental HepG2 and clonal HepG2-143 cells confirmed that wild-type b-catenin protein levels were consistently higher in mutant p53-expressing cells, in comparison to parental cell line (Figure 2b). This
Figure 1 (a) b-catenin mutation status of hepatocellular carcinoma cell lines. Direct sequencing of exon 3 and fragment length analysis of exons 2 – 4 of genomic DNAs from 12 cell lines showed a point mutation in SNU398 (top), but not in other cell lines (SK-Hep1 data shown as an example). Data for HepG2 with a partial deletion of b-catenin gene which has previously been reported by de La Coste et al. (1998) was shown in Figure 3a. (b) Increased b-catenin protein levels in HCC cell lines displaying a p53 muta-tion. Western blot assay for b-catenin protein shows that wild-type p53-expressing cell lines SK-Hep1 (lane 1) and HepG2 (lane 12) express low levels of wild-type b-catenin protein. The truncated mutant b-catenin (D b-catenin) observed in HepG2 (lane 12) and non-truncated mutant b-catenin in SNU398 (lane 11) serve as examples of stabilized mutant b-catenin proteins. In contrast, all mu-tant p53 cell lines (Table 1) shown in lanes 2 (Huh7), 3 (SNU449), 4 (SNU387), 5 (Mahlavu), 6 (SNU182), 7 (FOCUS), 8 (Hep3B), 9 (PLC/PRF/5), and 10 (SNU475) display increased levels of wild-type b-catenin protein. GSK-3b serves as a protein loading con-trol. (c) Both cytosolic and non-cytosolic fractions of b-catenin are increased in mutant p53 cell lines (Mahlavu, Hep3B and PLC/ PRF/5), except Huh7 which displays an increase in non-cytosolic fraction only
data also showed that the increase in b-catenin levels was independent of conformational change of p53-V143A protein at 328C (Figure 2b; Friedlander et al., 1996). We also generated stable clones from wild-type p53-expressing cell line SK-Hep1, following transfec-tion with either p53-V143A or pCDNA3A plasmid. As shown in Figure 2c, cells which were stably transfected with mutant p53 plasmid, but not those transfected with a control plasmid, displayed a modest but consistent increase in wild-type b-catenin protein levels. This effect was observed in all three p53-V143A-expressing clones tested.
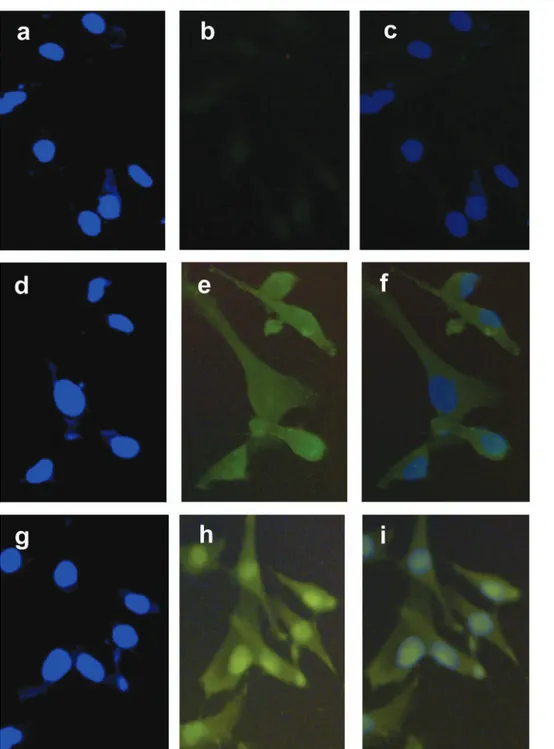
As an additional test, we stained HepG2 and SK-Hep1 clones for b-catenin by immunofluorescence. As shown in Figure 3, SK-Hep1-143-2 clone, which
express the mutant p53-V143A protein, displayed strong nuclear b-catenin staining, as opposed to the SK-Hep1 – pCDNA3A negative control clone. HepG2 cell line with endogenously mutated b-catenin gene also showed strong nuclear b-catenin staining (data not shown), as reported previously (de La Coste et al., 1998; Satoh et al., 2000). HepG2 clones expressing mutant p53 displayed the same type of b-catenin staining (data not shown).
We also tested whether the increase in b-catenin protein levels following p53 inactivation was due to an increase in gene transcription. As shown in Figure 4, semi-quantitative RT – PCR analysis of b-catenin transcripts indicated that full-length b-catenin cDNA transcripts encoding for wild-type b-catenin were higher in HepG2 clones, in comparison with those observed in the parental cell line. Interestingly, we did not observe an increase in truncated b-catenin cDNA (Db-catenin) levels under the same conditions. Thus, it appears that the inhibition of wild-type p53 in these cells results in an increase in transcripts encoding for wild-type b-catenin protein. A moderate increase in wild-type b-catenin transcript levels was also observed in SK-Hep1-derived clones (data not shown).
These additional observations suggested that p53 mutation plays a key role in the aberrant accumulation of b-catenin in cancer cells. To further elaborate on this hypothesis, we compared p53 and b-catenin mutation frequencies in primary tumors.
b-catenin mutations are rare in primary tumors from southern Africa and China
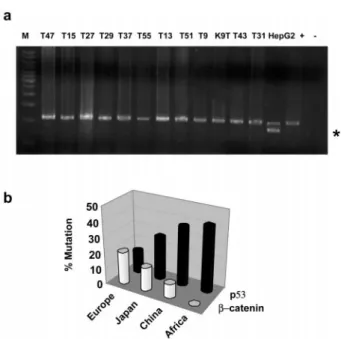
Hepatocellular carcinomas from southern Africa and China are known for their high frequency of p53 mutations, mostly affecting codon 249 (Bressac et al., 1991; Hsu et al., 1991, Ozturk et al., 1991). We tested genomic DNAs from 33 tumor samples from these geographical locations for possible mutations affecting b-catenin gene, by SSCP and DNA sequencing of exon 3, and by size testing of a region encompassing exons 2 – 4, following PCR amplification of genomic DNA. All tumor samples displayed wild-type b-catenin sequences at exon 3 (data not shown) and there was no deletion-type mutation within the exon 2 – 4 region (Figure 5a).
Inverse correlation in the worldwide distribution of b-catenin and p53 gene mutations in hepatocellular carcinoma
The apparent lack of b-catenin mutations in our tumor samples from southern Africa and China was in sharp contrast with high frequency of mutations reported for tumors from other regions of the world (Buendia, 2000). Based on our previous work, which demon-strated that the mutation rates of p53 differ significantly from one geographical region to another (Unsal et al., 1994; Ozturk, 1999), we compared reported b-catenin mutation rates in HCCs from different countries. Based on data collected from 1123
Figure 2 (a) Ectopically expressed mutant p53 proteins cause an increase in the levels of wild-type catenin, but not truncated b-catenin (D b-b-catenin) in HepG2-derived stable clones. HepG2-143, HepG2-248 and HepG2-249 express mutant V143A, p53-R248W and p53-R249S proteins, respectively. (b) Increase of wild-type b-catenin levels in clone HepG2-143 is independent of time and temperature. Cells were left 18 h after plating at 378C, then the incubation temperature was shifted to 328C in one set of plates, and b-catenin was tested at times 0, 8 and 12 h by Wes-tern blotting. (c) Ectopic expression of mutant p53-V143A leads to an increase in wild-type b-catenin protein levels in SK-Hep1 cells. SK-Hep1-143-2, SK-Hep1-143-3 and SK-Hep1-143-8 clones were generated following stable expression of mutant p53-V143A, whereas SK-Hep1 – pCDNA3 clone was obtained following trans-fection with empty control vector. GSK-3b serves as an equal protein loading control in a, b and c
p53 mutation and wnt pathway T Cagatay and M Ozturk 7974
tumor samples, overall mutation rate of b-catenin in HCC was 17%, but its geographical distribution was highly heterogeneous. The lowest mutation rate was seen in tumors from Africa (0%), followed by China (9%), Japan (19%) and Europe (24%), which displayed the highest mutation rate. A similar analysis of p53 mutation frequencies showed that the overall p53 mutation rate in 969 tumors was 27%. The highest
mutation frequency was observed in tumors from Africa (42%), followed by China (38%), Japan (27%) and Europe (15%), which displayed the lowest mutation rate (Table 2). As illustrated in Figure 5b, p53 and b-catenin mutation rates in HCC follow a perfect but inverse occurrence pattern. This pattern is characterized by a dominant p53 mutation frequency in tumors from Africa and China, associated with a low
Figure 3 Nuclear accumulation of b-catenin in SK-Hep1 cells following ectopic expression of mutant p53 protein p53-V143A. The negative control clone SK-Hep1 – pCDNA3 (a – f) and mutant p53 expressing clone SK-Hep1-143-2 (g – i) were subjected to immu-nofluorescence staining for b-catenin. Compared to antibody negative control (a – c), staining of SK-Hep1 – pCDNA3 with anti-b-catenin antibody (d – f) showed diffused cytoplasmic staining with weak nuclear staining (e,f). In contrast, strong nuclear b-anti-b-catenin staining was evident with SK-Hep1-143-2 clone (h,i). Fixed and permeabilized cells were subjected to nuclear DNA (a,d,g) and im-munofluorescence staining (b,e,h), and then digital pictures were merged (c,f,i)
rate of b-catenin mutations. In tumors from other geographical regions, b-catenin mutations are more prominent, or even more frequent than p53 mutations, as observed in tumors from Europe (Figure 5b).
Discussion
Aberrant accumulation of b-catenin has been observed in different types of tumors. This accumulation is usually due to a defective proteosomal degradation of b-catenin, which may result from mutations affecting b-catenin, APC or Axin1 gene, depending on cancer type (Polakis, 2000). Here, we report that aberrant accumulation of b-catenin is also associated with p53 mutations. The reasons for this association are not known presently. However, two types of studies have established the presence of a functional cross-talk
between p53 and b-catenin. Recently, it has been reported that wild-type p53 is able to induce the expression of Siah-1 gene, which encodes a protein involved in the ubiquitin-mediated degradation of b-catenin protein. Accordingly, wild-type p53-induced Siah-1 was shown to down-regulate b-catenin levels (Liu et al., 2001; Matsuzawa and Reed, 2001). However, it is unknown whether mutational inactiva-tion of p53 may cause a loss of basal Siah-1 expression leading to defective b-catenin degradation. Using a semi-quantitative RT – PCR assay, we observed that all HCC cell lines tested here express Siah-1 transcripts independent of p53 status, with the exception of SK-Hep1 cells which display extremely low levels. In addition, Siah-1 transcripts appeared not to be modified in HepG2 and SK-Hep1 clones expressing mutant p53 protein (both data not shown). Therefore, the accumulation of b-catenin in mutant p53 cell lines may not be related to loss of Siah-1 activity. On the other hand, oncogenic activation of b-catenin was shown to serve as a stimulus for activation of wild-type p53 activity, which induces
Figure 4 Up-regulation of wild-type b-catenin transcripts in HepG2 cells following ectopic expression of mutant p53 proteins p53-V143A, p53-R248W and p53-R249S proteins, respectively. Total cellular RNAs were analysed by semi-quantitative RT – PCR. Note that full-length b-catenin (top), but not truncated Db-catenin transcripts are increased in mutant p53 expressing clones, in comparison with parental HepG2 cell line. GADPH
was used as a PCR loading control Figure 5 Worldwide distribution of p53 and b-catenin mutation
frequencies in hepatocellular cancers. (a) Absence of b-catenin mutations in HCCs from southern Africa (n=22) and China (n=11). Picture shows that a region of b-catenin gene (exons 2 – 4) known to be deleted in some cancers is devoid of truncating mutations in 12 HCCs from southern Africa, as an example. Genomic DNA from HepG2 cell line was used as a positive con-trol for deletion (*). All 33 tumor samples were also tested by SSCP and direct sequencing, but no mutation was found (data not shown). (b) Comparative analysis reveals an inverse relation-ship between worldwide rates of p53 and b-catenin mutations in hepatocellular carcinoma. p53 and b-catenin mutations in tumors from different geographical locations (reported here and complied from previous reports by others) were calculated as shown in Ta-ble 2, and represented as a comparative graph here. Note that in tumors from Western populations, p53 mutations are rare, while b-catenin mutation rate is high. Inversely, b-catenin mutations are rare in tumors from Africa and China which display high rate of p53 mutations
Table 2 Geographical distribution of reported b-catenin and p53 mutation rates in hepatocellular carcinoma
Region b-catenin p53 Africa 0/22 (0%) 11/26 (42%) Chinaa 12/133 (9%) 50/132 (38%) Japan 44/241 (19%) 94/353 (27%) Europe 26/108 (24%) 23/151 (15%) Otherb 102/619 (17%) 79/273 (28%) All 184/1123 (17%) 263/969 (27%) a
Mainland China and Hong Kong, bAustralia, North America, Singapore, South Korea, Taiwan, Thailand, or unidentifiable origin. b-catenin data is a combination of the data presented here (data for Africa and part of China), and those compiled from references Devereux et al., 2001, Wong et al., 2001 (for China); Miyoshi et al., 1998; Kondo et al., 1999; Satoh et al., 2000; Fujie et al., 2001 (for Japan); Nhieu et al., 1999; Terris et al., 1999 (for Europe); Huang et al., 1999; Hsu et al., 2000; Laurent-Puig et al., 2001; De La Coste et al., 1998 (for other). p53 data is from Ozturk, 1999
p53 mutation and wnt pathway T Cagatay and M Ozturk 7976
cell cycle arrest or apoptosis as a response (Damalas et al., 1999, 2001). Therefore, the mutant b-catenin and wild-type p53 activity may not be compatible for cell survival, so that p53 gene is also mutated during tumor progression following b-catenin mutation. This appears to be the case in colorectal cancers where early oncogenic activation of b-catenin (either directly by b-catenin mutation, or indirectly by APC muta-tion) is followed by a sharp increase in p53 mutation frequency (Kinzler and Volgelstein, 1998). The same mechanism could also be involved in some HCCs displaying both p53 and b-catenin mutations such as SNU398 cell line, but most HCC cell lines have either p53 or b-catenin mutation (Table 1). Oncogenic activation of wild-type b-catenin in HCC by muta-tions affecting APC and Axin1 gene is also conceivable. As stated earlier, APC mutation is exceptional in HCC, while Axin1 mutation appears to affect less than 10% of these tumors. In HCC cell lines studied here, PLC/PRF/5, SNU423 and SNU475 have been reported to display Axin1 mutation, while Huh7 had no mutation (Satoh et al., 2000). So far, we were able to confirm the Axin1 status of these cell lines, but we failed to identify any Axin1 mutation in the remaining nine cell lines (data not shown). Thus, we believe that in most HCC cell lines, the accumulation of b-catenin occurs as a consequence of functional inactivation of p53. Induced accumula-tion of wild-type b-catenin in HepG2 and SK-Hep1 cells following ectopic expression of mutant p53 proteins provides additional evidence for our hypoth-esis. The increase in wild-type b-catenin levels in mutant p53-expressing clones of HepG2 and SK-Hep1 was modest, but this is probably due to the fact that these clones still express wild-type p53, in contrast to other cell lines, which have complete loss of wild-type p53 allele (Table 1). Nuclear accumulation of b-catenin is considered as an indication of its aberrant accumulation in cells, in particular due to APC mutations in colorectal cancers (Handerson, 2000; Polakis, 2000). We have shown wild-type b-catenin accumulation in the nuclei of SK-Hep1 cells, following p53 inactivation (Figure 3). Thus, it appears that p53 inactivation, similar to APC or Axin1 inactivation leads to oncogenic activation of b-catenin in cancer cells. This activation appears to be due, at least in part, to an up-regulation of wild-type b-catenin transcripts, as demonstrated in HepG2 cells (Figure 4). Interestingly, p53 status did not affect truncated Db-catenin transcripts in the same cell line (Figure 4). The reasons of this differential response are presently unknown. However, this could be due to allele-specific interstitial b-catenin gene deletion in HepG2 cells, which may abolish the ability of this gene to respond to wild-type p53. This hypothesis remains to be demonstrated experimentally.
The p53 gene is one of the most frequently mutated or inactivated genes in hepatocellular, breast, lung and cervix cancers which express aberrantly accumulated b-catenin protein that can not be explained solely by b-catenin, APC or Axin1 gene mutations. Thus, it is
highly likely that, the loss of p53 function is a considerable cause for aberrant accumulation of b-catenin in these tumors. Presently, it is unclear whether p53 mutation may serve as an alternative mechanism for oncogenic activation of b-catenin during tumor development. Such a hypothesis could be indirectly verified by testing whether p53 and b-catenin mutations are mutually exclusive, as it has been shown for APC and b-catenin mutations in colorectal cancers (Sparks et al., 1998). Data presented in Table 1 indicate that p53 and b-catenin mutations are mutually exclusive in 11 of 12 (92%) of HCC cell lines. We were not able to address this issue in primary tumors, but Figure 3b shows that overall frequencies of p53 and b-catenin mutations show an inverse correlation in HCCs from different geographi-cal locations, as if these mutations are mutually exclusive in these tumors. A careful examination of previously published data on p53 and b-catenin mutations provides additional hints for a close connection between p53 and b-catenin in different HCC models. For example, data published by Laurent-Puig et al. (2001) show that p53 and b-catenin mutations are mutually exclusive in 58 of 62 (94%) of primary HCC tumors, and only 4 of 62 (7%) of tumors display mutations on both genes. In another study, Renard et al. (2000) reported that either wild-type p53 allele was lost or b-catenin gene mutated in HCCs observed in N-myc transgenic mice that are heterozygous for p53 gene. It is also noteworthy that b-catenin mutations were shown to be absent in HCCs that occur in SV40 Large T transgenic mice (Umeda et al., 2000), whereas b-catenin is mutated frequently in other models of experimentally induced mouse HCCs (de La Coste et al., 1998; Calvisi et al., 2001). Transforming ability of large T antigen is known to be due, at least partly, to functional inactivation of p53 (Pipas and Levine, 2001). Therefore, the lack of b-catenin mutation in these tumors could be due to a functional activation of its protein product by large T antigen via p53 inactivation.
Taken together, these observations clearly indicate that b-catenin mutations occur rarely in cancer cells which have lost wild-type p53 function, but these cells display aberrant accumulation of wild-type b-catenin protein. These findings may strengthen a hypothesis linking p53 mutations to oncogenic activation of b-catenin, even though this has to be demonstrated experimentally. If this is the case, critical target genes of activated b-catenin must be induced in cancer cells following p53 inactivation. This demonstration will not be an easy task for HCC, since best described b-catenin targets, namely cyclin D1 and c-myc (He et al., 1998; Tetsu and Mccormick, 1999) appear not to be involved in b-catenin-mediated hepatocellular carcinogenesis. For example, neither c-myc nor cyclin D1 is over-expressed in hyperplastic livers of transgenic mice, which develop hepatomegaly as a result of oncogenic b-catenin overexpression (Cadoret et al., 2001). Furthermore, Inagawa et al. (2002) did not find any
association between accumulation of b-catenin and overexpression of cyclin D1 in human HCCs. In confirmation of these observations, we did not detect any correlation between c-myc/cyclin D1 protein over-expression and b-catenin mutation or b-catenin accumulation in 12 HCC cell lines studied here (data not shown). Thus, it appears that b-catenin acts on targets other than c-myc and cyclin D1 to exhibit its oncogenic activity in liver cells. Some genes whose over-expression is associated with p53 mutation in cancer cells could be such targets for b-catenin in liver cells.
In conclusion, both p53 and wnt pathways are involved in many cellular processes independent of each other (Barker et al., 2000; Polakis, 2000; Ryan et al., 2001). Nevertheless, there is now sufficient evidence for a functional cross-talk between p53 and wnt pathways (Damalas et al., 1999, 2001; Liu et al., 2001; Matsuzawa and Reed, 2001; Sadot et al., 2001 and this study). Studies aiming to explore combined effects of p53 and wnt pathway deregulations may open new ways to a more comprehensive study of hepatocellular carcinogenesis.
Materials and methods b-catenin mutation analysis
Twelve HCC cell lines and 33 primary HCCs from patients who lived in southern Africa (n=22) and China (n=11) were analysed. Genomic DNAs were isolated as described previously (Unsal et al., 1994; Yakicier et al., 1999). The exon 3 sequence of b-catenin was studied for base substitutions and small insertion/deletions by SSCP as described previously (Ozdag et al., 2000), as well as by direct DNA sequencing. In addition, the b-catenin gene region encompassing exons 2 to 4 was studied for larger deletions, essentially as described by Koch et al. (1999). Sequencing was performed in both direction and reaction products were run on an ABI Prism 377 DNA Sequencer (Applied Biosystems, USA), and the sequencing data was analysed with ABI Prism Sequencing Analysis 3.3 software (Applied Biosystems).
Cell lines and construction of stable clones
The origins and culture conditions of HCC cell lines used here have been reported recently (Sayan et al., 2001a). HepG2 and SK-Hep1 cell line clones ectopically expressing mutant forms (p53-V143A, p53-R248W, p53-R249S) of p53 were generated by stable transfection with appropriate plasmids (Frebourg et al., 1992), as described previously (Ponchel et al., 1994). An empty pCDNA3A plasmid (Invitrogen, USA) was used to generate negative control clones.
Preparation of cell lysates and western blotting
Detergent-soluble cell lysates were prepared and used for the analysis of total b-catenin and p53 protein levels by western blot assay, as described previously (Sayan et al., 2001a). Cytosolic and non-cytosolic forms of b-catenin were analysed on protein lysates prepared from corresponding cellular fractions. These fractions were prepared as described by Iwai et al. (1995), with some modifications. Briefly, culture
medium was removed and cells were washed twice with ice-cold PBS, scraped and resuspended in 2 ml sucrose buffer. After 20 strokes in glass homogenizer, the samples were centrifuged at 100 000 g for 1 h and supernatants were collected as cytosolic fraction. The pellet was resuspended in 2 ml sucrose buffer to obtain non-cytosolic fraction. Equal volumes from both fractions were solubilized in SDS sample buffer and used for SDS-polyacrylamide gel electrophoresis. Antibodies to b-catenin (clone E5 from Santa Cruz Biotech. USA) and GSK-3b (clone 7 from Transduction Labs., USA) were obtained commercially. The p53 monoclonal anti-body 6B10 was described previously (Yolcu et al., 2001). In order to generate a linear response in Western blotting assays, we used appropriate amounts of proteins from cell lysates for SDS – PAGE and an ECL kit (Amersham Pharmacia Biotech, UK) for detection of antigen-antibody complexes. Equal protein loading was verified by Western blot assay with GSK-3b whose levels are known to be stable in quiescent and proliferating hepatocytes (Monga et al., 2001). Experiments were repeated several times with different batches of cell lysates for verification.
Immunofluorescence staining forb-catenin
Cells were stained as described previously (Sayan et al., 2001b), by formaldehyde fixation and Triton X-100 permea-bilization technique, using the anti-b-catenin monoclonal antibody (Clone 6F9, Abcam), followed by incubation with FITC-conjugated rabbit anti-mouse antibodies (Dako). Nuclear DNA was visualized by Hoechst 33258 staining (Sayan et al., 2001b). Pictures were taken using fluorescence microscope (Zeiss – Axioskop). Picture was captured in a digital Kodak Camera (DC 290) using Adobe Photo Deluxe (adobe System Inc.) software. Images were captured at 4006 and picture was edited using Paint Shop Pro 7.0 (Jasc Software Inc.).
Semi-quantitative RT – PCR analysis ofb-catenin transcripts Total RNA was extracted and used for cDNA synthesis and semi-quantitative RT – PCR analysis, as described previously (Sayan et al., 2001a), using a b-catenin primer pair derived from exons 2 and 4, respectively (Koch et al., 1999), allowing to detect differentially the expression of wild-type and truncated b-catenin transcripts in HepG2 cells which displays a heterozygous interstitial deletion of b-catenin gene between exons 2 and 4 (de La Coste et al., 1998).
Analysis of worldwide distribution of p53 andb-catenin mutations
Using data generated in this work (n=33), as well as data compiled from previous reports by different authors, we calculated mutation frequencies of b-catenin in a total of 1123 hepatocellular carcinoma samples from different geographical locations. p53 mutation frequencies for 969 tumor samples were taken from our earlier report (Ozturk, 1999).
Acknowledgements
This work was supported by grants from Tubitak and Bilkent University. We thank S Friend (USA) and T Frebourg (France) for p53 expression plasmids and T Arayici for technical help in DNA sequencing.
p53 mutation and wnt pathway T Cagatay and M Ozturk 7978
References
Amit S, Hatzubai A, Birman Y, Andersen JS, Ben-Shushan E, Mann M, Ben-Neriah Y and Alkalay I. (2002). Genes Dev., 16, 1066 – 1076.
Barker N, Morin PJ and Clevers H. (2000). Adv. Cancer Res., 77, 1 – 24.
Bressac B, Kew M, Wands J and Ozturk M. (1991). Nature, 350, 429 – 431.
Buendia MA. (2000). Seminars in Cancer Biology, 10, 185 – 200.
Cadoret A, Ovejero C, Saadi-Kheddouci S, Souil E, Fabre M, Romagnolo B, Kahn A and Perret C. (2001). Cancer Res., 61, 3245 – 3249.
Calvisi DF, Factor VM, Loi R and Thorgeirsson SS. (2001). Cancer Res., 61, 2085 – 2091.
Candidus S, Bischoff P, Becker KF and Hofler H. (1996). Cancer Res., 56, 49 – 52.
Chung DC. (2000). Gastroenterology, 119, 854 – 865. Damalas A, Ben-Ze’ev A, Simcha I, Shtutman M, Leal JF,
Zhurinsky J, Geiger B and Oren M. (1999). EMBO J., 18, 3054 – 3063.
Damalas A, Kahan S, Shtutman M, Ben-Ze’ev A and Oren M. (2001). EMBO J., 20, 4912 – 4922.
de La Coste A, Romagnolo B, Billuart P, Renard CA, Buendia MA, Soubrane O, Fabre M, Chelly J, Beldjord C, Kahn A and Perret C. (1998). Proc. Natl. Acad. Sci. USA, 95, 8847 – 8851.
Devereux TR, Stern MC, Flake GP, Yu MC, Zhang ZQ, London SJ and Taylor JA. (2001). Mol. Carcinog., 31, 68 – 73.
Frebourg T, Barbier N, Kassel J, Ng YS, Romero P and Friend SH. (1992). Cancer Res., 52, 6976 – 6978.
Friedlander P, Haupt Y, Prives C and Oren M. (1996). Mol. Cell. Biol., 16, 4961 – 4971.
Fujie H, Moriya K, Shintani Y, Tsutsumi T, Takayama T, Makuuchi M, Kimura S and Koike K. (2001). Hepatol. Res., 20, 39 – 51.
Handerson BR. (2000). Nature Cell Biology, 2, 653 – 660. He TC, Sparks AB, Rago C, Hermeking H, Zawel L, da
Costa LT, Morin PJ, Vogelstein B and Kinzler KW. (1998). Science,, 281, 1509 – 1512.
Hommura F, Furuuchi K, Yamazaki K, Ogura S, Kinoshita I, Shimizu M, Moriuchi T, Katoh H, Nishimura M and Dosaka-Akita H. (2002). Cancer, 94, 752 – 758.
Hsu IC, Metcalf RA, Sun T, Welsh JA, Wang NJ and Harris CC. (1991). Nature, 350, 427 – 428.
Hsu HC, Jeng YM, Mao TL, Chu JS, Lai PL and Peng SY. (2000). Am. J. Pathol., 157, 763 – 770.
Huang H, Fuji H, Sankila A, Mahler-Araujo BM, Matsuda M, Cathomas G and Ohgaki H. (1999). Am. J. Pathol., 155, 1795 – 1801.
Inagawa S, Itabashi M, Adachi S, Kawamoto T, Hori M, Shimazaki J, Yoshimi F and Fukao K. (2002). Clin. Cancer Res., 8, 450 – 456.
Iwai A, Masliah E, Yoshimoto M, Ge N, Flanagan L, de Silva HA, Kittel A and Saitoh T. (1995). Neuron, 14, 467 – 475.
Johnsson M, Borg A, Nilbert M and Andersson T. (2000). Eur. J. Cancer, 36, 242 – 248.
Kinzler KW and Volgelstein B. (1998). The Genetics Basis of Human Cancer: Colorectal Tumors. Kinzler KW and Volgelstein B (eds). New York: McGraw-Hill, pp 565 – 587.
Koch A, Denkhaus D, Albrecht S, Leuschner I, von Schweinitz D and Pietsch T. (1999). Cancer Res., 59, 269 – 273.
Kondo Y, Kanai Y, Sakamoto M, Genda T, Mizokami M, Ueda R and Hirohashi S. (1999). Jpn. J. Cancer Res., 90, 1301 – 1309.
Laurent-Puig P, Legoix P, Bluteau O, Belghiti J, Franco D, Binot F, Monges G, Thomas G, Bioulac-Sage P and Zucman-Rossi J. (2001). Gastroenterology, 120, 1763 – 1773.
Lin SY, Xia W, Wang JC, Kwong KY, Spohn B, Wen Y, Pestell RG and Hung MC. (2000). Proc. Natl. Acad. Sci. USA, 97, 4262 – 4266.
Liu J, Stevens J, Rote CA, Yost HJ, Hu Y, Neufeld KL, White RL and Matsunami N. (2001). Molecular Cell, 7, 927 – 936.
Liu C, Li Y, Semenov M, Han C, Baeg GH, Tan Y, Zhang Z, Lin X and He X. (2002). Cell, 108, 837 – 847.
Matsuzawa S and Reed JC. (2001). Molecular Cell, 7, 915 – 926.
Miyoshi Y, Iwao K, Nagasawa Y, Aihara T, Sasaki Y, Imaoka S, Murata M, Shimano T and Nakamura Y. (1998). Cancer Res., 58, 2524 – 2527.
Monga SP, Pediaditakis P, Mule K, Stolz DB and Michalopoulos GK. (2001). Hepatology, 33, 1098 – 1109. Nhieu JT, Renard CA, Wei Y, Cherqui D, Zafrani ES and
Buendia MA. (1999). Am. J. Pathol., 155, 703 – 710. Olivier M, Eeles R, Hollstein M, Khan MA, Harris CC and
Hainaut P. (2002). Human Mutation, 19, 607 – 617. Ozdag H, Tez M, Sayek I, Muslumanoglu M, Tarcan O, Icli
F, Ozturk M and Ozcelik T. (2000). Eur. J. Cancer, 36, 2076 – 2082.
Ozturk M. (1991). Lancet, 338, 1356 – 1359. Ozturk M. (1999). Semin. Liver Dis., 19, 235 – 242.
Park WS, Oh RR, Park JY, Kim PJ, Shin MS, Lee JH, Kim HS, Lee SH, Kim SY, Park YG, An WG, Kim HS, Jang JJ, Yoo NJ and Lee JY. (2001). J. Pathol., 193, 483 – 490. Pipas JM and Levine AJ. (2001). Semin. Cancer Biol., 11,
23 – 30.
Polakis P. (2000). Genes Dev., 14, 1837 – 1851.
Ponchel F, Puisieux A, Tabone E, Michot JP, Froschl G, Morel AP, Frebourg T, Fontaniere B, Oberhammer F and Ozturk M. (1994). Cancer Res., 54, 2064 – 2068.
Renard CA, Fourel G, Bralet MP, Degott C, De La CosteA, Perret C, Tiollais P and Buendia MA. (2000). Oncogene, 19, 2678 – 2686.
Rimm DL, Caca K, Hu G, Harrison FB and Fearon ER. (1999). Am. J. Pathol., 154, 325 – 329.
Ryan KM, Phillips AC and Vousden KH. (2001). Curr. Opin. Cell Biol., 13, 332 – 337.
Sadot E, Geiger B, Oren M and Ben Ze’ev A. (2001). Mol. Cell Biol., 21, 6768 – 6781.
Satoh S, Daigo Y, Furukawa Y, Kato T, Miwa N, Nishiwaki T, Kawasoe T, Ishiguro H, Fujita M, Tokino T, Sasaki Y, Imaoka S, Murata M, Shimano T, Yamaoka Y and Nakamura Y. (2000). Nat. Genet., 24, 245 – 250.
Sayan AE, Sayan BS, Findikli N and Ozturk M. (2001a). Oncogene, 20, 5111 – 5117.
Sayan BS, Ince G, Sayan AE and Ozturk M. (2001b). J. Cell Biol., 155, 719 – 724.
Shinohara A, Yokoyama Y, Wan X, Takahashi Y, Mori Y, Takami T, Shimokawa K and Tamaya T. (2001). Gynecol. Oncol., 82, 450 – 455.
Sparks AB, Morin PJ, Vogelstein B and Kinzler KW. (1998). Cancer Res., 58, 1130 – 1134.
Terris B, Pineau P, Bregeaud L, Valla D, Belghiti J, Tiollais P, Degott C and Dejean A. (1999). Oncogene, 18, 6583 – 6588.
Tetsu O and McCormick F. (1999). Nature, 398, 422 – 426. Ueda M, Gemmill RM, West J, Winn R, Sugita M, Tanaka
N, Ueki M and Drabkin HA. (2001). Br. J. Cancer, 85, 64 – 68.
Umeda T, Yamamoto T, Kajino K and Hino O. (2000). Int. J. Oncol., 16, 1133 – 1136.
Unsal H, Yakicier C, Marcais C, Kew M, Volkmann M, Zentgraf H, Isselbacher KJ and Ozturk M. (1994). Proc. Natl. Acad. Sci. USA, 91, 822 – 826.
Wei Y, Fabre M, Branchereau S, Gauthier F, Perilongo G and Buendia MA. (2000). Oncogene, 19, 498 – 504. Wong CM, Fan ST and Ng IO. (2001). Cancer,, 92, 136 – 145. Yakicier MC, Irmak MB, Romano A, Kew M and Ozturk M.
(1999). Oncogene, 18, 4879 – 4883.
Yolcu E, Sayan BS, Yagci T, Cetin-Atalay R, Soussi T, Yurdusev N and Ozturk M. (2001). Oncogene, 20, 1398 – 13401.
p53 mutation and wnt pathway T Cagatay and M Ozturk 7980