SEVENTH GRADE STUDENTS’ CONCEPTUAL AND
PROCEDURAL UNDERSTANDING OF FRACTIONS:
COMPARISON BETWEEN SUCCESSFUL AND LESS
SUCCESSFUL STUDENTS
A MASTER’S THESIS
BY
ŞAKİRE ÖRMECİ
THE PROGRAM OF CURRICULUM AND INSTRUCTION BILKENT UNIVERSITY
ANKARA
SEVENTH GRADE STUDENTS’ CONCEPTUAL AND PROCEDURAL UNDERSTANDING OF FRACTIONS: COMPARISON BETWEEN
SUCCESSFUL AND LESS SUCCESSFUL STUDENTS
The Graduate School of Education Bilkent University
by
Şakire Örmeci
In Partial Fulfilment of the Requirements for the Degree of
Master of Arts
The Program of Curriculum and Instruction Bilkent University
Ankara
BILKENT UNIVERSITY
GRADUATE SCHOOL OF EDUCATION
THESIS TITLE: SEVENTH GRADE STUDENTS’ CONCEPTUAL AND PROCEDURAL UNDERSTANDING OF FRACTIONS: COMPARISON
BETWEEN SUCCESSFUL AND LESS SUCCESSFUL STUDENTS
SUPERVISEE:ŞAKİRE ÖRMECİ
May 2012
I certify that I have read this thesis and have found that it is fully adequate, in scope and in quality, as a thesis for the degree of Master of Arts in Curriculum and
Instruction.
--- Asst Prof. Dr. Minkee Kim
I certify that I have read this thesis and have found that it is fully adequate, in scope and in quality, as a thesis for the degree of Master of Arts in Curriculum and
Instruction.
--- Prof. Dr. Cengiz Alacacı
I certify that I have read this thesis and have found that it is fully adequate, in scope and in quality, as a thesis for the degree of Master of Arts in Curriculum and
Instruction.
---
Assoc. Prof. Dr. Erdat Çataloğlu
Approval of the Graduate School of Education ---
ABSTRACT
SEVENTH GRADE STUDENTS’ CONCEPTUAL AND PROCEDURAL UNDERSTANDING OF FRACTIONS: COMPARISON BETWEEN
SUCCESSFUL AND LESS SUCCESSFUL STUDENTS
Şakire Örmeci
M.A., Program of Curriculum and Instruction Supervisor: Asst. Prof. Dr. Minkee Kim
May 2012
The aim of the study was to find the correlation between conceptual knowledge (CK) and procedural knowledge (PK) and the difficulties that less successful students have regarding fractions.
The study was conducted with a mixed-methods approach using explanatory design which consisted of two phases. In the first phase of the study, a conceptual and procedural knowledge test (CPKT) was administered to 33 seventh grade students. In the second phase, interviews were conducted with two successful students (ST33 and ST24) and two less successful students (ST01 and ST03).
The results of the CPKT showed a strong positive correlation between students’ conceptual knowledge (CK) and procedural knowledge (PK), r = 0.66 (p < .01). In addition, it was found that students’ school mathematics grade (mathematics GPA:
grade point average) at the end of the sixth year was strongly related to both conceptual and procedural knowledge. In the second phase, the interview results showed that while successful students had combined conceptual and procedural knowledge, less successful students had orphaned procedural knowledge. It was concluded that students can benefit from having both conceptual and procedural knowledge in order to develop a good knowledge base in mathematics.
Key words: Conceptual knowledge, procedural knowledge, combined conceptual and procedural knowledge, orphaned procedural knowledge, fractions
ÖZET
7. SINIF ÖĞRENCİLERİNİN KESİRLER KONUSUNDA KAVRAMSAL VE İŞLEMSEL ANLAYIŞLARI
Şakire Örmeci
Yüksek Lisans, Eğitim Programları ve Öğretim Tez Yöneticisi: Yrd. Doç. Dr. Minkee Kim
Mayıs 2012
Bu araştırmanın esas amacı başarılı ve daha az başarılı öğrencilerin kesirler konusunda kavramsal ve işlemsel bilgilerini karşılaştırmaktır. Araştırmada ayrıca kavramsal bilgi ile işlemsel bilgi arasında ilişki olup olmadığı ve daha az başarılı öğrencilerin kesirler konusunda yaşadıkları zorluklar incelenmiştir.
Bu çalışmada iki basamaklı açıklayıcı karma araştırma metodu kullanılmıştır. Araştırmanın birinci basamağında, toplam 33 yedinci sınıf öğrencisine kavramsal ve işlemsel bilgi testi uygulanmıştır. Araştırmanın ikinci aşamasında ise iki tane başarılı (ST33 ve ST24) ve iki tane daha az başarılı öğrenci (ST01 ve ST03) ile mülakat yapılmıştır.
Kavramsal ve işlemsel bilgi testinin sonuçları, kavramsal ve işlemsel bilgi arasında pozitif bir korelasyon olduğunu göstermiştir. Ayrıca öğrencilerin 6. sınıf yıl sonu matematik notu ile hem kavramsal hem de işlemsel bilgileri arasında pozitif yönde
bir ilişki bulunmuştur. Kavramsal ve işlemsel bilgi testini takiben yapılan mülakatlarda sonucunda başarılı öğrencilerin kesirler konusunda kavramsal ve işlemsel bilgilerinin birleşik olduğu bulunurken daha az başarılı öğrencilerin salt işlemsel bilgiye sahip oldukları tespit edilmiştir. Araştırmanın bütün bu sonuçları gösteriyor ki öğrencilerin matematiksel konuları tam anlamıyla öğrenebilmeleri için kavramsal ve işlemsel bilginin her ikisine sahip olmaları gerekir.
Anahtar kelimeler: Kavramsal bilgi, işlemsel bilgi, birleşik kavramsal ve işlemsel bilgi, salt işlemsel bilgi, kesirler.
ACKNOWLEDGEMENTS
I would like to present my appreciation to Prof. Dr. Ali Doğramacı, Prof. Dr. M. K. Sands and everyone at Bilkent University in the Graduate School of Education for support throughout my masters program.
My special appreciation goes to my advisor Asst. Prof. Dr. Minkee Kim, who always challenged me to think hard about issues and helped me grow as a researcher. I also appreciate his honest and open communication with me that allowed me to go further in my thesis process. I would also like to offer my appreciation to Prof. Dr. Cengiz Alacacı who shared his wisdom with me while I worked on the framework of my thesis. In addition I would like to thank school teachers Zerrin Toker and Bülent Sert. I am very grateful to them for their help to me during my data collection.
I would also like to thank my friends who share their friendship with me and made me feel peaceful whenever I was in trouble. Especially I would like to thank my good friends Hilal and Gökçen.
Finally I would like to thank my family for their sincere support and real love to me during my education life. Without the support and help of these valuable people in my life, it would have been very difficult for me to finish this study.
TABLE OF CONTENTS
ABSTRACT ... iii
ÖZET... v
ACKNOWLEDGEMENTS ... vii
TABLE OF CONTENTS ... viii
LIST OF TABLES ... xi
LIST OF FIGURES ... xii
CHAPTER 1: INTRODUCTION ... 1
Introduction ... 1
Background ... 1
Conceptual knowledge and procedural knowledge... 1
Fractions in mathematics education ... 3
Problem ... 4
Purpose ... 4
Research questions ... 5
Significance ... 5
Definitions of key terms ... 6
CHAPTER 2: REVIEW OF LITERATURE ... 7
Introduction ... 7
Procedure-first view ... 8
Iterative model ... 8
Individual differences... 9
Characterization scale for conceptual and procedural knowledge ... 10
Fractions in mathematics... 11
Meanings of fractions ... 11
Representation models of fractions ... 14
Conceptual knowledge and procedural knowledge of fractions ... 16
Learning difficulties and misconception in fractions ... 17
Summary ... 20 CHAPTER 3: METHOD ... 21 Research design ... 21 Context ... 21 Participants ... 22 Instrumentation ... 22
Conceptual knowledge and procedural knowledge test (CPKT) ... 22
Follow-up interview ... 23
Method of data collection... 24
Method of data analysis ... 25
CHAPTER 4: RESULTS ... 27
Introduction ... 27
Findings from CPKT ... 27
Students’ profiles of conceptual knowledge and procedural knowledge
regarding the content knowledge ... 30
Comparison between successful and less successful students’ conceptual and procedural understanding of fractions ... 33
Difficulties and misconceptions about fractions among the less successful students ... 35
CHAPTER 5: DISCUSSION ... 38
Introduction ... 38
Discussions of the findings ... 38
Strong positive correlation between CK and PK ... 38
Orphaned procedural knowledge of the less successful students to combined knowledge of the successful students ... 39
Difficulties and misconceptions of less successful students about fractions ... 40
Implications for practice ... 43
Implication for future research ... 45
Limitations ... 45
REFERENCES ... 47
APPENDICES ... 53
Appendix A: Background form ... 53
Appendix B: Conceptual and procedural knowledge test (CPKT) ... 54
Appendix C: Semi-structured ınterview questions ... 63
Appendix D: Parent informing and permission letter ... 64
LIST OF TABLES
Table Page
1 Characterization scale for conceptual knowledge, procedural knowledge, and
coupled conceptual and procedural knowledge (Baki & Kartal, 2004) ... 10
2 Representation models of fractions (Alacaci, 2010; Petit et al., 2010) ... 15
3 Example questions for measuring conceptual and procedural knowledge... 16
4 Interview protocols concerning the seven contents ... 24
5 Levels of students according to GPA, and z-scores of CK and PK ... 28
6 Four quadrants of the student distribution with regards to CK and PK ... 29
LIST OF FIGURES
Figure Page
1 The relation between meanings of fractions and related fraction concept
(Charalambous & Pitta-Pantazi, 2007)………13
2 Examples for representation models of fractions………15
3 Is 1/4 of rectangle shaded?...17
4 Half of a big pizza and half of a small pizza………...19
5 Z-scores scatter plots of procedural knowledge (PK) and conceptual knowledge (CK)……….29
6 Similar procedural levels ( (3) = 0.4, p > .05) to different conceptual levels whereas ( (3)= 8.73, p < .05)………..34
CHAPTER 1: INTRODUCTION
Introduction
Many primary and middle school students have difficulty understanding certain mathematical topics and problem solving in these topics. In order to understand students’ learning mathematical concepts, many researchers have analyzed how students acquire mathematical knowledge (Hallett, Nunes, & Bryant, 2010; Hiebert & Lefevre, 1986; Rittle-Johnson & Alibali, 1999). These studies have focused on two main types of knowledge: conceptual knowledge and procedural knowledge. One of the problematic topics for primary school students is the concept of fractions. Students have difficulties with the concept of fractions and the operations related to them (İpek, Işık, & Albayrak, 2010). Hence, this study analyzed successful and less successful seventh grade students’ conceptual and procedural understanding of fractions.
Background
Conceptual knowledge and procedural knowledge
For three decades, conceptual and procedural knowledge has been a popular educational research topic in literature. The research on this topic has attempted to answer the question of how students acquire mathematical knowledge (Hiebert & Lefevre, 1986). Since Hiebert and Lefevre (1986) defined conceptual knowledge and procedural knowledge, these two types of knowledge have been accepted as the main types of knowledge by educators and researchers. Especially in mathematics and
science, conceptual and procedural knowledge constitute essential parts of student understanding and the learning of mathematical and scientific concepts (Haapasalo, 2003; Heyworth, 1999; Mccormick, 1997; Rittle-Johnson & Alibali, 1999; Schneider & Stern, 2005). Conceptual and procedural knowledge are interrelated (Baki & Kartal, 2004; Hiebert & Lefevre, 1986). Hence, for mathematical competency, students should iteratively develop both conceptual and procedural knowledge (Birgin & Gürbüz, 2009; Rittle-Johnson & Alibali, 1999). However, due to the nature of mathematics, the conceptual aspect of mathematical concepts is sometimes ignored and the procedural aspects are highlighted during instruction. This often leads to rote-learning of procedures without understanding their meanings.
Recently, conceptual and procedural knowledge have become a popular concern in Turkish education. There are studies investigating the conceptual and procedural achievements of Turkish students at different grade levels (Aksu, 1997; Birgin & Gürbüz, 2009), at the high school level (Baki & Kartal, 2004) and at the university level (İpek et al., 2010; Soylu & Aydın, 2006). The results of these studies show that Turkish students from different grade levels have gained predominantly procedural knowledge and inadequate conceptual knowledge. In addition, these studies attempt to explain the reason for students’ failures in mathematics regarding their inadequate conceptual knowledge (Aksu, 1997; Baki & Kartal, 2004; Soylu & Aydın, 2006). In 2004, Turkey made changes in the national curricula from being teacher-centered towards being student-centered. The earlier educational system in Turkey
emphasized procedural knowledge and mostly skipped the conceptual knowledge of mathematical topics; hence this led students not to comprehend topics deeply but to learn by rote. On the other hand, the new curricula has a conceptual approach to
provide students to comprehend mathematical topics by using their experience (MoNE, 2005). In addition, new curricula with the constructivist approach aims for students to acquire conceptual knowledge and then link it with procedural knowledge in order to communicate with mathematical language (Alkan, 2008). Despite the reform of the Turkish national curricula, university and high school entrance exams with multiple choice questions cause students to learn by rote and to apply certain procedures rather than to conceptualize the topics. This stands as a handicap for the Turkish educational system (Argün, Arıkan, Bulut, & Sriraman, 2010).
Fractions in mathematics education
Fractions are a fundamental topic in mathematics education and constitutes a basis for several topics, such as rational numbers, ratio and measurements (İpek et al., 2010). Fractions are also one of the complicated mathematical topics that often produce difficulty with students (Aksu, 1997; Alacaci, 2010; İpek et al., 2010). In addition students deal with fractions through their education life from primary education. Hence teaching fractions holds an important place in mathematics education.
In Turkey, fractions are taught from the first grade to the eighth grade with
appropriate difficulties for each grade level (MoNE, 2009a, 2009b). In the Turkish mathematics curriculum, fractions are introduced with part-whole meaning and different sub-concepts (e.g. compound fraction, proper fraction) are taught to students. The topic is also related to topics such as ratio, decimal numbers,
percentage, and is generalized to the topic of rational numbers from primary school to secondary school (Alacaci, 2010).
Problem
The literature shows that there are many aspects to be addressed regarding students’ conceptual and procedural understanding of fractions. Some of these studies focused on the acquisition of conceptual and procedural knowledge with an experimental approach (Hallett et al., 2010; Schneider & Stern, 2005), some focus on pre-service teachers’ conceptual and procedural knowledge of the fractions (İpek et al., 2010; Rayner, Pitsolantis, & Osana, 2009), and others measured students’ conceptual and procedural knowledge levels in fractions (Aksu, 1997; Birgin & Gürbüz, 2009). These studies pointed out the general picture rather than analyzing students’
conceptual and procedural understanding deeply with regard to a mathematical topic such as fractions. Although there are studies that examine students’ understanding of fractions (Mitchell & Clarke, 2004; Wong & Evans, 2007), there is little descriptive research on successful and less successful students’ conceptual and procedural understanding of fractions.
Purpose
The main purpose of this study was to compare successful and less successful
seventh grade students with respect to their conceptual and procedural understanding of fractions. As a mixed-methods study, firstly this study determined students’ conceptual knowledge and procedural knowledge of fractions with a paper-pencil test. This test revealed information about the correlation between students’
conceptual knowledge and procedural knowledge of the topic of fractions and it was used to determine successful and less successful students. Secondly, to examine in detail the differences and similarities between successful and less successful
students’ usage of conceptual and procedural knowledge of fractions, the study conducted a follow-up interview with four students.
Research questions
The main question of the study: What are the differences and similarities between successful and less successful seventh grade students with respect to their conceptual and procedural understanding of fractions?
In the light of the main question, the sub-questions being examined were:
1. What is the relative strength of conceptual knowledge (CK) and procedural knowledge (PK) in fractions among participating students?
2. Is there any relation between conceptual knowledge (CK) and procedural knowledge (PK)?
3. What kinds of difficulties do less successful students have about the concept of fractions?
Significance
Examining conceptual knowledge and procedural knowledge of successful and less successful seventh grade students in the domain of fractions could provide valuable information about the achievement of successful students and the inefficiency of less successful students with the topic of fractions. Hence, this study can aid educators and researchers to resolve problems that middle school students encounter when they learn fractions.
Definitions of key terms
Conceptual knowledge (CK) is defined by Hiebert and Lefevre (1986) as “a connected web of knowledge, a network in which the linking relationships are as crucial as the discrete pieces of information” (p.3) and stated that the main
characteristic of conceptual knowledge is “being rich in relationships” (p. 4). In line with this, Rittle-Johnson and Alibali (1999) described conceptual knowledge as “explicit or implicit understanding of principles that govern the interrelations between pieces of knowledge in a domain” (p.175).
Procedural knowledge (PK) is characterized as knowledge that consists of two parts: “the official language or symbol representation system of mathematics”, and “the algorithms or rules for completing mathematical tasks” (Hibert & Lefevre, 1986, p.6).
CHAPTER 2: REVIEW OF LITERATURE
Introduction
To analyze students’ conceptual and procedural knowledge of fractions, this literature review gives information about the relation between conceptual and procedural knowledge, characterization of conceptual and procedural knowledge, conceptual and procedural aspects of learning fractions, and learning difficulties and misconceptions about fractions.
Relationships between conceptual and procedural knowledge
For three decades, many mathematics educators have examined the relation between conceptual knowledge and procedural knowledge to understand how students’ learning processes develop. There are different views related to the primacy of conceptual knowledge and procedural knowledge while children learn mathematics. Rittle-Johnson and Siegler (1998) described theories about acquiring conceptual and procedural knowledge with regard to their direction: concepts-first, procedure-first, and iterative model.
Concept-first view
Rittle-Johnson and Siegler (1998) proposed the concept-first theory. According to this theory, students firstly acquire conceptual knowledge then derive procedural knowledge from it. In other words conceptual knowledge comes before procedural knowledge. Schneider and Stern (2005) explained this theory by saying “students
firstly listen to verbal statements of the concept and then by practicing, derive procedural knowledge.” (p. 1)
Procedure-first view
On the other hand, procedure-first theory suggests that students initially learn procedural knowledge than gradually acquire conceptual knowledge (Schneider & Stern, 2005). In addition, Rittle-Johnson and Siegler (1998) explained the procedure-first theory that “procedural knowledge develops before conceptual knowledge” (p.77). For instance, students firstly learn procedural rules and by trial and error methods then practice the procedure a few times and obtain insight about the meaning of the topic which is conceptual knowledge.
Iterative model
Another theory suggested by Rittle-Johnson and Siegler (1998) is that conceptual knowledge and procedural knowledge develop iteratively and increasing in one kind of knowledge leads to increasing the other. Schneider and Stern (2005) later called this method the iterative model that has become the most common view. In this light, Silver (1986) claims that procedural knowledge can be quite limited unless it is connected to conceptual knowledge. Similarly, Schneider and Stern (2005) state that there may be bi-directional relations between conceptual and procedural knowledge after children have prior conceptual knowledge to learn new procedural and
conceptual knowledge iteratively. For example, when a student comprehends what a fraction means, she/he can solve operational problems easily and then learn new procedural knowledge such as division of fractions. Learning new procedural knowledge also helps students develop conceptual knowledge. In other words,
gaining one type of knowledge (conceptual or procedural) in a topic leads to gaining the other type of knowledge (procedural or conceptual).
Individual differences
Recently, Hallett et al. (2010) suggest that the variety of different views about the relationship between conceptual and procedural knowledge is due to individual differences in learning conceptual and procedural knowledge. They propose that children may have different learning profiles with regard to connecting conceptual knowledge and procedural knowledge. Therefore to understand what affects the learning style, such as developmental processes, facilities or interest, Hallett et al. ask the question: How could there be a child with a predominantly procedural profile if concepts are supposed to be learned first or vice versa? With the help of cluster-analysis technique, they concluded that there were subgroups of children who used conceptual and procedural knowledge differently to solve fraction problems.
The literature has revealed that a mathematical topic is learned by the help of both conceptual knowledge and procedural knowledge. Conceptual knowledge helps students learn a topic by the construction of rich links between pieces of previous knowledge and subtopics (Hiebert & Lefevre, 1986). Students need to understand the meaning of concepts before learning the related algorithms in order to internalize the procedural knowledge of the topic (Saenz-Ludlow, 1995). In other words, the
conceptual knowledge leads students to know the meaning of the procedures and solve mathematical problems in a logical way rather than by rote. Therefore, it can be inferred that conceptual knowledge is important in helping students to construct understanding of a topic and also its related procedures.
Characterization scale for conceptual and procedural knowledge
Baki and Kartal (2004) developed a scale for characterization of conceptual and procedural knowledge in the light of definitions and classification of conceptual and procedural knowledge in the literature. Although this scale was developed to
evaluate students’ answer about the topic algebra, it can be applied to other mathematical topics such as fractions. The criteria consist of general features of conceptual and procedural knowledge. Table 1 presents this characterization scale:
Table 1
Characterization scale for conceptual knowledge, procedural knowledge, and coupled conceptual and procedural knowledge (Baki & Kartal, 2004)
Knowledge type Characterization Criteria
Procedural knowledge (P)
P1.Solving procedures step by step
P2.Using mathematical knowledge which was learnt before (theorem, definitions, property, rules) in the level of knowledge (the bottom level of Bloom’s taxonomy)
P3.Being able to use algebraic relations and to conduct basic procedures
Conceptual knowledge (C)
C1.Knowing basic concepts and meaning of these concepts C2.Finding solution way by grasping the meaning of question and
correlating given information with intended result
C3.Using mathematics knowledge which was learnt before (theorems, definitions, and postulates) in the level of comprehension and application
C4.By perceiving question as whole, appreciating hints properly and relevantly
C5.Dividing problem into easy sub-steps
C6.Making generalization and drawing shape and figures to back up a complex and hard problem
C7.Matching the problem with given figure and graph
C8.Matching problem with the features of this problem after determining these features Coupled conceptual and procedural knowledge (C-P)
C-P1.Understanding, using, writing, retrenchment, and simplifying the symbols and statements which constitute of language of mathematic C-P2.Solving equation after converting problem into equation and checking
rationality of solutions.
C-P3.Converting given relation into another relation by associating these relations among themselves.
Fractions in mathematics
Fractions is the topic that presents a framework for many topics in secondary school, high school mathematics, and even further mathematics concepts such as rational numbers, ratio, measurement of quantities, and algebraic fractions. Thus fractions have an important place in mathematics education (Alacaci, 2010; İpek et al., 2010). In addition to being the framework of many mathematical topics, fractions are among the most complex and rich mathematical concepts that students encounter in primary education (Alacaci, 2010; Charalambous & Pitta-Pantazi, 2007). There is a consensus on the reason for the complexities of learning fractions which states that fractions have an interrelated construct (Kieren, 1993; Lamon, 1999). The
interrelated sub-constructs of fractions are identified as the five meanings of
fractions: part-whole meaning, ratio meaning, operator meaning, quotient meaning, and measure meaning. These meanings are represented in four different models: region, area, number line and set (Alacaci, 2010; Charalambous & Pitta-Pantazi, 2007; Lamon, 1999).
Meanings of fractions
Part-whole meaning
Part-whole meaning of a fraction is defined as a situation where the fraction represents one or more parts of a quantity or a set of objects that is partitioned into equal parts (Lamon, 1999). Hence the denominator of a fraction expresses the whole and how many parts it was divided. In addition, part-whole meaning is the most used meaning in teaching fractions and presents a base for other meanings of fractions (Alacaci, 2010; Charalambous & Pitta-Pantazi, 2007). The most important feature of part-whole meaning is equal partitioning so that students can comprehend
sufficiently this meaning and its features to learn and not to confuse this with other meanings.
Ratio meaning
Lamon (1999) defines the ratio as the comparison of two quantities of the same type. For example, comparison of the number of girls in a class to the number of boys represents a ratio. In addition it is not necessary for comparison parts to represent together the whole (Alacaci, 2010). Ratio meaning comprises a conceptual base for equivalent fractions.
Operator meaning
Operator meaning of fractions is regarded as shrinker or stretcher; duplicator or partitioning quantities (Alacaci, 2010; Charalambous & Pitta-Pantazi, 2007). For instance, the question “after shrinking a number by , which fraction should be multiplied by the new number to obtain original number?” is related to operator meaning. Charalambous and Pitta-Pantazi (2007) emphasized the conceptual relation between fraction multiplication and operator meaning of the fractions. Hence
students can learn the fraction multiplication concept with operator meaning.
Quotient meaning
Quotient meaning of fractions mostly deals with sharing problems of one or more quantities to individuals or something (Alacaci, 2010; Kieren, 1993). Unlike part-whole meaning, within the quotient meanings two different measures are considered (Charalambous & Pitta-Pantazi, 2007). For example, three apples are shared among
five people with the question: “How much apple does each person get?” represents the quotient meaning of fractions. In this meaning equal partitioning is important.
Measure meaning
Measure meaning represents measurement quantities such as length, area and volume that could not be defined by integers (Alacaci, 2010). For example, to explain altitudes above the sea, it can be said that the mountain has km altitudes. This meaning helps students to accept fractions as a number and lets them gain insight about the addition of fractions (Alacaci, 2010; Charalambous & Pitta-Pantazi, 2007; Lamon, 1999).
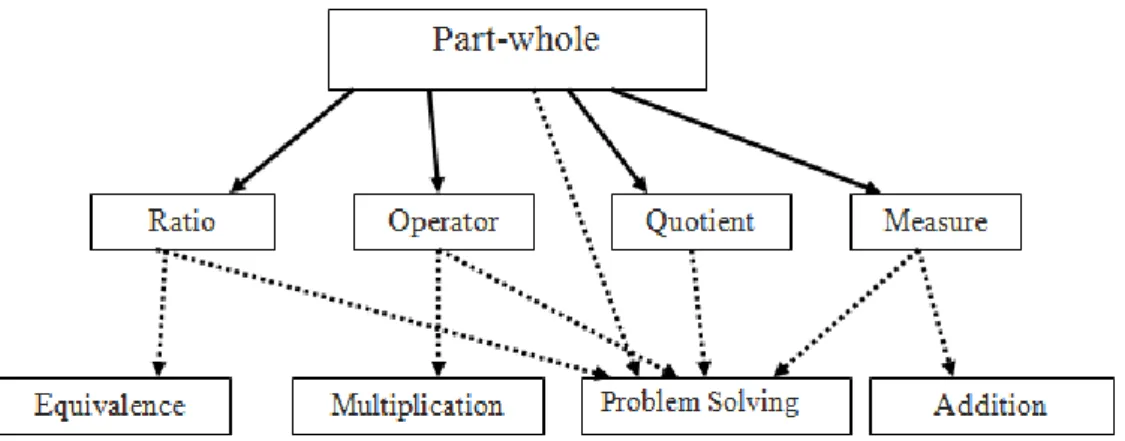
Charalambous and Pitta-Pantazi (2007) suggested a model of the links between meanings of fractions and also sub-concepts and operations with fractions as shown in the Figure 1. The part-whole meaning provides base for other meanings and it is correlated with sub-concepts and operations of fractions through other meanings. Because of the interconnected structure of fractions, it is necessary to be careful and act responsibly during the teaching of fractions with all aspects of fractions should be taught gradually (Alacaci, 2010).
Figure 1. The relation between meanings of fractions and related fraction concept (Charalambous & Pitta-Pantazi, 2007)
Representation models of fractions
There are four types of representation models for fractions: region, area, number line, and set models. In some resource for fractions, region model and area model are accepted as same models (Petit, Laird, & Marsden, 2010), but region and area models differ to a point.
In the region model, the whole is partitioned into equal parts and chosen parts are highlighted (see A, Figure 2). The important feature of the region representation model is that parts should be equal in size and shape. This model is strongly related to the part-whole meaning of fractions and is commonly used for the representation model in the teaching of fractions (Alacaci, 2010).
The area representation model has a minor difference from the region model. This difference is that the parts should not be same shapes. However, the parts should have equal areas. Figure 2 B is an example of area representation and both lined area and highlighted area represent as fraction.
Furthermore, fractions are represented on number lines as numbers. Units on the number line are divided into equal lengths and so the location of points indicates the fraction (see Figure 2 C). This representation model is a useful model for teaching the measurement the meaning of fractions (Alacaci, 2010).
The last representation model is the set model. In this model, fractions are
represented by a subset of a set of objects. The objects comprising the set cannot be divided into small parts since the parts represent the unit of the fraction (Alacaci, 2010; Lamon, 1999). The example for set representation model is Figure 2 D which
represents the fraction which shows the comparison of lined triangles to all triangles. This model can be used to teach the ratio meaning of fractions (Alacaci, 2010; Petit et al., 2010). For example, in Figure 2, the ratio of lined triangles to highlighted triangles is . Features of representation models for fractions are summarized in the Table 2.
Figure 2. Examples for representation models of fractions
Table 2
Representation models of fractions (Alacaci, 2010; Petit et al., 2010) The Whole “Equal parts” are
defined by
What the fraction indicates Region model The whole is determined by
total area of a defined region
Equal in size and shape
The part covered of whole unit of area
The part covered of whole unit of area
Area Model The whole is determined by total area of defined region
Equal in size (area) not necessary equal in shape
Set model The whole is determined by daefinition (set of objects)
Equal number of object
The count of objects in the subset of the defined set of objects
Number line Unit of distance or length Equal distance The location of a point in relation to the distance from zero with regard to the defined unit
Conceptual knowledge and procedural knowledge of fractions
Various measurements in many studies indicate that students’ procedural skills are higher than their conceptual competency in solving fraction problems (Aksu, 1997). Baki and Kartal (2004) argue that the reason for students’ predominance procedural knowledge is learning fractions based on procedural knowledge. So that, most students tend to forget how to solve fraction problems after a while, even after years of practice. Lamon (1999) defends that the main reason for students having difficulty with fractions is the gaps in conceptual understanding of fractions. Hence to better understand students’ problems with the topic of fractions, it is necessary to determine conceptual knowledge and procedural knowledge of fractions. Conceptual
knowledge of fractions is mainly related to its meaning, the perception of proportion and whole numbers. On the other hand, procedural knowledge is related to
computation with fractions and it depends on certain rules. For example, the rule for dividing fractions is inverting the second fraction and multiplying it with the first one. Hence students can easily solve procedural problems by using the relevant rules. Some conceptual and procedural problems about fractions that were used in previous research are given in the Table 3:
Table 3
Example questions for measuring conceptual and procedural knowledge
Conceptual Items: Procedural Items:
In a whole or 1, how many thirds are there? How many times as much as ¼ is three quarters? Which is greater ½ or ¼ ?
(Aksu, 1997) Circle the fraction CLOSER in size to 1/2: 5/8 or 1/5.
Erin won 5/8 of the games he played; Pat won ¾; Val won 9/16; and Kelly won 2/3. Which of the players had the best record?
Jane said that 12 1/2 is 6, but Summy said no, it is 24. Which is right? How do you know?
5 + 3/8= ? 30* 3/5=? 1/8 – 1/9=? 7 ½ 1 ¼ =?
(Aksu, 1997) Circle the correct answer for: 5+ ½ + 0.5 a. It cannot be done; b. 5; c. 5.5; d. 6; e. 1
(Sowder et al., 1998) One pizza has to be shared equally between 5 girls. What fraction of pizza does each girl
Learning difficulties and misconception in fractions
Although students have little difficulty in learning natural numbers, most of them are challenged with fractions and develop misconceptions because of its complex nature. There are many researches presenting reasons for difficulties and misconceptions about this topic of fractions. Alacaci (2010) mentioned that most of the
misconceptions about fractions are caused from students generalizing the rules of integers to fractions. On the other hand, Amato (2005) stated that one of the reasons for students’ learning difficulties about fractions was seeing fractions as only part of a shape or a whole not as a number. These are the general reason for difficulties and misconceptions about fractions. There are also studies about common
misconceptions and difficulties that students have related to specific sub-concepts of fractions.
One of the misconceptions about fractions is related to the equal partitioning. Petit et al. (2010) state that when students were asked whether the shaded area as in the Figure 3 represents of whole shape or not, some of them answered that it represents by just focusing on the number of divided pieces. The reason of this misconception is that teaching fractions based on symbols (e.g., ) and rules rather than letting students comprehend conceptual knowledge of fractions (Alacaci, 2010; Litwiller & Bright, 2002).
Furthermore, students have difficulties comparing quantities of fractions since they are usually taught the concept of fractions related to the whole number concept (Mitchell & Clarke, 2004). For example, when students were asked which fraction was bigger, 1/3 or ¼, they often say that ¼ is bigger since they think as a natural number 4 is bigger than 3 (Nunes, Bryant, Hurry, & Pretzlik, 2006). Another misconception about the comparison of fractions is related to just focusing on denominator and ignoring numerator-denominator relation (Haser & Ubuz, 2000; McLeod & Newmarch, 2006). For instance, when students were asked to compare fractions and , they say is bigger than since they think that a bigger
denominator makes a fraction smaller and so ignored the relation between denominator and numerator (Alacaci, 2010).
Another misconception is incorrect fraction addition (Alacaci, 2010). In this misconception students add numerators and denominators between each other (e.g. + = ). The reason for this misconception involves the applying rules of integer (Haser & Ubuz, 2000; McLeod & Newmarch, 2006).
In addition, students have misconception about fractions, which arises from the ignoring reference whole. Many students consider that a fraction represents same quantity for different shapes (Alacaci, 2010). This shows that students do not have knowledge that the quantity represented by a fraction depends on the reference whole. For example, the fact that of a big pizza is bigger than of a small pizza is often misunderstood, see Figure 4.
Figure 4. Half of a big pizza and half of a small pizza
The last type of students’ misconception is related to fraction division and
multiplication (Aksu, 1997; Fredua-Kwarteng & Ahia, 2006). Despite the ease of applying rules for division and multiplication of fraction, students find it hard to explain why dividing a fraction produces a bigger value since dividing numbers creates smaller value for natural numbers. According to Liping (1999), division by fraction is the most complicated operation to understand during elementary school years. In his book, he compared Chinese and US teachers’ understanding of fraction division and performance on calculation, and found significant differences. His study indicated that US teachers’ conceptual understanding of fraction division is weaker than the Chinese teachers’. Furthermore, the study found that all of the Chinese teachers solved the same division problem correctly whereas only 43% of US
teachers performed the correct calculation. This study indicates that not only students but also teachers have some difficulties about the division of fractions. Hence this variation shows that for total comprehension of a topic, it is necessary to learn the meaning of the concept and its related procedure.
Summary
Throughout this review, conceptual and procedural knowledge was found to form two main aspects of knowledge for the learning of mathematical topics. Conceptual knowledge is critical to the construct of fundamental knowledge of the topics by linking relevant mathematical concepts and to make meaningful the procedural knowledge. The topic in mathematics education, fractions, represents frameworks for various important concepts such as rational numbers, proportions, and decimal numbers. Many students have difficulties with the understanding of fractions. Especially, students find it challenging to understand the meaning of fractions, or conceptual knowledge of fractions because of its complex structure. The gap in the conceptual knowledge of fractions leads students to a restricted procedural
knowledge so that they apply the procedures by rote without understanding their meanings.
CHAPTER 3: METHOD
Research design
This study was conducted with a mixed-methods approach using explanatory design with a follow-up explanation procedure (Creswell & Clark, 2007). Explanatory design consists of two sequential phases in the order of quantitative to qualitative. The follow-up procedure was applied while researcher used qualitative data to explain and expand the quantitative data collected in the first phase (Creswell & Clark, 2007). Consequently, this study was conducted into two phases; starting with a conventional paper-pencil test to collect quantitative data and continued with an interview to collect qualitative data. The conventional paper-pencil test was a useful instrument to analyze students’ performance and to determine their level of success relative to other students (Heyworth, 1999). The follow-up interview provided deeper information about how students obtain answers for a specific question and their mental process (Heyworth, 1999). Hence, how students use conceptual knowledge (CK) and procedural knowledge (PK) in the paper-pencil test was analyzed in more detail in this current study.
Context
This study was conducted in a private secondary school in Ankara, Turkey with students of a seventh grade class. Since fractions are taught towards the end of the first semester in sixth grade, this study was applied to seventh grade students in the first semester of the school year.
Participants
This study was applied to seventh grade students and conducted with two randomly selected seventh grade classes sampling a total of 33 students. In order to provide for students’ confidentiality and to perform data analysis without prejudice, a code was given to each student before the test. This had been explained to the students and the researcher wanted students to write the code on the test instead of their name.
However, these codes were changed to make the findings understandable for readers. Hence students’ codes are like ST01 to ST33 which were given according to
students’ mathematics GPA in ascending sort (e.g. ST01 with lowest GPA and ST33 with highest GPA).
Furthermore, the paper-pencil test was administered to all students in these classes. Results in conceptual knowledge and procedural knowledge test (CPKT) was used to select two successful students (ST24, ST33) who earned higher scores from both CK and PK tests and two less successful students (ST01, ST03) who received lower scores from both CK and PK tests for the follow-up interview. Parents of students participating in the study were informed and their permission was obtained via a letter (see Appendix D).
Instrumentation
Conceptual knowledge and procedural knowledge test (CPKT)
The paper-pencil test was developed by the researcher and contained conceptual and procedural questions to analyze students’ conceptual and procedural understanding of fractions. The questions were prepared according to MoNE’s objectives for
Sowder et al., 1998; Van de Walle, 2007). In addition the test items were designed to find out the students’ understanding of the seven areas in fractions: (1) meaning of fractions, (2) comparison fractions, (3) reference whole, (4) concept of addition and subtraction of fractions, (5) concept of fraction multiplication and division, (6) representation of fractions and (7) rules of operations. These contents are related to difficulties which students generally had and which were highlighted in previous studies (Alacaci, 2010; Charalambous & Pitta-Pantazi, 2007; Lamon, 1999).
In order to provide the validity and reliability of this test, the opinion of two
secondary school teachers and one academician were collected. The expert opinion form was added in the appendix (see Appendix E). Necessary changes in the context and format of the test were conducted after consulting the expert and the teachers. The final version of the test contained 13 conceptual questions and 8 procedural questions (see Appendix B). This test was given to students during two lesson hours (totally 80 minutes) and observed by the researcher to prevent possible problems during the examination. Since the teacher of the classes emphasized the importance of the test at the beginning of the exam, it was observed that all students tried to solve test problems seriously.
Follow-up interview
The follow-up interview aimed to identify differences and similarities between successful and less successful students with regard to their understandings of fractions. With respect to the students’ answers on the paper-pencil test, the interview questions were designed referring to the seven contents of fractions
mentioned above (see Appendix C). The main questions utilized in the interview and their focus content are shown in Table 4.
Table 4
Interview protocols concerning the seven contents
Contents Interview Question
Meaning of fractions Comparison of fractions
Reference whole Addition & subtraction
Fraction multiplication & division Representation of fractions Rules of operations 1 and 2 3 4 5 6 7 8
The questions were asked in order to find out students’ conceptual and procedural understanding. Since the interview was semi-structured, extra questions rather than the ones in the Appendix C were asked to allow students to explain their
understanding and to find out what they know and what they do not know. The extra questions depended on students’ answers to main questions and related to the seven contents. Some of the questions were as follows:
This is one of the examples for the meaning of fractions. According to you, is there any other meaning of fractions? Do you know?
If you did not do any calculation, without finding common denominator, how could you have compared fractions?
If I want to add these fractions and ask you add them together by modeling, what should we do?
Why do we find the common denominator? Why is it necessary? What does fraction multiplication do to make number smaller?
Method of data collection
Background form was given to the students to collect demographic information just before the test (see Appendix A). In addition, another purpose of this form was to gather information about the students’ general disposition towards mathematics and their overall mathematics GPA. However, most of the students did not remember their GPA. Hence students’ mathematics GPAs of the previous year were found
In the first phase of study, students’ answers for the conceptual and procedural questions in CPKT were the initial data regarding students’ understanding of
fractions. The data collected in the first phase was also provided a framework for the interview. Hence in the second phase, focusing on students’ verbal response and their understanding of the fraction concept was analyzed in detail.
Method of data analysis
In the first phase of the study, the students’ results on the conceptual and procedural knowledge test were determined by an answer key prepared by the researcher. The answer key was also checked and approved by the classroom teachers and was approved. Each question in the conceptual part of the test was graded using 0, 0.5, 1 points where the 0 point was an incorrect answer and wrong explanations, the 0.5 point was an incorrect answer with some reasonable correct explanations, and the 1 point was the correct answer with explanations. Similarly each procedural question was graded with 0 or 1 where 0 was the incorrect solution and 1 was the correct solution. Since there were 13 conceptual and eight procedural questions with further sub-questions, the conceptual part of the test was evaluated out of 20 and procedural part was evaluated out of 11.
In order to determine the students’ level of conceptual and procedural knowledge, z-scores were calculated for the students’ total z-scores in each part of the test.
Correlation analysis was performed to determine whether there was a relationship between students’ conceptual knowledge and procedural knowledge. The analysis of the test was performed by the correlational statistics software SPSS package 18.
In the second phase of the study, the follow-up interview was conducted one week after the first phase. It was carried out with two successful (ST24, ST33) who
received higher scores in both conceptual knowledge and procedural knowledge tests and two less successful students (ST01, ST03) who received lower scores from both parts of the test. Interviews were made in Turkish and recorded by a voice recorder. The researcher transcribed the interviews into English. The interview data was analyzed with respect to the seven areas of fractions (see instrumentations). After transcription, students’ answers to the interview questions were coded according to knowledge types, for conceptual knowledge (CK), procedural knowledge (PK), coupled conceptual and procedural knowledge (C-P), and misconceptions (MC). Students’ knowledge was determined by a characterization scale for conceptual and procedural knowledge which was developed by Baki and Kartal (2004) and students’ misconceptions were determined by related literatures (Alacaci, 2010; Pesen, 2007) .
CHAPTER 4: RESULTS
Introduction
A conceptual knowledge and procedural knowledge test (CPKT) was given to 33 students from two seventh grade classes in a private school in Ankara, Turkey. The test items were designed to find out students’ conceptual knowledge (CK) and procedural knowledge (PK) levels of fractions regarding seven contents of : meaning of fractions, comparison fractions, reference whole, the concept of addition and subtraction with fraction, the concept of fraction multiplication, and representation of fractions and rules of operations.
In the light of the research question and sub-questions, this study investigated during the follow-up interviews what the differences and similarities were between
successful and less successful students’ conceptual and procedural understandings of fractions, and what type of difficulties less successful students had about the concept of fractions.
Findings from CPKT
With regard to the research questions and the sub-questions, students’ levels of CK and PK were determined in order to highlight their relationship. According to test results, students’ levels were determined by z-scores of total CK (M=12.73, SE= 3.18) and PK (M=7.06, SE=2.54) scores. Table 5 indicates students’ level of CK and PK, and last year’s GPA in mathematics.
Table 5
Levels of students according to GPA, and z-scores of CK and PK
Students GPA Z-score of CK
Z-score of PK
Students GPA Z-score of CK Z-score of PK ST01 44.5 -2.38 -1.21 ST17 79 0.24 -0.02 ST04 54.7 -2.23 -1.60 ST18 79.1 0.24 -0.81 ST06 59.2 -1.61 -1.60 ST28 88.9 0.24 0.76 ST03 52.4 -1.46 -1.21 ST19 79.2 0.39 0.76 ST07 59.8 -1.15 -1.21 ST27 87.5 0.39 0.76 ST12 70.7 -0.84 -0.42 ST29 89.8 0.39 1.16 ST14 72.9 -0.84 -0.42 ST13 70.7 0.55 -0.81 ST05 55.8 -0.53 -1.21 ST15 74.1 0.55 -0.42 ST10 67 -0.38 0.37 ST16 78.4 0.55 -1.21 ST08 60.3 -0.22 1.55 ST24 84.7 0.70 0.76 ST26 86.2 -0.22 -0.42 ST30 90.1 0.70 0.76 ST32 94.9 -0.22 1.55 ST22 82.6 0.85 1.55 ST02 49.1 -0.07 0.37 ST33 95.9 1.16 0.37 ST09 63.1 -0.07 -1.21 ST20 79.7 1.32 0.37 ST21 81.8 -0.07 -0.42 ST25 84.8 1.78 1.16 ST23 84.6 0.08 0.37 ST31 91.4 1.93 1.55 ST11 67.1 0.24 -0.02
The scatter plot of students’ z-score in CK and PK presents a strong correlation between PK and CK (see Figure 5). According to Pearson test results, there was a big positive correlations between conceptual knowledge (CK) score and procedural knowledge (PK) score, r = 0.66 (p < .01). This shows that 43 % of variance in CK score was related to the variance in the PK score.
Figure 5. Z-scores scatter plots of procedural knowledge (PK) and conceptual knowledge (CK)
Furthermore, Figure 5 describes the information about distribution of students’ performance in CPKT. The Figure 5 was analyzed into four quadrants; Quadrant 1, Quadrant 2, Quadrant 3 and Quadrant 4 (see Table 6). Without the students ST11 and ST17 which are on the border, the distribution of students’ scores according to quadrants is summarized in Table 6. The distribution reveals that the majority of the students were in Quadrant 1 and Quadrant 3 which was the expected result of the Pearson test. That is, if a student was higher in one type of knowledge, she or he also tended to be higher in the other knowledge or vice versa.
Table 6
Four quadrants of the student distribution with regards to CK and PK
Quadrant Student performance Number of students
Quadrant 1 Having higher scores in both CK and PK 12
Quadrant 2 Having lower score in CK and higher score in PK 4
Quadrant 3 Having lower scores in both CK and PK 11
Quadrant 4 Having higher score in CK and lower score in PK 4 ST01 ST04 ST06 ST03 ST07 ST12 ST14 ST05 ST10 ST08 ST26 ST32 ST02 ST09 ST21 ST23 ST11 ST17 ST18 ST28 ST19 ST27 ST29 ST13 ST15 ST16 ST24 ST30 ST22 ST33 ST20 ST25 ST31 y = 0,6555x - 5E-07 R² = 0,4297 -3,00 -2,00 -1,00 0,00 1,00 2,00 3,00 -3,00 -2,00 -1,00 0,00 1,00 2,00 3,00 PK (y) over CK (x) Quadrant 1 Quadrant 2 Quadrant 3 Quadrant 4
What to note about the quadrants and students’ GPA in mathematics is that 11 of 12 students in Quadrant 1 had higher mathematics GPA scores and 9 of 11 students in Quadrant 3 had lower mathematics GPA scores. This distribution indicates that students’ general achievement in mathematics was also related to students’
competency in their conceptual knowledge and procedural knowledge. Furthermore, the Pearson correlation test also revealed that there was a big positive correlation between the GPA of mathematics and the CK score, r = 0.73 (p < .01). This
correlation revealed that 53 % of the variance in GPA was related to the variance in the CK score. Similarly, there was a big positive correlation between the GPA of mathematics and the PK score, r =0 .832 (p < .01). It shows that 69% of variance in the GPA was related to the variance in the PK score.
Findings from follow-up interviews with target students
The successful students ST33 and ST24 were chosen from Q1 where the students were higher in both the conceptual knowledge and procedural knowledge parts of the test. The less successful students ST03 and ST01 were chosen from Q3 where
students had lower in both parts of the test. Meanwhile, the successful students had higher GPA scores and less successful students had lower GPA scores in
mathematics.
Students’ profiles of conceptual knowledge and procedural knowledge regarding the content knowledge
Students’ answers to interview questions were coded according to knowledge types, for conceptual knowledge (CK), procedural knowledge (PK) and coupled conceptual and procedural knowledge (C-P) and misconceptions (MC). Table 7 describes the
Table 7
Student knowledge profiles regarding the content knowledge Student Know-ledge type Contents in fraction Meaning of fractions Compariso n of fraction Reference whole Addition & subtrac-tion Multipli cation & division Representa tion Rules of operation Total ST33 CK X X X X X 5 PK X X X 3 C-P X X 2 MC X 1 ST24 CK X X X X 4 PK X X X 3 C-P X X 2 MC X X 2 ST03 CK X 1 PK X X X X X 5 C-P X 1 MC X X X 3 ST01 CK 0 PK X X X X 4 C-P 0 MC X X 2
Note: X indicates existence of the knowledge.
Conceptual knowledge (CK). Understanding meanings of fractions represented in different contexts and expressing proportional reasoning (e.g. giving clear
explanation to comparison fraction) are indicators of student’s level of CK. For example, both successful students knew the part-whole meaning and its related features. They were aware of the fact that the fundamental feature of part-whole meaning was partitioning into equal parts. The following explanation of ST24 represents her correct CK about the part-whole meaning of fractions:
ST24: I thought that pieces would be simplified or expanded for the questions like second one but I realized that it is really given in one question, in other one it is given as . In addition, in other figures, the pieces were not equal. Since they are not equally shared, I understood that they are not . In order to represent a fraction, a whole should be divided into equal parts (Appendix F, ST24-2).
In addition, ST33 and ST03 had the conceptual knowledge that fractions become smaller while their denominators increase and so they compared the fractions with the same numerator using this knowledge. They associated the increase in
denominator with the decrease in the size of parts. ST03 explained that “ was bigger
than . When it is divided by 6, the share is bigger.” (Appendix F, ST03-18)
Procedural Knowledge (PK).Knowing rules and algorithms about fractions, knowing order of operations and solving problem based correct calculations demonstrates that a student has PK. For example, all students know the order of operations as a rule. ST24 explains the order of operation well by the following sentence:
ST24: Firstly it is started to solve from the operation in the parenthesis, then since
there is no multiplication or division in the parenthesis, subtraction is done. (Appendix F, ST24-51)
Although a few questions were asked to find out their CK about the content, some students gave answers depending on the rule without knowing the meaning of this rule. Hence this knowledge was also accepted as PK. When the reason of finding common denominator was asked, the less successful students stated the reason for finding the common denominator that “this is rule” and they needed to find it to add the fraction together. This indicated that the students’ knowledge about addition is PK-based.
Coupled Conceptual and Procedural Knowledge (C-P). Using CK and PK
simultaneously, and modeling an operational question are pointers of coupled CK and PK. When the reason for finding the common denominator in fraction addition
addition problem. She associated her operation knowledge with models and shapes. This indicated that she had a CK of fraction addition and regarding her modeling example her CK is not separated from PK. Hence, ST33 had C-P about addition. The conversation between the researcher and ST33 is about the student’ C-P:
ST33: Yes I see. If I model for addition + , there are 3 parts and 1 part is taken, also in here there are 2 parts and 1 part is taken. I could not add them like this. Hence I should make parts equal.
Researcher: What do you mean?
ST33: We don’t know how big this part is in that whole so we need to find common
denominator and make parts equal.
Researcher: Do you mean that we try to find equal size parts? ST33: Yes. (Appendix F, ST33-23:ST33-27)
Misconceptions (MC). During the interviews, it was observed that students developed several misconceptions about fraction contents such as the meaning of fraction, reference whole, and the representation of fractions. ST24’s answer for the question of comparison fractions is an example of MC related to fractions. When the researcher asked students to compare fractions without calculations, it was seen that while comparing and , ST24 just focused on denominators and ignored the numerator-denominator relation and compared the fractions incorrectly.
ST24: is bigger one because dividing one pizza into 5 parts and taking 4 parts give bigger parts taking 7 parts from the pizza divided into 8 parts. (Appendix F, ST24-24)
Comparison between successful and less successful students’ conceptual and procedural understanding of fractions
It is difficult to determine any straight forward differences and similarities between the successful and less successful students with respect their CK and PK
procedural knowledge, the amount of C-P that are the components of students’ PK and CK added to PK and CK. Therefore, the frequency of student PK and CK was presented in Figure 6.
Figure 6. Similar procedural levels ( (3) = 0.4, p > .05) and different conceptual levels ( (3)= 8.73, p < .05).
As it is seen from Figure 6, both successful and less successful students had the similar level of procedural knowledge (PK). According to Chi-square test result, there was not a statistically significant difference between the students’ PK ( (3) = 0.4, p > 0.05). On the other hand, the difference between the students’ CK was statically significant ( (3) = 8.73, p < 0.05). It is clearly measured that the successful students had more conceptual knowledge of fractions than the less successful students did.
In addition, the successful students had combined conceptual and procedural knowledge, since the number of their CK and PK were close to each other. The
0 1 2 3 4 5 6 7 8 ST33 ST24 ST03 ST01 Th e f re q u e n cy of th e s tu d e n ts ' kn ow le d ge
CK+CP
PK+CP
combined knowledge could have originated from the fact that the successful students answered the interview questions by combining procedural knowledge with
conceptual knowledge, whereas the less successful students answered the same questions by merely recalling rules of fractions. For instance, when it was asked why a common denominator should be found in the addition and subtraction problems of fractions, the successful students said that it is used to equalize parts in quantity to be able to add. This shows that the successful students are able to link their procedural knowledge of fraction addition with conceptual knowledge (Appendix F, ST24-34:ST24-39; ST33-23:ST33-27)
On the other hand, the less successful students had orphaned procedural knowledge failing to combine PK with CK. They were measured to have lower levels of CK although they had the same level of PK as their counterparts did. In other words, the less successful students memorized the rules and algorithms about faction concepts and tried to use these rules without understanding the meanings of each concept. For example, in interview the less successful students stated the reason of finding
common denominator was “this is the rule.” (Appendix F, ST01-50, ST03-36). This example shows that the less successful students had predominantly procedural knowledge.
Difficulties and misconceptions about fractions among the less successful students
The less successful students had difficulties and misconceptions about fractions. Table 7 indicates that the less successful students had larger gaps in CK, compared with the successful students. With excerpts from the interviews, this section
highlights the differences between the less successful and the successful students’ understanding of fractions and in terms of their misconceptions.
First, although part-whole meaning and region representation were taught in primary school years, the less successful students still had difficulties in determining fractions related to part-whole meaning and region representations. They tried to find fractions by counting parts and ignored whether the parts were equal in size or not. The
following excerpt between the less successful student (ST03) and the researcher shows that the student had little knowledge about the equal partitioning and had developed a misconception related to the meaning of part-whole:
RESEARCHER: Hi. In the first question, I asked you to determine whether the
shaded area shows of whole or not. How do you decide this? Can you explain again?
ST03: The first one was divided into 4 parts and 1 part was taken. So it is .
RESEARCHER: Humm Humm. For second one?
ST03: It was divided 5 parts and it shows . So the answer is no. For this one ( 3rd
question, 1c) it is divided into 4 parts, so it also indicates .
RESEARCHER: However this shape was not divided into equal parts. Does it still
indicate a fraction? Is just dividing 4 parts enough to representing a fraction?
ST03: I am not sure.
RESEARCHER: Ok. Continue.
ST03: This is true. It is also divided into 4 parts. (Shape is divided unequal parts!)
The others are true because of the same reason.
RESEARCHER: Again these are not divided into equal parts (1e). Is it enough to
divide just four parts? It is not important to be equal parts, is not it?
ST03: I do not know.
Second, comparing fractions is a problematic concept for less successful students. They had difficulty in comparing fractions without calculations. They preferred to find common denominator and then compare the fractions (Appendix G, ST01-29:ST01-33; ST03-22:ST03-24).
Third, they developed misconception about comparison fraction by ignoring reference wholes. Referring to the pizza questions in CPKT (Appendix B, C6), students’ answers for the questions on the test were discussed again and it was observed that less successful students compared fractions independently from their reference whole and accepted fractions as just numbers. They said it was impossible since “ is bigger than ” (Appendix F, ST01-35; ST03-26). Moreover the less successful students could not deduce that a fraction represents the same quantities in different wholes and the wholes should be equal. The reason for this might have been originated from the difficulty to correlate fractions with quantity for more than one different shape.
Another difficulty among the less successful students was determining fractions represented by area representations. While the explanation of the answer of
conceptual question C11, ST03 said “In that case we can’t say anything since it is not equal.” (Appendix F, ST03-50). He meant that the shape was not divided into equal parts and so nothing can be said for parts. This misconception could have originated from his confusion of area representation with region representation. This could be a reason why students have difficulties determining fractions represented from area representation.
Finally, the less successful students had computational difficulties while solving procedural knowledge based problem. They made computational mistakes, especially while finding common denominators and enlarging fractions. In addition, ignoring sign rule led students to solve the problem incorrectly.
CHAPTER 5: DISCUSSION
Introduction
Conceptual (CK) and procedural knowledge (PK) are the knowledge types needed in order to have a well-developed knowledge base in mathematics. The present study investigated the differences and similarities between successful and less successful students’ conceptual and procedural understanding of the topic of fractions in mathematics.
Discussions of the findings
Strong positive correlation between CK and PK
In the present study, it was found that there was a large positive correlation between students’ CK and PK of fractions, r = 0.66 (p < 0.01). That is, having a higher level in one type of knowledge was associated with having a higher level in the other type of knowledge or having a low level in one type of knowledge was related to having a low level in the other. This finding was consistent with the finding of previous researches which pointed that CK and PK are interrelated knowledge (Baki & Kartal, 2004; Hiebert & Lefevre, 1986). However, there are still discussions about how knowledge develop and which knowledge leads the increase in the other knowledge (Hallett et al., 2010; Rittle-Johnson & Siegler, 1998; Schneider & Stern, 2005). Rittle-Johnson and Sigler (1998) mentioned in their research the concept-first and procedure-first views that claim one type of knowledge is acquired first and it leads to the development of the other type of knowledge. On the other hand,