226 IEEE JOURNAL ON SELECTED AREAS IN COMMUNICATIONS, VOL 14, NO. 1, JANUARY 1996
li
erver Synchronization and Bufferin
r
iable Rate
ltimedia Retrievals
Joseph Y.
Hui,
Senior Member, IEEE, Ezhan Karasan, Student Member, IEEE, Jun Li, Student Member, IEEE,and
Junbiao ZhangAbstruct- We consider the use of large buffers and feedback as a mechanism to maintain loosely coupled synchronization
between a multimedia server and a client. The multimedia stream
is modeled as a fluid flow through rate controlled valves and
buffers with multiple thresholds. These thresholds are used to
control the rates upstream. The quality of service for the multi-
media connection is characterized in terms of the jitter in the received media stream due to buffer underflow and overflaw. This quality of service is used to exercise rate and admission control in the presence of congestion. The feedback mechanism is, implemented in GRAMS, an adaptive multimedia client-server system. Experimental statistics are gathered for the purpose of traffic engineering. We employ a fluid flow and first passage time analysis to understand the traffic process through the pipehes
and the buffers and to estimate the amount of signaling required
by the feedback mechanism.
I. INTRODUCTION
ISSUES OF SYNCHRONIZATION AND BUFFERING FOR MULTIMEDIA
ULTIMEDIA communications, as the name implies, involve media of different types such as video, audio, image, text, and data. These communication sessions could be further classified according to their requirements for syn- chronization and delay. First, real time communications, such as teleconferencing, require the strictest synchronization and the least time differences among the time instants of signal capturing, signal coding, signal buffering, signal transmission, signal reception, and signal display. The end-to-end delay should typically be less than tens of milliseconds. Second, retrieval of multimedia information requires only the display of the audio-video at the same rate as its capturing. The delay between signal retrieval and signal display could be as large as several seconds. However, larger delay may result in unsatisfactory response time for the client. Also, a large delay may require the use of a large buffer somewhere between the server and the client display. Third, image transport imposes almost no synchronization requirement among the components
of the signal, since the image typically is displayed upon
Manuscript received August 8, 1994; revised March 30, 1995. This work was supported by the National Science Foundation under contract NSF NCR 90-58079-02 and with matching funds from Bellcore and NEC.
J. Y. Hui, E. Karasan, and J. Li are with the Department of Electrical and
Computer Engineering, Rutgers University, Piscataway, NJ 08855 USA. J. Zhang is with the Department of Computer Science, Rutgers University, Piscataway, NJ 08855 USA.
Publisher Item Identifier S 0733-8716(96)00243-0.
Late
Underflow
.._...
Overfirm p t t e r rate =
a
Underfirm jetter ?ate =
Fig. 1. Jitter rate related to underflow and overflow.
the completion of the entire image transmission. The delay of concern here is the delay between the initiation of an image request, until the complete image is received. This delay should ideally be less than a second, but delay less than 10 ms may be of no subjective advantage to the client.
We believe that delay is a significant measure of the quality of service (QoS) for multimedia. Here, we distinguish between two kinds of delay, latency versus jitter. Latency, defined for video, audio, and image transport, is the delay between signal generation (or retrieval) and signal display. Jitter, defined for continuous media streams such as audio and video, results from the disruption of the media as a consequence of underflow or overflow conditions (Fig. 1). The underflow jitter rate is defined as the fraction of time the received stream is paused due to underflowing. The overflow jitter rate is defined as the fraction of time the Teceived stream is lost due to overflowing. The sum of these two rates is termed as the jitter rate, which measures how much jitter there is in the media stream. Jitter is due largely to the failure to synchronize the server and the client in order to maintain continuous flow. Such synchronization is achieved, in this paper, through buffer occupancy feedback.
As the current network technology supports the means to
handle multimedia traffic and the user demand for multi- media services increases, protocols are required to provide satisfactory quality of service for multimedia communications. Synchronization, rate control, and buffer management between the source and the destination are three closely related prob- lems to be solved in order to provide satisfactory quality of service for multimedia communication [ 11-[ 1 I]. Different approaches have been proposed to address the problem of synchronization: models based on Petri nets [2], [4],
[XI,
HUI et al.: CLIEN’I-SERVER SYNCHRONIZATION AND BUFFl!RING FOR VARIABLE RATE MULTIMEDIA RETRIEVALS 221 feedback techniques for synchronizing distributed media [6],
and schemes providing synchronization at the buffer level [ 1 11. In this paper, we shall devise feedback mechanisms for the flow control and synchronization problems, analyze the stochastic behavior of the resulting problem of media data flow with feedback, and give empirical traffic data from the resulting implementation.
In particular, we use large buffers with three threshold levels to maintain loosely coupled synchronization between a multimedia server and a client. These thresholds are used to produce feedback information to exhibit rate control for preventing buffer underflow and overflow. The quality of service for the multimedia connection is expressed in terms of the jitter in the received media stream due to underflow and overflow, given in Fig. 1. This synchronization protocol is implemented in gopher-style real time ATIIvI multimedia system (GRAMS) [12], a client-server system for multimedia communication. We characterize the resulting traffic process by using a first passage time analysis, which is used to predict the frequency of signaling required to implement the feedback mechanism.
In the multimedia server GRAMS [l], we implemented a client interface that provides client-based synchronization and
QoS control via feedback. GRAMS is a distributed multimedia system that can be deployed on an ATM ILAN, a wide area ATM network, or the Internet environment. The most noticeable features of this system are:
GRAMS is fully compatible with several popular Internet document retrieval protocols including Gopher and http [17]. The client interface of GRAMS employs the popular media viewer Mosaic [lS], which provides integrated multimedia display as well as the World-Wide Web (WWW) navigation help [171.
The GRAMS server can provide heterogeneous media services such as video, audio, image, and text with QoS control.
Several video formats (including MPEG, motion JPEG [ 131 and CELLB [ 191) are supported in addition to image formats such as JPEG and GIF.
GRAMS supports multiple transport protocols including TCP, UDP and ATM with AAL4 [20].
The implementation of the multimedia server in GRAMS is explained in Appendix A. Interested readers may refer to [12] for further details.
The rest of the paper is organized as follows. In Section 11, we explain the feedback flow control and synchronization paradigm. The details of the flow control scheme based on three buffer thresholds are presented. In Seclion 111, media scaling and synchronization in GRAMS are described. In Section IV, experimental results are given for the buffer occupancy and signaling frequency, obtained b y using a video sequence encoded by CELLB [19]. In Section V, we analyze the traffic rate process resulting from the feedback rate control scheme. In particular, we obtain the mean time spent using a particular rate until rate changes due to feedback from the receiver end. We calculate the proportion of time each rate is used, that is used to obtain the frequency of signaling
d c h e rate xmit rate rcv rate decode rate
I; 1 : ;
I ’ I I !...._~
Disk j Cache ; N4work Client Display
___..______...__...__
I. -. - $ .
Fig. 2. Client-based rate and QoS control.
information from the client to the server. Section VI concludes the paper.
11. FEEDBACK FLOW CONTROL
AND SYNCHRONIZATION PARADIGM
In the GRAMS implementation, the media stream from the server to the client may be modeled as fluid flow through a number of valves and buffers as shown in Fig. 2. There are essentially four buffers where the media stream may reside temporarily. First, the media stream may be stored in a hard disk. For teleconferencing, the media stream may be generated by the capture board, and subsequently compressed by media coding algorithms. Second, these streams are then cached at the transmit buffer. Third, the network, due to its transit latency and buffers within the network, may be viewed as another buffer. Fourth, the receive end may buffer a sufficient amount of the media stream for the purposes of maintaining a continuous stream for display and suitable synchronization with the transmit end.
Connecting these buffers are variable rate valves, some of which could be controlled using the state information of one or more of the previously described buffers. For stored video retrieval, the transfer rate from the hard disk to the system cache is dictated by the constant retrieval speed of the bus of the hard drive, even though the media stream may be of variable rate. For teleconferencing, the transfer rate could be highly variable as a function of the type of video frame (I, P and B frames for MPEG [13]) as well as the amount of motion and the granularity of the video. Some rate smoothing is necessary via the use of the transmit buffer. The transmit valve is probably the most critical control in the pipeline, performing the vital traffic shaping function. The receive valve on the client end ideally should receive information at the same rate as the transmit valve. A small transit latency may be experienced. The receive rate may match the transmit rate closely by adequate allocation of buffer and bandwidth resources [ 141 within the network. The video display valve empties data from the client buffer at a rate that maintains a smooth playback.
Transmitter-receiver synchronization is achieved through flow rate modulation. The control of rates as a function of buffer occupancy can be of two kinds. The first kind, that receives more attention in the literature 1151, [16], consists of feedforward control, namely that the upstream buffer oc-
228 IEEE JOURNAL ON SELECTED AREAS IN COMMUNICATIONS, VOL. 14, NO. 1, JANUARY 1996 cupancy determines the rates of the valves downstream. For
example, a high occupancy of the transmit buffer may result in a feedforward increase in the transmit rate and the display rate. A high transmit buffer occupancy could result from a surge in the media coding rate, such as, that resulting from motion in the video.
Feedforward control is often used for teleconferencing for which delay should be less than tens of milliseconds. Subse- quently, the buffers in the end-to-end connection should be small. As a result, control actions may be frequent. Such frequent adjustments within the network could be difficult to achieve and often bandwidth overengineering is used to
minimize the effect of rate surges. Such engineering requires certain knowledge of traffic statistics.
The focus of this paper is on the second kind of control, that consists of feedback control [ 5 ] , namely the downstream buffer occupancy d e t e d n e s the rates of the valves. For example, a high occupancy of the receive buffer indicates that the transmit rate is too high compared to the video display bit rate. This low display rate could result from an inherently low video coding rate or the failure of the client to decode at the regular frame rate. The client then sends a feedback request to the server for a reduction in the transmit rate. Similarly, a low occupancy of the receive buffer may result in a feedback request from the client to the server for an increase in the transmit rate. A low occupancy of the receive buffer, however, can also result from a congested network, with data accumulating in the network buffer. In this circumstance, increasing the transmit rate would be detrimental. This condition should be detected by a mismatch between the requested transmit rate and the receive rate. Congestion is then alleviated by measures such as lowering the frame rate for the video and subsequently, the transmit rate.
The advantages of feedback control are many. First, this
protocol emphasizes client QoS control, taking into account that the receiver has better and immediate knowledge of the condition of the end-to-end connection, including the network condition which may not be readily accessible to the trans- mitter. In certain sense, the effect of all upstream congestion due to the server or the network is detected, differentiated, and alleviated by the action of the client. Second, the transmitter need not examine the timing relationship and data format of the media, thus reducing the computational load of the server that often serves tens and possibly hundreds of connections at the same time. Third, the feedback automatically takes care of client-server synchronization. Fourth, this feedback
mechanism does not require a detailed description of the video coding rate process other than the mean rate and hence it is robust to errors in traffic models.
If a large buffer is used, the frequency of feedback actions is low, albeit at the expense of a large delay. This infrequent change of a constant requested rate allows careful and infre- quent bandwidth reservation [ 141. Substantial traffic averaging is achieved as a result. Hence feedback control is more suitable for retrieval of stored media, for which a larger delay between the transmitter and the receiver is allowed.
We describe our feedback flow control and synchronization paradigm for the GRAMS system as follows. Thresholds are
set for the server cache, the network buffer, and the client buffer. For the server cache, a cache request to the hard disk is generated when half of the information in the cache has been transmitted. The cache manager then schedules a disk read to
fill up the emptied half of the cache. To detect the occupancy level of the network buffer, the client keeps track of the receiver deficit as an accumulation of the difference between the requested transmit rate and the received rate. If this deficit exceeds a certain threshold, we declare the network throughput
a bottleneck and actions will be taken to reduce the frame rate
for the session. Thus the client interface adjusts the media quality adaptively with respect to the transport capability of the underlying network.
The receive buffer occupancy is used as control information for maintaining client-server synchronization. There are three buffer thresholds Th, T,, 'Tl, namely, the high, medium, and
low thresholds. When the buffer occupancy crosses any one of these thresholds, a new transmit rate A h , ,A, A1 is requested
if that rate is not the current transmission rate. The medium rate A, is equal to the average rate of the media, which is easily found by dividing the size of the media file by the duration of the media display. The high rate should normally be higher than the peak rate, and the low rate should normally
be lower than the lowest rate. These extrema1 rates are more difficult to obtain than the average rate, and very often they are assigned to be a certain factor of the average rate. To safeguard against errors in estimating the peak and lowest rate, overfiow or underflow conditions may be used to adjust these rates. For example, an overflow may temporarily result in a requested reduction of transmit rate to zero. Repeated overflow may necessitate a decrease of A l . Repeated underflow may necessitate an increase of Ah.
In the following sections, experimental and theoretical sta- tistics are obtained for the resulting traffic processes and buffer occupancy.
III. hlEDIA SCALING AND SYNCHRONIZATION IN GRAMS
As discussed earlier, consistent underflow of the client buffer could indicate a network bottleneck or temporary con- gestion. In such a situation, the client requests a scale down of the media, thus reducing the bit rate requirement. In this section, we focus on media scaling and inter-media synchronization in GRAMS.
In GRAMS, a typical application is transmission of stored lectures often involving the synchronization of the video ( e . g . , the lecture scene), audio (e.g., the lecturer's speech that often canies most of the cognitive information of the lecture), and image streams (e.g., lecture transparencies). We call this an audio-video-visual session. The audio-video synchronization requirement is very stringent with a discrepancy of less than
100 ms, whereas, the video-image synchronization require- ment could be quite loose with an allowable discrepancy in the order of seconds. Therefore, the media synchronization discussed here will primarily be between the video and audio streams.
There are two components of audio-video synchronization. First, we maintain the natural rate of playback of audio, that
HUI er al.: CLIENT-SERVER SYNCHRONIZATION AND BUFFllRING FOR VARIABLE RATE MULTIMEDIA RETREVALS
~
229
I 1 I I
I I
I
I P P I P P If
videodata audio dataheader information Fig. 3. Structure of the video-audio block.
from a subjective point of view is more important than the natural rate of playback of video [7]. Hence, we shall maintain the continuity of the audio, at the expense of possibly intro- ducing jitter for the video. Second, we need to synchronize the audio stream with the video stream for qualities such as lip synchronization.
Many currently available technologies record and store the audio and video streams separately. This complicates the synchronization of the two media. In the GRAM,S experiments, we group the streams into audio-video groups. Each group consists of six frames of video preceded by the audio data of the group. We assume the natural frame rate of 30 framesh. For our current implementation, we use the following three video formats: motion JPEG that consists of I frames, MPEG that consists of periodic IPP frames, and CELLI3. (The MPEG standard contains B frames besides I and P frames.) The number of frames in a group was chosen sa that we may restart from an I frame, if packet loss or error occur during
transmission of the group, or from an I frame of the next group.
Also, the grouping allows scaling back of the video rate if the network is found to be a bandwidth bottleneck (Fig. 3 ) .
In a separate pointer file, we store headers for each au- dio-video group. The header makes it easy for the server to find the I frames if for some reason it needs to decimate the video stream by dropping frames. The headtx contains the offset of the beginning and the end of the first and third frames, which are I frames for both motion JPEG artd MPEG. The audio part precedes at the location indicated by the offset of the first frame. These offsets are transmitted in the header for the group and are used both by the server and the client during media transmission and playback.
Two features complicate the design of the audio-video syn- chronization scheme: media scalability and transport protocol support. These two features handle problems resulting from network bandwidth bottleneck, packet loss, arid server-client overload.
As discussed earlier, the client detects network congestion
and requests a downward scaling of the media to relieve the bandwidth bottleneck. Our grouping would allow frame rates of 30 frame& 10 framesh (by transmitting the audio plus first and third I frames only), 5 frameds (by transmitting the audio plus the first I frame), 2.5 framesls (by transmitting the audio
for every group and the video for every other group), as well as
lower rates such as 1 frames/s, every two seconds, and every five seconds. The downward adjustment is continued until the requested transmission rate matches the receive rate. Upward frame rate adjustment is initiated by the end-user through a control on the client interface. We also note that caching is performed for the maximum frame rate even though only part
Statistics of CellB Video
I
I
2000 4000 6000 8000 10000 12000
0.4'
0
Time in No. fo Frames
Fig. 4. A CELLB video sequence.
of the cached media may be transmitted. It is not difficult to cache only the transmitted information, but the increased disk seek time and address computations may outweigh the advantages of decreased disk reading time and reduced cache size.
This header structure devised for media scaling and syn- chronization is also used for accomplishing other functions of
a transport protocol. The transmitter may employ a transport protocol such as TCP or UDP. Since image transport typically requires almost no packet loss and one or more seconds of image transport latency can be tolerated, using TCP as a transport mechanism could be appropriate. For audio-video applications, TCP may incur unnecessary re-transmission, de- lay, and processing. One option for audio-video transport is to add minimal transport layer functions within the application for packets piped via ATM and AAL 415 [20].
To handle out-of-order packets and packet loss, additional information is inserted into the packet header. For audio-video applications, packet loss may result in discarded or repeated audio-video segments. Currently, we do not attempt to re- transmit lost packets to avoid re-transmission delay and addi- tional complexity in caching, re-transmission scheduling, and preventing packet duplication.
Iv. EXPERIMENTAL RESULTS CONCERNING BUFFER SIZING AND RATE CONTROL
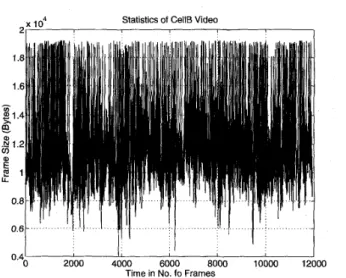
In this section, we present experimental traffic statistics as a result of client feedback based on receive buffer occupancy. The result is based on the video coding method CELLB, the currently available variable rate video encoding algorithm on our computing platform. The experiment is performed on a video stream for which a typical trajectory of the encoded size of frames is shown in Fig. 4. The video stream has the
following statistics:
Number of frames N = 12 000 Frame rate R f = 29.4 frames/s
230 120- -100- M 2 i=
2
80-:
60- % # - 9 m m a c E i i 9 20-IEEE JOURNAC ON SELECTED AREAS I N COMMUNICATIONS, VOL 14, NO 1, JANUARY 1996
In mid-rate-state In low-rate-state In high-rate-state - - - _ ~ _ _ ,
, ' Average Frame Size = 12519(Bytes) Frame Rate = 29 4 frs/sec One Second Buffer = 368075(Bytes)
, / '
_ _ _ _ - _ _ _ - - _ - _ - - - Performance of Feedback Control for CellB Video
1
I
2000 4000 6000 8000 loo00
Time in No. of Frames
Fig. 5 . Buffer occupancy variation for the CELLB video.
Statistics and modeling of variable rate MPEG can be found in [21]. Since we employ multiple audi+video standards as well as multiple sub-sampled frame rates, it seems from these rate trajectories that a proper modeling and adaptation of
the model as a function of control could be quite complex. Our control approach is highly adaptive and does not require traffic statistics to bc known a-priori other than the average
rate (for the full rate and perhaps for the sub-sampled rate). Nevertheless, it is helpful to obtain traffic statistics of the requested rates by the client for the following purposes:
Bandwidth engineering such as the sizing of bandwidth for a virtual path.
* Estimating the amount of signaling required due to these requests.
* Sizing the client buffer in order to maintain good QoS. The choices of buffer size and thresholds affect the feedback frequency that indicates the overhead incurred by signaling and rate changes. Determining a proper combination of buffer size, thresholds and the corresponding transmission rates for a specific stream is very complicated due to many changing factors. In order to avoid overwhelming complexities, we set the three thresholds proportional to the buffer size and the three rates proportional to the average rate of the video stream. Tests are then performed to find out the buffer occupancy changes with respect to different buffer sizes. The actual values of the parameters are as follows
Buffer size = T
*
R b High Threshold Th = 0.9*
S Medium Threshold T, = 0.5*
S Low threshold Tl = 0.1*
S Medium rate A, = Rb High rate Ah = 1.5*
Rb Low rate A1 = 0.5*
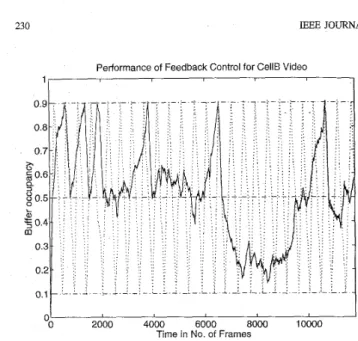
Rb where T ranges from 1 s to 10 s in our tests.Fig. 5 demonstrates a typical buffer occupancy as the client consumes the video stream obtained from the GRAMS server,
Fig. 6. Signahg frequencies relative to buffer size.
Fig. 7. Fmt passage times relative to buffer size.
with T = 5 s. The curve in solid line shows the occupancy variations based on the feedback mechanism described earlier. The curve in dashed line gives the result when the medmm threshold Tm is not used (i.e., the server only transmits at either the high rate X h or the low rate X i in response to client signals). In both cases, no buffer underflow or overflow occurs. We observe that the high threshold and low threshold are reached much less frequently when the medium threshold is set for the buffer. This will lead to a lower probability of
buffer underflowing and overflowing. Rate changes are also reduced in this case.
Fig. 6 shows the change of average time interval between two consecutive feedback signals as the buffer size increases. The buffer size is given in the units of buffer space to store 1 s of video stream, called one second buffer (in this experiment one second buffer is approximately 368 kbytes). Even if we only use a buffer size Corresponding to 1 s video stream, the average interval between rate changes is still larger than 5 s.
Therefore, the overhead of feedback signaling is very small. Fig. 7 shows the first passage times of the three transmit states. We distinguish three states according to the transmission
HUI et al.: CLIENT-SERVER SYNCHRONIZATION AND BUFFERING FOR VARIABLE RATE MULTIMEDIA RETRIEVALS I , I , &j-. . . : . . :. . . . ..: ... .:. . . : . . . . .: . . . - , I _. . I : E [ T ~ ] =iE[72] ( L J M, H 4 M ) . __ ~ 23 1 50 4- 0 1
3
! . ...;
. . . : . . . . . j . . . ..; ... : ... :. ... r . I I, : : E[Ts](4
-+ 6 01 $) i : / . _ - _ 2 4Fig. 8. FSM model for the transmission rate process.
. I : : A I . . : ! ....: ..: g 3 5 ... i.. .... ..:.... ..,..; ... I ... :...I ... ;../ . .: . . . a, ,' / . ' .... v B m
Th
T m
T,
0
a,g30-.
$25-.- -
. . . .: ... : ... ... ... ' I : ... 2 :I ; ; / ' . , . : , ; I . ... . I
..1
. . . j . . ..I
. . . . ...:. ....I..
. r . , ... ..j .:. . . . .Fig. 9. Threshold crossings at the receive buffer.
20 . . . :... . . . : ... .?C. . . . : ... : ... : . . . L I : . . . . . ... . . . . :. . . .,I: / F . . ... . . .
m"
i 5 - . . ;..,.. c . . :. 10.. .: ; ...., I .:.. . , . . :3
. . . . . . : ,' : ., : ... , . , _ - i - : .-rates the server chooses. The first passage time of each state denotes the average duration in which the server uses the corresponding rate. The curves show certain similarities to those in Fig. 10, that are obtained by using the analysis of the two-state Markov model, presented in the next section. However, the first passage time of medium rate state exhibits more linearity than exponentiality. Therefore, the ratio of the server using medium rate to low-high rate is almost unchanged with respect to the buffer size. The time the server spends in the medium rate state is about 4 times longer than the time spent in the low-high rate states.
These test results show the adaptiveness of the feedback
mechanism in accommodating the fluctuations. The intuitive choices for the values of the thresholds and the rates are justi- fied by the relatively smooth changes of the buffer occupancy and the transmit rates.
v.
ANALYSIS OF THE RATE CON'IROL PROCESSIn this section, we analyze the performance of the large receive buffer. In particular, we derive the imean duration between threshold crossings by using a first passage time analysis. The frequency of the rate change requests by the client to the server determines the amount of siginaling required by the rate control protocol. The fraction of time the server is transmitting at each rate is also computed. Finally, a numerical example is presented for a two-state Markov chain model of the client decoding algorithm for VBR video service.
Mean first oassage times versus the buffer Size
Buffer size in Mb
Fig. 10. Mean first passage times as a function of buffer size.
The choice of the three buffer thresholds as well as the transmission rates determine the frequency of rate change re- quests to maintain satisfactory performance for the multimedia service. For a fixed buffer size, if the thresholds are chosen at large distances from each other, the amount of signaling will be low at the expense of high overflow and underflow probability. The statistics of the rates used by the client decoding algorithm is another factor in selecting the thresholds. For example, for a VBR video application containing long periods of high and/or slow motion, the thresholds should be closer to prevent frequent buffer overflow and/or underflow. On the other hand, for a video sequence having bursts of high motion, closer thresholds will cause unnecessary signaling due to frequent threshold crossings.
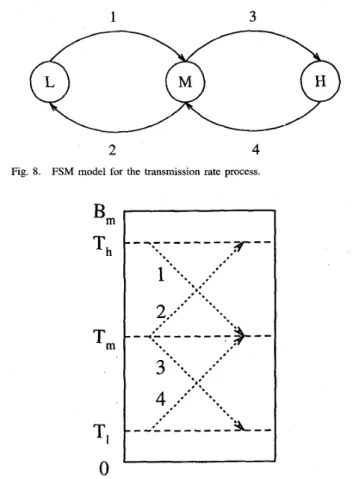
In the following analysis, the multimedia arrival process is modeled as a fluid flow generated by a finite-state ma- chine (FSM) having three states: Low(L), Medium(M) and High(H). When the FSM is in state L, M , or H , the arriving bit stream is a constant rate fluid flow with rate Al, A,, or Ah, respectively, with A1
<
,A<
Ah. The state transition diagram of the FSM is given in Fig. 8 with each state transition labeled from one to four.The client buffer has size Bi\.r and three thresholds: Tl, T,,
and Th with Tl
<
T,<
Th. These thresholds are used by the client to produce feedback information to the server asking to change the rate of the multimedia flow to prevent buffer overflow and underflow. All possible threshold crossings are given in Fig. 9 with each transition labeled from one to four. Each threshold crossing in Fig. 9 has the same label with the corresponding state transition of the server transmission process given in Fig. 8.The rate at which a user removes bits from the buffer is modeled by a fluid flow process modulated by a continuous time Markov chain with state transition rate matrix Q. The Markov modulated fluid flow model has been widely used to model the cell arrival process in ATM networks since its introduction in [22]. When the chain is in state s, information is removed at a rate R, (in bitds) from the buffer. The Markov
232 IEEE JOURNAL ON SELECTED AREAS n\r COMMUNICATIONS, VOL. 14, NO. 1, JANUARY 1996 chain model captures the time correlation of rate processes
generated by many multimedia sources such as VBR video encoders like MPEG. The Markov chain model of a rate process can be obtained by using the statistics of the process both in time and frequency domains. By looking the histogram of the rate process showing the frequency of each rate, one can identify clusters and assign a state to each cluster with the rate of the state equal to average rate of the cluster. The relative frequency of each cluster gives the steady state probability of the corresponding state. The time behavior of the rate process is used to obtain which transitions between clusters are possible. The average time rate stays within a cluster gives the sum of the transition rates out of the corresponding state. In multimedia applications, a user may remove data from the buffer in batches at discrete times. As an example, an MPEG video decoder extracts each frame individually. If the thresh- olds are well separated, however, the time between threshold crossings will be much larger than the time between frame removals. For the computation of mean threshold crossing times, it is unnecessary to concentrate on the detailed behavior of frames. In the larger time scale, the bits are removed almost continuously. Thus, fluid flow model applies for the analysis of the events occurring in this time scale.
The following analysis can be incorporated into the client rate control protocol that adaptively changes the system pa- rameters to achieve the desired performance during the course of a service. The client uses a Markov chain model to characterize the rate process. The parameters of the model are updated by monitoring the rate process through a time window. The buffer thresholds and transmission rates to attain a satisfactory performance are obtained by using the analysis. The transmission rates are periodically updated by sending the new values to the server.
E[.%
I
s ] , i = 1, 2, 3 can be computed from E[.I
s , x ] asfollows:
* E [ q
I
s] = E [ rI
s,Th] withB1
= T,,Bz
= 00 and E[72I
s] = E[.I
s,x] with B1= -00, B2 = T, and E[QI
s] = E[.I
s,T,] withB1
=3,
B2
= Th and E[.1
s , x ] = 0 for II: >_B2
and x5
B1. ForBl
<
x< B2
and starting at a state s with X
>
R,, the queue length will hit the upper thresholdB2
if the Markov chain stays at s for longer than (B2-
.)/(A - R,). If the state changes earlier, E[.I
S , I I : ] can be written recursivelyx
= A l .= Ah.
x
= A.,where qssl is the transition rate from s to s' and qs =
C,,+,
qssl is the rate of the exponential distribution governing the time spent at s.When the chain starts at a state s with X
<
R,, the buffer length wiLl hit the lower thresholdB1
if no transition occurs from s for a duration of at least (x-
B1)/(Rs - X)and E[.I
s,x] can be written recursively as+ I I : - B ~ R, - X E[.
I
s , x ] =e- E,-.
[t+
E[.I
S I , II:+
(A - R s ) t ] ] dt. ( 2 ) A. First Passage Time AnalysisWe analyze the expected time between threshold crossings. We assume that the feedback information is immediately available at the server. For local area networks, propagation delay is small compared to the mean period between rate changes and thus can be neglected.
We define the following three different first passage times:
we define the Lap1ace transform Fs Of E [ T
I
s , x1 withto the buffer length as
~ ~ ( 0 ) =
im
E[.I
s , x ~ e - ' ~dx
(3) and define the N-dimensional vector* 7 1 is the first passage time from Th to T, (corresponding to state transition L -+
Ad).
0 7-2 is the first passage time from Tl to T, (corresponding
to state transition H -+ M ) .
-
r3 is the first passage time from T, to either T h or Tl (corresponding to state transitions M -+ L or M -+ H , respectively).In order to find the mean values of 7-1, 7 2 , and 7 3 , we define the following first passage time:
7 =min{t : x ( t ) = B1 or x ( t ) = B2 with x ( 0 ) = 2 , S ( t ) = s , arrival rate A,&
<
B2) where z ( t ) and S ( t ) denote respectively the length of the buffer and the state of the Markov chain at time t. We defineE['
I
s , x] as the expected value of 7 starting at state ( s , x).(4) where N is the number of states in the Markov chain. We prove in Appendix €3 that
F(B)
can be written asF ( Q )
=( Q
+
OD)-'b(O) ( 5 )where D = diag{X - R,} is the drift matrix and
b(B)
as defined in Appendix B is an N-dimensional vector. With the rate control process, the probability of buffer overflow and underflow will be very small and hence the boundary conditions at zero and BM are neglected in the analysis.The inverse Laplace transform can be performed by using partial fraction expansion. As shown in Appendix B, we can write
HUI et al.: CLIENTSERVER SYNCHRONIZATION AND BUFFIXING FOR VARIABLE RATE MULTIMEDIA RETRIEVALS 233
where
bl
andb2
are obtained by applying boundary conditions atBl
and B2. Let{&}:='=,
be the roots of the equation(6)
det(Q
+
OD)
= 0.Since all row sums of Q are zero, 0 = 0 is a root of (6), say ON = 0. We observe that both
bl
andb2
contain the factor l/0. If all the roots of (6) are distinct, we writeN - l
k = l
On the other hand
We obtain fz, f h , and f, by solving (9)-(12).
The analysis technique developed in this section is applica- ble to any Markov chain model. In the following subsection, as an example, we derive the solutions for the mean first passage times in detail for a two-state Markov chain.
where
and
{ B , } ~ ~
are similarly defined withbl
replaced byb,.
Ifthere are repeated roots of (6), the partial fraction expansion
can be obtained accordingly.
Since we are interested in the inverse Laplace transform within the region B1
5
II:5
B2, we perform the operation for only the first term in (7). The application of the boundary conditions in obtainingbl
andb2
nullifies the solution outsideB1
5
x5
B2. LetH ( z )
= [E[TI
1 , 2 ] , .. .
,
E['I
N ,%]IT
be the inverse Laplace transform ofE(@).
We have for B15
x
L
B2k = l
+ A N + &
-
Bl). (8) The complexity of the main computations in obtainingH(z)
is in the order of N3 by the standard Gaussian t:limination for the solutions ofb,
andb,.
After calculating the mean threshold cross mg times, the relative frequency of each rate can also be obtained. Let f i , f h ,
and f, be the proportion of time each rate is used. Obviously
(9)
fZ
+
f h+
f m = 1. Furthermore, the average rate, R , is given byRav = flAZ
+
f h A h+
f m A r n . (10)Consider a long period t. Let n h and nz respectively be the number of times Tl and Th are crossed during t. Since each low or high rate period is followed by a period with medium
rate n t ( E [ q ]
+
E [ Q ] ) 4- nh(E[72]+
E [ 7 3 ] ) = t. The average rate over period t is Rav, i.e., nl(E[71]A~ -1 E[T~]A,)+
nh(E[T2])\h+
E[T~]A,) = Ravt. Combining the last two equations we have(11) n~ - E[72](Xh
-
Rav)+
E[T3](Am - &v)-
nh - E [ ~ l ] ( R a v -h)
+
E[~3](Rav -kn)
.
B. Two-State Markov Chain Model
We model the process describing the rate at which the bits are removed from the receive buffer with a two-state Markov chain. For video encoding schemes that use only interframe technique without motion estimation, a two-state model can be applicable. A video sequence containing periods of high and low motion can be modeled by two states, one state with low bitrate (corresponding to low motion) and the other state with high bitrate (corresponding to high motion). Let
be the state transition rate matrix of the Markov chain. The
parameters l / a and
1/p
are matched to average durations of high and low motion periods. Without loss of generalityassume that R1
<
Rz. The roots 01,2 of (6) are given byThe high rate A h is chosen to be larger than both R1 and R2 in order to have a drift toward T, after hitting Tl, whereas
the low rate A1 is similarly selected smaller than both R1 and R2. The medium rate A, is chosen as the average rate, A
, = (RIP
+
R2a)/(a+
p).
Hence, we haveWe find the mean values of 7 1 , 7 2 , and 73 separately. 1) E [ q ] (meanJirstpassage time from L to M ) : Since R1
<
,A<
R z , the chain is in state 1 when Th is hit, i.e.,E[q] = E [ q
1
11. By doing the partial fraction expansion in (7) and taking the inverse Laplace transform with respect to8, with Re(0)
>
0, we obtainThe first term in (13) corresponds to the steady-state behavior
of the Markov chain, whereas the second term reflects the effect of the initial state.
234 IEEE JOURNAL ON SELECTED AREAS IN COMMUNICATIONS, VOL. 14, NO. 1, JANUARY 1996 2 ) E[r2] (mean first passage time from H to M ) : Since
R1
<
A,<
R2, the chain is in state 2 whenTZ
is hit, i.e.,E [ T ~ ] = E[r2
I
21. By doing the partial fraction expansion in(7) and taking the inverse Laplace transform with respect to
8, with Re(0)
<
0, we obtain3) E[r3] (mean first passage time from M to either L or
H ) : The state of the chain at the beginning can be either one or two. Since
RI
<
A,<
R2, we need to evaluate theboundary conditions. Solving the linear system of equations we obtain the two unknown constants
Performing the partial fraction expansion and taking the in-
verse Laplace transfonn we obtain (15) and (16), see equations at the bottom of this page.
Example: We choose the following parameters for the two- state Markov chain
a =
p
= 0.2 s-1 andR I = 0.7 Mb/s, R2 = 1.3 Mb/s.
These parameters correspond to a video sequence containing low and high motion of equal amount and each low or high period last for 5 s on the average. The average rate is 1.0 Mb/s. We choose the following transmission rates
A1 = 0.5 Mb/s, A, = 1.0 Mb/s, A h = 1.5 Mb/s. The thresholds Tl, T,, and T h are chosen as
Ti = O.IBM, T, = 0 . 5 B ~ and T h = 0 . 9 B ~ and
BM
varies from 1 Mb/s to 10 Mb/s (1 s to 10 s of video). The mean first passage times are shown in Fig. 10 as a functionof buffer size, where the solid curve represents E [ q ] = E[Q]
and the dashed curve corresponds to E[r3]. Although the
parameters used in the plots in Fig. 10 are not matched to the specific rate process used for the experimentation in Section
IV,
the curves show similar trends with the curves in Fig. 7. When BM is large, E[r1] and E[r2] are dominated by thefirst term in (13) and (14) respectively. The reason for this
is that as
BM
gets larger, the mean first passage times also increase and the effect of the initial state is washed out.m e n the transmission rate is A,, the average dnft is zero.
E[Q] is determined by the occurrence of a temporary overload
or underload period whose duration should increase as BM gets larger. Since the time spent at each state is exponentially distributed, the probability of a long overload or underload period decreases exponentially as BM increases. Therefore,
E [ T ~ ] increases exponentially with the buffer size. For large buffer size, starting at the medium threshold, the mean time to hit the lower or upper threshold is large compared to mean passage times from lower and upper thresholds to the medium threshold. Therefore, f, is much larger than f z and f h when the receive buffer is large (at
BM
= 10 Mb, f, = 5/6 and fl = f h = 1/12).VI. CONCLUSION
We have demonstrated the adaptiveness and efficiency of client-based rate and synchronization control through the GRAMS implementation. Currently, we are refining the interface and performing further traffic studies based on real applications. Also, we presented new performance analysis methodologies using first passage time analysis, €or which, both the state of the buffer and the state of the video encoding algorithm are considered.
The current GRAMS server as well as the client interface and control are functioning as expected in our current imple- mentation. Further experience will be gained and reported as the server and client are deployed locally on our campus.
APPENDIX A
SERVER AND CLIENT INTERFACE
In GRAMS, three types of media are distinguished and a queue is associated with each media type. In decreasing order
of service priority, they are as follows:
This includes video (CBR and VBR video) and audio that requires continuous transmis- sion and playback. The major QoS concerns are latency and jitter as defined earlier.
mLEMENTATION OF MULTMDLA
HUI et al.: CLIENT-SERVER SYNCHRONIZATION AND BUFFERING FOR VARIABLE RATE MULTIMEDIA RETRIEVALS 235
...
c round
Performance of GRAMS sewer for Video sewice
5 1 I 22 20
-
$18- 5. r n g 1 6 - 0 c 3 S 14- 12- 4.51
- - 41 alpha = 0.99 threshold = 5 threshold = 2 _ - - .-i
Z 2.5 3;Quick response datu: This includes images, postscript files for transparencies, etc., for which the major QoS concern is latency.
Time insensitive datu: This includes all sonts of retrieval
data that do not have strict delay requirements.
The service of these three queues is done in a round robin fashion in rounds of fixed duration (Fig. 11). A packet is sent for each connection in a round. The rate of the connection is therefore given by the packet size divided by the duration of the round. Rate assignment is done by packet size assignment during connection setup. Rate adjustment by changing the packet size occurs when feedback requests are made downstream by the client. The packets are served according to the priority of the me&a type described above. Transmission starvation (or jitter) occurs for a connection when a packet for that connection is not transmitted within that round. Cache starvation occurs when a packet cannot be transmitted in a round due to cache underflow.
We monitor the QoS at the server by computing the under- flow jitter rate of the transmit value. The starvation count is updated per round for each connection i according to
in which I, = 1 if, during the round no packet is sent due to cache underflow or transmission starvation. Compensation of transmission may occur if the round has time left over and if C, is positive. In this case, I, is equal to one minus the
number of packets transmitted for the connection i . For quick response data services such as image transport, we set a z = 1 so that C, represents the cumulative transmission deficit. For
video transmission, we set Q,
<
1 so that C, representsa geometrically weighted running sum of the transmission deficit.
The single parameter C, keeps track of the QoS, for
which, the server is trying to maintain for connection i. However, the actual QoS perceived by the client is better than C, because further buffering and smoothing of jitter is
performed at the client. Nevertheless, the local server QoS
parameter is useful because the degradation of this QoS
parameter can result from usage congestion of any resource, such as; the disk bus, cache memory, transmission bandwidth, or processing cycles. When the parameter exceeds a certain
threshold, GRAMS attempts to reduce usage congestion by
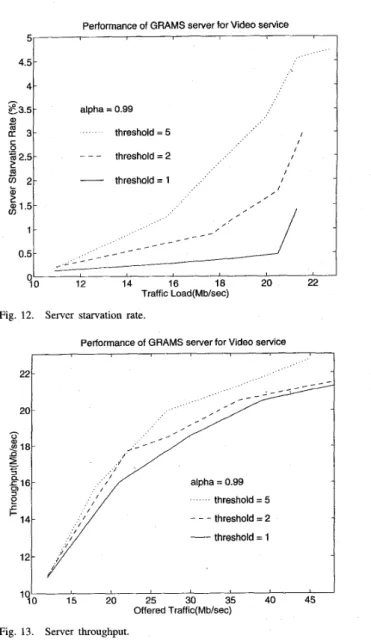
exercising rate control and admission controll. Rate control reduces the rates of quick response data by actions such as reducing the packet size for images. Admission control delays new admissions until the QoS parameter recedes. Fig. 12 plots the overall system starvation rate as a function of the offered load, a , and thresholds for video. As expected, starvation
0.5 I I threshold = 1
-
I I-
- -
_ _ _ - - / / / / , / '/
-
--
- -
-
_ -
12 14 16 18 20 22 Traffic Load(Mb/sec)Fig. 12. Server starvation rate.
Performance of GRAMS sewer for Video sewice
I 1
... threshold = 5
~ threshold = 1
'4b
15 i o 25 30 i5 i o 45'
Offered Traffic(Mb/sec)
Fig. 13. Server throughput.
increases as offered load is increased. Starvation can occur even at low load because of the rather unpredictable load in each round for the operating system, making available processing cycles in each round for caching and transmission functions somewhat unpredictable. Such starvation has the effect of gating admission very much the same way as a
traffic light. Fig. 13 plots the carried load as a function of the
offered load (assuming failed admission are cleared instead of being queued). The difference between carried load and the offered load reflects the fraction of connection requests that suffers delay (often minimal) before the connection is completed. Thus, we have a system that is adaptive and degrades gracefully as system load is increased, and requires
very little knowledge of traffic statistics.
APPENDIX B
In this Appendix, we derive the Laplace transform
Fs(0)
ofE[.
I
s , z] with respect to z and show that the N-dimensional vector F(0) given by (4) can be represented by (5).236 IEEE JOURNAL ON SELECTED AREAS JN COMMUNICATIONS, VOL. 14, NO. 1, JANUARY 1996
Case 1: X
>
R, where we used the change of variable x' = x+
(A - R,)t toobtain the second term. Evaluating the above integrals we have Taking the Laplace transform of (l), we have
Fs(@) = 1 [ e - @ B ~ q , - e-oBz
F,(Q)
= e-oz e - q a X - R , -ax
+
qsslJ"'
e-Ox @ d q , - - Rs)) ~ 2 - x B2 - 2.
(4s-
@(A - R,) 1 - e-*((
-B">>l
+ 4, - 0(X -R,)
t:
4ss'1
x
-
R, s'fs B i - q s t [ t+
E['I
s',x+
(A - R,)t]] d t dx 1F e
s ' # si*
- -L
e - H " ( l - e-4.%g)dx qss/lBz
e - ' z ' E [ TI
s / , x / ] 4 s B1 . b s , ( 0 ) - e-(@-*)B2P(A)]
X - R,.
(19)Comparing (18) and (19) we observe that both equations have the same form with B1 and B2 interchanged. Multiplying both sides of (18) and (19) with qs
-
O(X - R,) and arranging the terms, we obtain the matrix equation( Q
+
BD)F(Q) =b(Q)
+
s ' f s 1
e-(4a-o(A--Ra))t d t
ax'
where we used the change of variable x' = x
+
(A - &)t to obtain the second term.where
b(
6') = [bl(e),
. .. ,
b~ ( B)IT is given by. [F,,(Q)
- e - ( Q - & ) B 1.
fi'
E['I
s', d]e-*"'dz']for a state s with X
>
R,. For s with X<
R,, b s ( 0 ) is the same as (20) with B1 and B2 interchanged. bs(6') containsN ( N - 1) unknown constants { F , ~ ( & - ) } s + ~ .
These constants correspond to the discontinuity of B[T
I
s, x] at B1 or Ba. For a state s with X>
R,
[e--BB1 (qs -
e(),
- R,) 1 --
@ s ( G - Q(X - R s ) ) lim E[.I
s , x ] = 0 4Sl I/"&.
( 1-
e-*(Bz-Bl))) - e-QBZ 1 qs -q x
- R,) qss' whereas+
.
k:.(~j - e-(o-*)B1ps,(A)].
(18) s f s lim E[.I
s , ~ ]>
0although E[.
I
s,B1] = 0. Similarly, for a state s withX
<
R,, the discontinuity occurs at Bz. We can write fors with X
>
R,x\Bi
Case 2: X
<
R,Taking the Laplace transform of (2), we have
and for a state s with X
< R,
+ 4ss,l;
e-q.ts ' # s
1"
2
1
b , ( ~ ) =
_ -
1 (e-'B1 - e--BBZ) + y,e-*Bz (22)0
.
[t+
E[.I
S I , IC+
(A - R,)t]] d t dxBz = - R I where the unknown constants
{rs}
can be expressed from (20).These constants are evaluated by taking the inverse Laplace transform of
z(0)
= (Q+
QD)-lb(Q) and applying the following boundary conditions: For each state s with X>
R,,we set E['
I
s,&] = 0 and for s with X<
R,, we set E[.I
s,&] = 0. Since {y,} appears as a coefficient in the corresponding mean passage time equations,{rs}
can be obtained as the solution of a system of N linear equations. e--Bz (1 - e-qs ,,_X) d7q s B1
+
qsstL;
e-%[.I
S ' , d ] s ' # sHUI el al.: CLIENT-SEKVEK SYNCHRONIZATION AND BUFFEIUNG FOR VARIABLE KATE MULTIMEDIA RETNEVALS 231 REFERENCES
[ l ] T. D. C. Little and F. Kao, “An intermedia skew control system for multimedia data presentation,” in Proc. 3rd Int. Wo rkshop Network Operating Syst. Support Digital Audio video, La Jolla, CA, Nov. 1992.
[2] T. D. C. Little and A. Ghafoor, “Synchronization and storage models . for multimedia objects,” IEEE J. Select. Areas Commutt., vol. 8, no. 3,
Apr. 1990.
[3] __ , “Multimedia synchronization protocols for broaliband integrated services,” IEEE J. Select. Areas Commun., vol. 9, no. 9, Dec. 1991. [4] N. U. Qazi, M. Woo, and A. Ghafoor, “A synchronization and com-
munication model for distributed multimedia objects,” in Proc. ACM
Multimedia, Anaheim, CA, 1993.
[5] P. V. Rangan, S. Ramanathan, and H. M. Vin, ‘‘Techniques for multi- media synchronization in network file systems,” IEEE Comp. Commun., vol. 16, no. 3, Mar. 1993.
[6] P. V. Rangan and H. M. Vin, “Designing an on-demand multimedia service,” IEEE Commun. Mag., vol. 30, no. 7, July 1992.
[7] H. P. Katseff and B. S. Robinson, “Predictive pre-fetch in the neme- sis multimedia information service,” in Proc. ACM ,WuiUltimedia, San Francisco, Oct. 1994.
[8] P. Hoepner, “Synchronizing the presentation of multimedia objects,”
IEEE Commun. Mag., vol. 15, no. 9, Nov. 1992.
[9] R. Steinmetz, “Synchronization properties in multimedia systems,” IEEE
J. Select. Areas Commun., vol. 8 , no. 3, Apr. 1990.
[lo] D. P. Anderson and G. Homsy, “A continuous media 1/0 server and its synchronization mechanism,” IEEE Comp., vol. 24, no. 10, Oct. 1991. [ l l ] D. Shepherd, D. Hutchinson, F. Garcia, and G. Coulson, “Protocol
support for distributed multimedia applications,” Comp. Comrnun., vol. 13, no. 7, Sept. 1990.
[12] J. Y. Hui, J. Zhang, and J. Li, “Quality of service control in GRAMS
for ATM local area network,” IEEE J. Select. Areas Commun., vol. 13, no. 4, May 1995.
[13] D. Minoli and R. Keinath, Distributed Multimedia Through Broadband
Communications Services.
[14] J. Y. Hui, “Resource allocation for broadband networks,” IEEE J. Select.
Areas Commun., vol. 6, no. 9, Dec. 1988.
[15] A. Pitsillides and J. Lambert, “Adaptive connection admission and flow control: Quality of service with high utilization,” in Proc. Con$ Comp.
Commun. (IEEE Infocom), Toronto, Canada, June 19514.
[16] G. Ramamurthy and R. S. Dighe, “Distributed sonrce control: a network
access control for integrated broadband packet networks,” IEEE J. Select. Areas Cornmun., vol. 9, UD. 990-1002, Sept. 1991.
Norwood, MA. Artech House, 1994.
K. Obraczka et aL, “Internet re&rce discovery iervices,” IEEE Com-
put., pp. 8-22, Sept. 1993.
G. Branwyn, Mosaic Quick Tour: Accessing & Navigafing the Internet’s
World Wide Web.
SunSoft Incorporated, “CellB Codec,” in Imaging Library Program-
mer’s Guide (Solaris XIL 1.1 Imaging Library Answc:rBook). W. Stallings, Advances in ISDN and Broadband ISDA‘. Los Alamitos, CA. IEEE Computer Society Press, 1992.
D. Reininger, B. Melamed, and D. Raychaudhuri, “Variable bitrate MPEG video: characteristics, modeling and multiplexing,” in Proc. 14th
Int. Teletrafic Congress, Antibes Juan-les-Pins, France, June 6-10, 1994.
D. Anick, D. Mitra, and M. M. Sondhi, “Stochastic theory of data handling systems with multiple sources,” Bell Syst. Tech. J., vol. 61,
no. 8, Oct. 1982.
Chapel Hill, NC: Ventana Press, 1994.
Joseph Y. Hui (S’82-M’83-SM90) received the S.B., S.M., E.E., and Ph.D. degrees in electrical en- gineering from the Massachusetts Institute of Tech- nology, Cambridge, MA, in 1981, 1981, 1982, and 1983, respectively.
He joined Bell Communications Research, Mor- nstown, NJ, in 1983, and Rutgers University, New Brunswick, NJ, in 1989 as an Associate Professor in the Department of Electrical and Computer En- gineering. From 1979 to 1981, he worked at the Comsat Laboratories under the MIT Cooperative Program. He was also an Adjunct Professor at the Center for Telecommu- nications Research, Columbia University, New York, NY, from 1987 to 1988. His current research interests include coding and information theory, wireless information networks, and switching, protocol, traffic, and security issues for integrated broadband networks. He is the author of a book entitled Switching
and Trafic Theory f o r Integrated Broadband Networks (Kluwer Academic,
1990).
Dr. Hui is the recipient of the 1985 William Bennett Prize Paper Award given by the IEEE Communications Society. His work on multiple access communications and switching networks resulted in several patents. He also received the Presidential Young Investigator Award from the National h e n c e Foundation.
Ezhan Karasan (S’89) received the B.S. degree in
electrical engineering from the Middle East Techni- cal Umversity, Ankara, Turkey and the M.S. degree in electrical engineering from Bilkent University, Ankara, lhrkey, in 1987 and 1990, respectively. He is currently pursuing his Ph.D. degree in electncal engineering at Rutgers University, New Brunswick, New Jersey.
His research interests include performance analy- sis of broadband networks and mulhmedia systems. Mr. Karasan was awarded a fellowship from the NATO Science Scholarship Program from 1991 to 1994.
Jun Li (S’93) received the B.Sc. and MSc. degrees in electrical engineering from Xidian University, W a n , PRC, in 1983 and 1985, respectively. He is currently a Ph.D. student in the ECE department of Rutgers university, specializing in wireless multi- media services and broadband networks.
He worked as an assistant professor at Beijing In- formation Technology Institute, Beijing, PRC, from 1986 to 1990, working on speech synthesis and recognition. He served as a visiting researcher at NEC’s C&C Central Labs, Kawasaki, Japan, from 1987 to 1989. From 1990 to 1993, he worked for Data Control Limted, Tokyo, Japan and San Francisco, CA, as a software engineer, developing LAN softwares for multi-platform computers.
Junbiao Zhang received the B.S. degree in com- puter science from the University of Science and Technology of China, in 1990, and the M.S. degree in computer science from Rutgers University, Pis- cataway, NJ, in 1994. He is now a Ph.D. student in the computer science department at Rutgers Univer- sity. His research interests include distributed sys- tems, high speed networks, and multimedia systems. He also designed and implemented the multimedia semce system GRAMS.