THE NEW TECHNO-ECONOMIC PARADIGM: LABOR-USER OR LABOR-SAVER?
Ekrem DÖNEK( * ) Romesh K. DİWAN( * * ) ABSTRACT
The new techno-economic paradigm that has already taken place in some key industries is not that expected to harm labor market but requires more skills. The purpose of this study is to investigate the effects of the new technological advancements in the last two decades on employment and skill formation through an econometric study in the case of Turkish manufacturing. The results may be summarized as follows: First, the new paradigm has been found labor-using in the Turkish case. Second, the effects of the new paradigm on different skills are not clearly distinguishable. Finally, most of the factors, paticularly capital and labor, are found to be complimentary.
1. INTRODUCTION
Technological change refers to the changes in a production process as a result of the application of new knowledge in science and technology. It is an explanation of "incremental and consisting of several stages, extending well beyond the movement of scientific discovery (Cyert and Mowery, 1987: 25). Freeman (1987: 55) organizes four types of technological change: First are "incremental innovations", which are continuously occurred events in any industry or service activity as a result of inventions and improvements suggested by the scientists. Second are "radical innovations", which are discontinuous events and usually occur as a result of an R&D activity. Third are "the technological systems", which are the clusters of new innovations, and include numerous radical and incremental innovations in both product and processes. The final types of technological change are "changes of techno-economic paradigm", which are far-reaching and pervasive changes in technology. They affect all the branches of the economy and bring out some new sectors.
The last types of technological change affect the factor cost structure and conditions of production for almost all branches of the economy and give rise to entirely new sectors. They also comprise clusters of incremental and radical innovations as well as new technological systems. This type of technological change, change in techno-economic paradigm, does not frequently happen although the frequency of it is becoming short. A consensus is growing that there is a radical change in the industrial function. Some argue about the emergence of the "Third Wave" (Toffler, 1980), others talk about the era of the
(*) Doç. Dr., Erciyes Üniversitesi İ.İ.B.F. İktisat Bölümü.
"Great Divide" (Piore and Sabel, 1984), "Information Technology" (Freeman, 1987), and "Informatics" (The World Bank, 1993), still others theorize in terms of the techno-economic paradigms (Freeman and Perez, 1988; Diwan and Desai, 1990; Diwan and Chakraborty, 1991; Freeman, 1987; Kodama, at al., 1990). The basic premise of all these theses is the same. In the last two decades, a substantial change has taken place that involves technology in an essential way.
The purpose of this study is to investigate the effects of the new technological advancements in the last two decades on employment and skill formation through an econometric/empirical study in the case of Turkish manufacturing. In the following two sections, we will briefly define the new techno-economic paradigm with a comparison to the old paradigm, and then our hypothesis and the questions to be answered are discussed. In the section four, we discuss Turkish manufacturing in short. In the following final four sections, we will analyze the data, the model, econometric results and conclusion.
2. TECHNO-ECONOMIC PARADIGMS: OLD AND NEW
The mass-production techno-economic paradigm started just after the Second World War with the leadership of the U.S. It was pretty much consistent with the neo-classical factor substitution and cost minimization theories. The expectation from the old paradigm was that technological change decreases the need for labor and increases the "cost" of it. Because, demand for labor is determined by wage level. This causes a cost minimizer firm to get rid of that "extra" labor and substitute it with a relatively "cheap" capital. Therefore, the concern in the old paradigm is the quantitative effect of technological change on employment.
But the new paradigm concerns more "quality" rather than "price". Therefore, the skill structure of labor is more important than the wage. Now, the demand is expected to increase for skilled-labor instead of low-waged labor. This can be conformed with the recent studies by many authors (For example, see the discussion in Topel (1993), Murphy and Welch (1993), Groshen and Williams (1992) and Farber (1993)) These studies found that during the last decades the demand for low-skilled workers has decreased while the demand for high-skilled workers has increased. This caused a decrease in the employment trend of less-educated workers over the last decades while the employment trend of more-educated workers has presented a substantial increase over the same period.
The old mass production paradigm is now in crisis, and the new
information-based techno-economic paradigm has already taken place among the fastest growing industries such as microelectronics, computers and communications electronic equipments with a remarkable cost reduction.
According to Freeman (1987) and Diwan and Desai (1990), some of the characteristics of this the new paradigm are as follows: One, because of the continuous fall in costs (prices), the new product is becoming cheaper. Two, the supply of commodity is unlimited. Three, it is pervasive. Four, markets are getting more segmented. Small production units are becoming more economic in terms of flexibility and speediness in model and equipment changes. Therefore, the standardized, homogeneous products of the old mass-production paradigm can no longer compete with the new paradigm. Five, the quality of products, process, services proceed the price. Six, it leads to saving in all the production factors, but increases the need for skilled labor. Finally, the new paradigm requires a strong network of component and material suppliers with assembly type firms or with service firms as well as between producers, wholesalers and retailers for a quick response to changes in consumer demand.
The new paradigm satisfies all above conditions, and therefore, gives an edge over the old mass-production paradigm. The need is for more skill, training, and appropriate social and economic institutional change. It does not depend on the price of commodity, like the old paradigm, but the quality of commodity has the priority.
The new techno-economic paradigm consists of two things: R&D and skill formation. In other words, the new paradigm needs team work and training the people. Labor is no more considered as a "cost" of production, it has to be treated as an "asset". This information based paradigm is now international in character, and markets are becoming global. Entry is not that difficult. Because, production is international and customized. International competitiveness depends on how much a country invests on R&D, education and skill formation.
3. THE HYPOTHESIS AND TESTING
Our hypothesis is that the new techno-economic paradigm is not labor-saving, but it requires more skill. We will test the hypothesis in Turkish manufacturing in total, in the Turkish high-technology industries and in the Turkish textile industry.
To test the above hypothesis, we need to specify the questions that are supposed to be answered. The first question is about whether the technological change is labor-saving or labor-using; i.e., to what extent the demand for labor increases or decreases as a result of introducing new technologies. Although many studies found that the mass-production technologies are labor-saving, the net result is still ambiguous in the literature. It is assumed that the new techno-economic paradigm is not labor saving since it does not consider labor as a cost of production.
However, the new paradigm requires labor to be educated to meet the new production system. In other words, the more you invest on education and
training the labor, the more positive employment effects of technological change you get. Therefore, our second question to be answered is what the employment effects of the new technology on different skills are. This will be tested in the case of textiles.
The final question is what the substitution and complementary relationships between the factors of production are; i.e., are labor and capital substituting each other or complementing for one other?, or more deeply (i) to what extent there is a substitution relationship between unskilled-workers and capital?, (ii) to what extent there is a complimentary relationship between skilled-workers and capital?, and (iii) to what extent there is a substitution relationship between skilled-workers and unskilled-workers?
4. TURKISH MANUFACTURING
The reasons we like to study of Turkish manufacturing sector are that first the high technology sectors where more R&D spendings are done and more skilled labor is employed are an important part of it, and second it is the fastest growing sector and counted upon as an engine of development of the economy (Walstedt, 1980). The share of the sector in total value-added is about one fourth. The share of sector's export in total export is 88.5 percent in 1989. After agriculture, it is the second sector that contains employment. For example, the share of sector in total employment is more than 14 percent in 1989, and 34 to 35 percent of the employment is skilled.
The high-technology industries, namely chemicals, basic metals and machinery-equipment, transportation and telecommunications are very important regarding their value-added, employment and export shares in the economy. Their share in total value-added, employment and export of the manufacturing are about 58 percent, 40 percent and 41 percent in 1988, respectively. The average share of the skilled-labor in these three industries are 42 percent, and it is 51 percent in only the chemicals industry. They are the most accessible industries to apply the new paradigm first.
Textile is the most important industry in manufacturing sector as well as in the economy providing more production, employment and export. Textile and clothing industries have the highest rate of production growth (only clothing is 15.75 percent). The industry employs 28 percent of the manufacturing employment and about one fourth of the employment in the industry is skilled-labor. Most of its production is labor-intensive, and it has a comparative advantage upon many European countries. Almost 60 percent of the industry's production is exported, and 31 percent of the total export of the country belongs to this industry. Some recent studies (Such as the ones of Kırım and Ateş (1989) and Kırım (1990)). have shown that the most important element that lies under the export success of the textile in the 1980s is the
technological capabilities that provide the firms within the industry to invest and produce efficiently. In addition, textile has recently become one of the highest capital-intensive industries in the world after petrochemicals, paper and some metal industries. Therefore, textiles industry is possibly one of the accessible industries to apply the high-technologies, such as the shuttleless looms and open-end technologies.
5. DATA
The data in this study are taken from the various issues of Household
Labor Force Results, Annual Manufacturing Industry Statistics, Census of Manufacturing Industry, Statistical Yearbook of Turkey and National Education Statistics: Adult Education published by the Turkish State Institute of Statistics
(SIS); various issues of Main Economic Indicators published by the State Planning Organization (SPO); various issues of Textile Industry in OECD
Countries published by OECD; and finally Yearbook of Labour Statistics
published by International Labour Office (ILO). The period that is undertaken in the study is between 1970 and 1990.
The variables are defined as follows: Q is the real gross output in billions of Turkish liras; K is the capital in billions of Turkish liras; L is the annual average number of employees which is an arithmetic average number of employees in February, May, August and November; B is unskilled-labor; W is a total of the following six groups of labor: (i) high level technical personnel, (ii) middle level technical personnel, (iii) foreman, supervisors and other skilled-workers, (iv) management and administrative persons, (v) officers, and (vi) other workers; E is the total number of graduates from vocational and technical junior higher school, and high school plus university and other higher education institutions; and D is the total number of graduates (or successful finishers) from the following courses and schools: (i) Public Education, (ii) Domestic Science Schools, (iii) Practical Trade Schools for Girls, (iv) Apprenticeship Training (mastership plus journeyman), (v) Private Courses, and (vi) Industrial Practical Trade Schools. For the high-tech industries we took (i) to (vi) and for the textile industry we took (i), (ii), (iii), (v) and (vi) since (iv) is not relevant to the textiles.
6. THE MODEL
Econometric analysis of the employment effects of technological change are based on a factor-demand model that explains the producer's behavior. A general twice differentiable production function can be written as:
Q = f(X1, X2, ...., Xn) (1)
The production function (1) shows a set of possible relations between output (Q) and the minimum quantities of factors required (X1, X2, ...., Xn) given the
current state of technological knowledge.
The Cobb-Douglass production function is the most widely known function in the literature. Following Heathfield and Wibe (1987) and Antle and Capalbo (1988), it can be written in its logarithms form as:
lnQ = ln
α
0 +α
1 lnX1 + ... +α
n lnXn (2) or in the form:Q =
α
0 X1α1... Xnαn (3)The elasticity of substitution in the Cobb-Douglass production function is assumed to be equal to unity (
σ
= 1 orα
1 + ... +α
n = 1) which is the condition of constant returns to scale. Also, the Cobb-Douglass production function limits the substitution possibilities for more than two goods. Although the Constant Elasticity of Substitution (CES) production function allows the elasticity of substitution to be something other than unity, both the Cobb-Douglass and the CES production functions impose a priori assumptions of additivity and homogeneity of the production function. The transcendental logarithmic (translog) function developed by Christensen, Jorgensen and Lau (1971 and 1973) is more flexible since it allows the elasticity of substitution to change with output and/or factor proportions.The translog function can be obtained by specifying the Cobb-Douglass production elasticities to be log-linear functions of the factors. That is, adding the following condition to (3):
α
i =α
i +1
2
∑β
ij lnXj i = 1, ..., n (4) gives the translog production function:lnQ =
α
0 + Σα
i lnXi +1
2
ΣΣβ
ij (lnXi) (lnXj) (5)From this point of view, the translog aggregated employment function can be derived from the translog production function (5) as:
ln L =
α
0 +α
Q lnQ +α
K lnXK +α
E lnXE +α
D lnXD +1
2
β
QQ (lnQ)2 +1
2
β
KK (lnXK)2 +1
2
β
EE (lnXE)2+
1
2
β
DD (lnXD)2 +β
QK (lnQ) (lnXK) +β
QE (lnQ) (lnXE) +β
QD (lnQ) (lnXD) +β
KE (lnXK) (lnXE)+
β
KD (lnXK) (lnXD) +β
ED (lnXE) (lnXD) (6) We used two educational technological change variables in all the models; education (E) and training (D). In the total manufacturing, the high-technology and the textile (Textile-I) industries, we have employed both E and D for total employment (L).We have also employed a translog employment function for a disaggregated labor model; skilled-labor (W) and unskilled-labor (B). Assuming the production function with K, W, B, E and D, the translog disaggregated (skilled) employment function is written as follows:
ln W =
α
0 +α
Q lnQ +α
K lnXK +α
B lnXB +α
E lnXE +α
D lnXD+ 1 2β
QQ (lnQ)2 + 1 2β
KK (lnXK)2 +1
2
β
BB (lnXB)2 +1
2
β
EE (lnXE)2 +1
2
β
DD (lnXD)2 +β
QK (lnQ) (lnXK)+β
QB (lnQ) (lnXB) +β
QE (lnQ) (lnXE) +β
QD (lnQ) (lnXD) +β
KB (lnXK) (lnXB) +β
KE (lnXK) (lnXE) +β
KD (lnXK) (lnXD) +β
BE (lnXB) (lnXE) +β
BD (lnXB) (lnXD) +β
ED (lnXE) (lnXD) (7) In the textile industry, since we did not have a long enough data for disaggregated labor (W and B), we are forced to employ E and D in two separate models; E is used in model "Textile-II" and D is used in model "Textile-III".Differentiating the translog function with respect to the logarithm of factor quantities and employing the Shepherd's Lemma give the following set of demand equations for the factors:
∂ ∂ lnQ lnXi =
X
Q
i ∂ ∂ QXi =Si=
α
i+∑β
ij lnXj i,j = K, L, E, D (8)Since one of the share equations is redundant, one of them is arbitrarily dropped in the estimation procedure (capital will be dropped in our models).
To estimate the parameters of the share equations, iterative-Zellner (1963) estimation procedure, which is usually known as Iterative Seemingly Unrelated Regression Equations (ISUR) estimation has been employed.
In order for the equations to be well-behaved, the translog function (and also the factor share equations) are subject to the restrictions of symmetry condition, concavity condition and linear homogeneity in factor quantities.
The factor share equations derived from the translog function provide a very flexible framework for the analysis of factor substitution and demand elasticities. Using the factor shares Si and the coefficients
β
ii, Allen partial elasticities of substitution (AES) can be calculated:Own-AES:
σ
ii=β
ii i 2 i i 2+ S - S
S
i = K, L, E, D (9) Cross-AES:σ
ij=β
ij i j i j+ S S
S S
=β
ij i jS S
+1 i,j = K, L, E, D; i≠
j (10) Equations (9) and (10) give us a clear understanding of own-and cross-factor elasticities, complementarity and substitutability between the cross-factors as well as what the impacts of technological change on capital and labor are.Cross-elasticities of factor demand,
σ
LE andσ
LD,σ
WE andσ
WD,σ
BE andσ
BD, represent the effects of technological change (E and D) onemployment (L, W and B). Positive value represents a "labor-using" technological change while negative value represents a "labor-saving" technological change.
7. ESTIMATION RESULTS
Considering the substitution and complimentary relationships among the factors of production, Table 1 and Table 2 give a clear comparison among the aggregated and disaggregated employment models, respectively.
Table 1: Comparison of Average Cross-Elasticities of Demand for Factors: The Aggregated Employment Models
Cross-Elasticities Manufacturing
Industry High-Tech Industries Textile-I
σKL + + + σKE _ + + σKD _ + + σLE + _ _ σLD + + + σED + + +
Note: Positive value (+) represents “complementarity” while negative value (-) represents “substitutability” between the factors. K is capital stock, L is total labor, E is formal education, and D is labor training.
If we analyze the first three aggregated models, capital and labor are complimentary (
σ
KL) in all the three models. Capital with education (σ
KE) and capital with training (σ
KD) are both substitutes in the total manufacturing, as not expectedly, while they are compliments in the high-technology and the textile industries ("Textile-I"), indicating that technological change is capital-saving in manufacturing industry while it is capital-using in the other two industries. Labor and education (σ
LE) are compliments in manufacturing industry, as expectedly, while they are substitutes in the other two industries, but labor and training (σ
LD) are compliments in the three industries, as expectedly. Finally, education and training (σ
ED) are also compliments in the three industries.Table 2: Comparison of Average Cross-Elasticities of Demand for Factors: The Disaggregated Employment Models
Cross-Elasticities Textile-II Cross-Elasticities Textile-III
σKW + σKW + σKB _ σKB + σKE + σKD + σWB + σWB _ σWE _ σWD + σBE + σBD +
Note: Positive value (+) represents “complementarity” while negative value (-) represents “substitutability” between the factors. K is capital stock, W is skilled-labor, B is unskilled-labor and E is formal education
On the other hand, capital and skilled-labor (
σ
KW) are compliments, as expected, in both disaggregated models ("Textile-II" and "Textile-III"). Capital and unskilled-labor (σ
KB) are substitutes in the model "Textile-II", as expected,while they are compliments in the model "Textile-III". Capital with education (
σ
KE) and capital with training (σ
KD) are both compliments, as expected, indicating that technological change is capital-using in both models. Skilled-labor and unskilled-Skilled-labor (σ
WB) are substitutes in the model "Textile-III", as expected, but they are compliments in the model "Textile-II". Skilled-labor and training (σ
WD) are compliments, as expected, while skilled-labor and education (σ
WE) are substitute. Finally, unskilled-labor with education (σ
BE) and unskilled-labor with training (σ
BE) are both unexpectedly compliments.Finally, a brief comparison of the models, with employment effects of technological change, is given on Table 3.
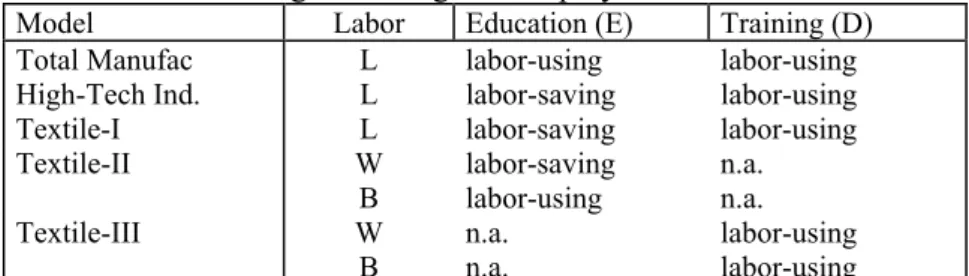
Table 3:Comparison of the Models Pertaining to the Effects of Technological Change on Employment and Skill Levels
Model Labor Education (E) Training (D)
Total Manufac L labor-using labor-using
High-Tech Ind. L labor-saving labor-using
Textile-I L labor-saving labor-using
Textile-II W
B labor-saving labor-using n.a. n.a. Textile-III W
B n.a. n.a. labor-using labor-using n.a: Not applicable; we have employed only one educational variable for technological change (i.e., either “Education” or “Training”). L is total labor, W is skilled-labor and B is unskilled-labor.
As it is seen on Table 3, formal education has mostly labor-saving effects on the labor market, only the total labor in the manufacturing and the unskilled-labor have got positive (labor-using) effects from it. This means that, the formal education system in Turkey has been helpful for some industries, such as total manufacturing at the aggregate employment level and the textile industry at the unskilled-employment level to increase their level of employment while it has been harmful for some others, such as the high-tech industries at the aggregate employment level and the textile industry at both the aggregate and the skilled-employment level. Especially the last point (
σ
WE) needs to be interpreted very carefully.On the other hand, adult education has always been a labor-using variable for all the models and for all kinds of labor. This indicates that as the numbers of graduates from adult education institutions increase, the level of employment at every level also increases. In other words, technological advancements through labor training are no more substituting the labor requirements in these industries, they rather compliment them. Another important implication of these results is that labor training is more consistent with the new techno-economic paradigm than the formal education at least in
the Turkish case.
8. CONCLUSION
This study has shown us that technological change in Turkish manufacturing is generally labor-using. Education is mostly labor-saving especially for the high-tech and the textiles industries and there is no clear result, it remains ambiguous. Therefore, it is not much consistent with the new techno-economic paradigm. On the other hand, training is found all labor-using in all the industries examined, i.e. it is more consistent with the new paradigm.
Also, the Turkish high-technology sector is found consistent with the new techno-economic paradigm; the share of high-tech employment in total manufacturing employment is about 40 percent, and the share of skilled-labor in these industries is more than 41 percent. The share of skilled-labor is 51 percent in the chemicals. Also, the increase in the share of skilled-labor in the high-tech industries from 1983 to 1990 is about double, from 22 percent in 1983 to 42 percent in 1990, which is a very strong development. Moreover, the labor-using effect of technological change is increasing by time.
Finally, the textile industry is going in the same direction with the high-tech industries. This is also a consistent result with the developments in the world textile industry; the proportion of shuttleless looms to shuttle looms in weaving, has reached about 100 percent in 1984 in many countries, the open-end machines in spinning replaced the ring and automatic new electronic devices in finishing, bleaching, dying and printing have already taken place in the industry.
ÖZET
Bu çalışmanın amacı, yeni tekno-ekonomik paradigmanın yaklaşık yirmi yıllık süre içerisinde istihdamı ve istihdamın vasıf yapısını hangi yönde nasıl etkilediğini Türkiye imalat sanayii üzerinde translog üretim (istihdam) fonksiyonu kullanılarak ekonometrik bir çalışma ile ortaya koymaktır. Çalışmanın sonunda, yeni teknolojilerin genel olarak emek piyasasını olumsuz yönde etkilemediği, ancak farklı vasıf yapısına sahip işgücü üzerindeki etkisinin ne yönde olduğu net olarak anlaşılamamıştır. Bu da bize göre, Türkiye’de işgücünün vasıf yapısının nisbeten düşük ve nitelik farkının az olmasından kaynaklanmaktadır. Ayrıca, üretim faktörlerinin, özellikle de emek ve sermayenin birbirinin tamamlayıcısı oldukları sonucuna ulaşılmıştır. Zaten, yeni paradigmaya göre emek, üretim hattında gerekli bir servettir (beşeri servet).
REFERENCES
ANTLE, J.M., CAPALBO, S.M. (1988), "An Introduction to Recent Developments in Production Theory and Productivity Measurement", S.M. Capalbo and J.M. Antle (eds.), in Agricultural Productivity:
Measurement and Explanation , Washington, D.C.: Resources for the
Future.
BERNDT, Ernst R. (1991), The Practice of Econometrics: Classic and
Contemporary, Massach.: Addison-Wesley Publishing Co.
CHRISTENSEN, Laurits R., JORGENSON, Dale W., LAU, Lawrence J. (1971), "Conjugate Duality and the Transcendental Logarithmic Production Function", Econometrica, 39, 255-256.
CHRISTENSEN, Laurits R., JORGENSON, Dale W., LAU, Lawrence J. (1973), "Transcendental Logarithmic Production Frontiers", The
Review of Economics and Statistics, 57, 28-45.
CYERT, R.M., MOWERY, D.C., eds. (1987), Technology and Employment:
Innovation and Growth in the U.S. Economy, Washington
D.C.: National Academy Press.
DIWAN, Romesh, DESAI, Suresh (1990), "Market Globalization and International Competitiveness: Implications for U.S. Business", Issues
in International Business, Spring, 1-7.
DIWAN, Romesh, CHAKRABORTY, Chandana (1991), High Technology and
International Competitiveness, New York: Praeger.
FARBER, Henry S. (1993), "The Incidence and Costs of Job Loss: 1982-91",
Brookings Papers on Economic Activity: Microeconomics, 1, 73-131.
FREEMAN, Christopher (1987), "Information Technology and Change in Techno-Economic Paradigm", C. Freeman and L. Soete (eds.), in
Technical Change and Full Employment, New York: Basil Blackwell.
FREEMAN, Christopher, PEREZ, Carlotta (1988), "Structural Crisis of Adjustment, Business Cycle and Investment Behaviour", Giovanni Dosi vd. (eds.), in Technical Change and Economic Growth, London: Printer Publishers.
GROSHEN, Erica L., WILLIAMS, Donald R. (1992), "White- and Blue-Collar Jobs in the Recent Recession and Recovery: Who's Singing the Blue?” Federal Reserve Bank of Cleveland: Economic Review, 28, 2-12.
HEATHFIELD, David F., WIBE, Sören (1987), An Introduction to Cost and
Inc.
KIRIM, Arman, ATEŞ, Hüseyin (1989), "Technical Change and Technological Capability in the Turkish Textile Sector", METU Studies in
Development, 16, 1-30.
KIRIM, Arman (1990), Türkiye İmalat Sanayiinde Teknolojik Değişim, Ankara:, TOBB.
MURPHY, Kevin M., WELCH, Finis (1993), "Occupational Change and the Demand for Skill, 1940-1990", The American Economic Review:
Papers and Proceedings, 83, 122-126.
PIORE, Michael J., SABEL, Charles F. (1984), The Second Industrial Divide:
Possibilities for Prosperity, New York: Basic Books.
KODAMA, F. vd. (1990), "Can Changes in the Techno-Economic Paradigm Be Identified Through Empirical and Quantitative Study?”, Science
Technology Industry Review, 7, 101-129.
THE WORLD BANK (1993), Turkey: Informatics and Economic
Modernization, Washington, D.C.: A World Bank Country Study.
TOFFLER, Alvin (1980), The Third Wave, New York: W. Moorow and Co. TOPEL, Robert (1993), "What Have We Learned from Empirical Studies of
Unemployment and Turnover?", The American Economic Review:
Papers and Proceedings, 83, 110-115.
WALSTEDT, B. (1980), State Manufacturing Enterprise in a Mixed Economy:
The Turkish Case, Baltimore: John Hopkin’s University Press.
ZELLNER, Arnold (1963), "Estimators for Seemingly Unrelated Regression Equations: Some Exact Finite Sample Results", Journal of the
American Economic Association, 58, 977-992.
APPENDIX A. Statistical Results
Table A-1: Manufacturing Industry Table A-2: The High-Technology Industries
Parameter Estimate t-statistics Parameter Estimate t-statistics αK 0.94948 611.119 αK -1.16590 -10.6167 αE 0.00223 3.08687 αL 0.02965 0.04583 αD 0.01434 15.5757 αE -0.01043 -0.22819 βKL -0.01150 -0.72049 βKL -0.06754 -2.19543 βKE -0.00581 -1.90656 βKE -0.04923 -2.26141 βKD -0.01771 -4.69529 βKD 0.34544 5.04223 βLL -0.00299 -0.20365 βLL 0.17928 2.31550 βLE 0.00777 2.66817 βLE -0.16152 -2.91542 βLD 0.00680 2.44328 βLD 0.04978 0.33039 βEE -0.00233 -0.93158 βEE 0.13115 3.19745 βED 0.00037 0.38915 βED 0.07961 0.74606 βDD 0.01063 8.70667 βDD -0.47483 -1.53904
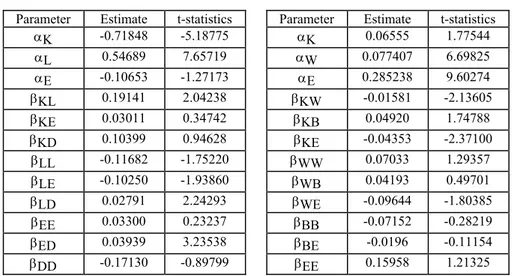
Table A-3: The Textile Industry (Textile-I)
Table A-4: The Textile Industry (Textile-II)
Parameter Estimate t-statistics Parameter Estimate t-statistics αK -0.71848 -5.18775 αK 0.06555 1.77544 αL 0.54689 7.65719 αW 0.077407 6.69825 αE -0.10653 -1.27173 αE 0.285238 9.60274 βKL 0.19141 2.04238 βKW -0.01581 -2.13605 βKE 0.03011 0.34742 βKB 0.04920 1.74788 βKD 0.10399 0.94628 βKE -0.04353 -2.37100 βLL -0.11682 -1.75220 βWW 0.07033 1.29357 βLE -0.10250 -1.93860 βWB 0.04193 0.49701 βLD 0.02791 2.24293 βWE -0.09644 -1.80385 βEE 0.03300 0.23237 βBB -0.07152 -0.28219 βED 0.03939 3.23538 βBE -0.0196 -0.11154 βDD -0.17130 -0.89799 βEE 0.15958 1.21325
Table A-5: The Textile Industry (Textile-III)
Parameter Estimation t-statistics αK -2.22383 -12.0823 αW -0.11830 -1.19682 αB -0.00267 -0.03129 βKW -0.03768 -1.41859 βKB -0.04150 -1.81345 βKD 0.51651 4.24753 βWW 0.02869 0.29968 βWB -0.06599 1.79333 βWD 0.07498 2.39903 βBB 0.12456 1.69867 βBD -0.01709 -0.10565 βDD -0.57442 -1.50696 B. Cross-Elasticities
Table B-1: Manufacturing Industry
Years σKL σKE σKD σLE σLD σED 1975 0.0152 0.0006 -0.0112 0.2927 0.2542 0.0628 1979 0.0158 -0.0038 -0.0146 0.2828 0.2459 0.1703 1983 0.0185 -0.0037 -0.0067 0.2571 0.2317 0.1635 1987 0.0217 -0.0040 -0.0042 0.2318 0.2127 0.1855 1990 0.0271 -0.0040 -0.0024 0.1996 0.1917 0.1892
Tablo B-2: The High-Technology Industries
Years σKL σKE σKD σLE σLD σED 1975 0.4507 0.1363 0.6358 0.0091 -0.1951 0.0250 1979 -0.1791 -0.2017 3.4306 -0.0906 0.2827 0.4773 1983 0.5830 0.3262 -0.4782 -0.33375 0.9409 1.3405 1987 0.1635 0.0783 1.4863 -1.6993 2.3764 4.7632 1989 0.0168 0.0097 2.0942 4.5569 0.9475 -0.4575
Table B-3: The Textile Industry (Textile-I)
Years σKL σKE σKD σLE σLD σED 1975 3.3220 1.1439 2.1194 -25.9144 7.5435 0.3799 1979 1.2437 0.6141 1.1602 3.7004 -0.4276 0.5628 1983 -1.3504 -0.0734 -0.1428 -0.2704 0.8372 0.9406 1987 0.2650 -0.0629 1.0198 -0.2086 1.2215 -0.8654 1989 0.6416 -0.1691 1.3742 -0.2690 1.5003 1.1896
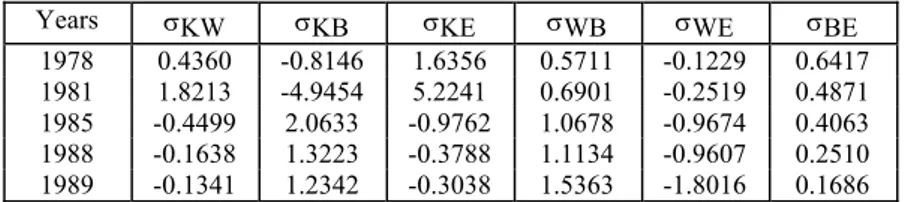
Years σKW σKB σKE σWB σWE σBE 1978 0.4360 -0.8146 1.6356 0.5711 -0.1229 0.6417 1981 1.8213 -4.9454 5.2241 0.6901 -0.2519 0.4871 1985 -0.4499 2.0633 -0.9762 1.0678 -0.9674 0.4063 1988 -0.1638 1.3223 -0.3788 1.1134 -0.9607 0.2510 1989 -0.1341 1.2342 -0.3038 1.5363 -1.8016 0.1686
Table B-5: The Textile Industry (Textile-III)
Years σKW σKB σKD σWB σWD σBD 1978 0.0363 0.2408 0.8939 -0.3404 0.7469 -0.0493 1981 0.2213 0.3506 -1.2091 -0.9244 2.2477 0.9019 1985 -0.--04 0.1297 1.7140 2.1786 -0.2250 1.9631 1987 -0.0715 0.0515 2.6893 0.7520 2.1404 2.3859 1989 -0.1613 -0.0720 4.03332 0.2931 3.7775 4.4069