RESEARCH ARTICLE
Measurement invariance of the moral vitalism
scale across 28 cultural groups
Maksim RudnevID1,2*, Christin-Melanie Vauclair2, Samira AminihajibashiID3,
Maja BeckerID4, Michal Bilewicz5, Jose´ Luis Castellanos Guevara6, Emma Collier-Baker7, Carla Crespo8, Paul Eastwick9, Ronald Fischer10, Malte Friese11, Angel Gomez12,
Valeschka Guerra13, Katja Hanke14, Nic Hooper15, Li-li Huang16, Minoru Karasawa17, Peter Kuppens18, Steve Loughnan19, Mu¨ jde Peker20, Cesar Pelay21, Afroditi Pina22,
Marianna SachkovaID23, Tamar Saguy24, Junqi Shi25, Mia Silfver-Kuhalampi26, Florencia Sortheix26, William Swann27, Jennifer (Yuk-Yue) Tong28, Victoria
Wai-lan Yeung29, Brock Bastian30
1 National Research University Higher School of Economics, Moscow, Russia, 2 Instituto Universita´ rio de Lisboa (ISCTE-IUL), CIS-IUL, Lisboa, Portugal, 3 Department of Psychology, University of Oslo, Oslo, Norway, 4 CLLE, Universite´ de Toulouse, Toulouse, France, 5 University of Warsaw, Warsaw, Poland,
6 ConSol, Mexico, Mexico, 7 University of Queensland, Brisbane, Australia, 8 CICPSI, Faculty of
Psychology, University of Lisbon, Lisbon, Portugal, 9 University of California, Davis, California, United States of America, 10 Victoria University of Wellington & Instituto D’Or de Pesquisa e Ensino, Wellington, New Zealand, 11 Saarland University, Saarbrucken, Germany, 12 Universidad Nacional de Educacio´n a Distancia, Madrid, Spain, 13 Universidade Federal do Espı´rito Santo, Espı´rito Santo, Brazil, 14 University of Applied Management Studies, Mannheim, Germany, 15 University of the West of England, Bristol, United Kingdom, 16 National Taiwan University, Taipei, Taiwan, 17 Nagoya University, Nagoya, Japan,
18 KULeuven-University of Leuven, Leuven, Belgium, 19 University of Edinburgh, Edinburgh, Scotland, 20 MEF University, Istanbul, Turkey, 21 Universidad Central de Venezuela, Caracas, Venezuela,
22 University of Kent, Canterbury, United Kingdom, 23 Russian Presidential Academy of National Economy
and Public Administration, Moscow, Russia, 24 Interdisciplinary Center (IDC) Herzliya, Herzliya, Israel,
25 Zhejiang University, Hangzhou, China, 26 University of Helsinki, Helsinki, Finland, 27 University of
Texas Austin, Austin, Texas, United States of America, 28 Singapore Management University, Singapore,
29 Lingnan University, Hong Kong, Hong Kong, 30 University of Melbourne, Melbourne, Australia
Abstract
Moral vitalism refers to a tendency to view good and evil as actual forces that can influence people and events. The Moral Vitalism Scale had been designed to assess moral vitalism in a brief survey form. Previous studies established the reliability and validity of the scale in US-American and Australian samples. In this study, the cross-cultural comparability of the scale was tested across 28 different cultural groups worldwide through measurement invari-ance tests. A series of exact invariinvari-ance tests marginally supported partial metric invariinvari-ance, however, an approximate invariance approach provided evidence of partial scalar invari-ance for a 5-item measure. The established level of measurement invariinvari-ance allows for comparisons of latent means across cultures. We conclude that the brief measure of moral vitalism is invariant across 28 cultures and can be used to estimate levels of moral vitalism with the same precision across very different cultural settings.
a1111111111 a1111111111 a1111111111 a1111111111 a1111111111 OPEN ACCESS
Citation: Rudnev M, Vauclair C-M, Aminihajibashi
S, Becker M, Bilewicz M, Castellanos Guevara JL, et al. (2020) Measurement invariance of the moral vitalism scale across 28 cultural groups. PLoS ONE 15(6): e0233989.https://doi.org/10.1371/journal. pone.0233989
Editor: Daniel Wisneski, Saint Peter’s University,
UNITED STATES
Received: January 14, 2020 Accepted: May 16, 2020 Published: June 9, 2020
Copyright:© 2020 Rudnev et al. This is an open access article distributed under the terms of the
Creative Commons Attribution License, which permits unrestricted use, distribution, and reproduction in any medium, provided the original author and source are credited.
Data Availability Statement: The raw data is
provided as a supplementary material to the paper.
Funding: The work of the first author (MR) is an
output of a research project implemented as part of the Basic Research Program at the National Research University Higher School of Economics (HSE University). The work of the second author (CMV) was supported by the Fundac¸ão para a Ciência e a Tecnologia; IF/00346/2014. The work of BB and WBS was supported by the Australian Research Council’s Discovery Projects funding
Introduction
Moral vitalism is a concept that captures how lay people think about and explain morally rele-vant actions and events in the world [1–2]. It is a lay theory that embraces the dual beliefs that forces of good and evil (a) actually exist and (b) may cause moral and immoral events to occur. Moral vitalism acts as a lay theory or heuristic for navigating the complex world of moral judgement and behavior and is attractive because it provides a convenient explanation for why good and bad things happen, as well as what makes people good or bad (cf. [3–5]). In order to measure moral vitalism, Bastian and colleagues [1] developed the Moral Vitalism Scale (MVS). The MVS had a high predictive validity, showing that those who endorsed moral vitalistic beliefs tend to worry about being possessed by evil, are more sensitive to being contaminated through direct or indirect contact with evil people due to the possibility of contagion, and are more concerned about maintaining their own mental purity. The measure also demonstrated high reliability across six studies. Based on these findings, it would appear that moral vitalists view immoral essences—the forces of evil—as having the capacity to “infect” and corrupt peo-ple’s minds and bodies, either through physical contact or mental content alone. The current study aims to investigate the degree to which the MVS has similar measurement characteristics across different cultures, that is, whether its scores can be used in cross-cultural research to examine relations of moral vitalism with other constructs and to test mean differences in vital-istic beliefs across cultures.
Moral vitalism
The construct of moral vitalism provides an important avenue through which to examine the role of spiritual beliefs in moral reasoning and judgement. It goes beyond prior work focused on how a belief in God may shape thinking and behavior (e.g., [6]) or work focusing on con-cerns over sanctity or purity (e.g., [7]), by examining a general lay theory about spiritual forces that is not limited to specific religious commitments or political beliefs. Moral vitalism pro-vides people with a convenient explanation for why good and bad things happen, as well as what makes people good or bad. Like other lay theories, moral vitalism may often be largely implicit and poorly articulated.
By focusing on how people explain their moral worlds, moral vitalism provides an account of moral cognition which diverges from the view that morality arises from the need to protect persons, groups, or norms (such as moral foundations theory, see [7]). While it shares some similarities with accounts that emphasize the role of sense making in the context of harm (such as the notion of dyadic completion: [8]), it goes beyond such accounts by suggesting that in efforts to understand their worlds, people often rely on beliefs that have explanatory power. Beyond completing a moral dyad of victim and perpetrator, moral vitalism serves to explain why there are victims and perpetrators in the first place. Yet, in contrast to theories focusing on the moral character of agents (e.g., [9]), moral vitalists see moral action as in part deter-mined by forces that are independent of people, but which can possess and influence them (see [1]). Supportive of this, moral vitalism appears to be relatively distinct from a similar con-struct focusing on pure good and evil published by [10], but which focused on purely good or evil people, as opposed to purely good or evil forces (see [1]).
In short, moral vitalism provides a filler explanation, or a placeholder concept, for why morally relevant events occur. As an approach to understanding moral cognition, it suggests that morality may be as much characterized by a set of beliefs about the nature of the world as it is by the basis on which people make moral judgements.
As a formal theory, moral vitalism reflects a basic form of cognition (belief) that is likely universal and probably arose as an explanation for life threatening events, such as disease in
scheme (Brock Bastian, Paul Bain, & William B. Swann Jr.: DP110102632). Jose´ Luis Castellanos Guevara was affiliated with a commercial institution “ConSol” and received support in the form of salary from “ConSol”. The funders provided support in the form of salaries for the mentioned, but did not have any additional role in the study design, data collection and analysis, decision to publish, or preparation of the manuscript. The specific roles of these authors are articulated in the ‘author contributions’ section.
Competing interests: One of the authors, Jose´
Luis Castellanos Guevara was affiliated with a commercial institution “ConSol” and received support in the form of salary from “ConSol”. This does not alter our adherence to PLOS ONE policies on sharing data and materials. There are no patents, products in development or marketed products associated with this research to declare.
contexts where other (i.e., more scientific) explanations were not available (see [11]). From this perspective, moral vitalism is perhaps most closely aligned with the purity dimension of moral foundations theory, given a similar emphasis on concerns regarding purity and conta-gion, and links to concerns over biological disease ([7,12]). As such, moral vitalism is likely to be evident across a range of cultures, and yet it is also likely to be reinforced within particular cultural contexts.
The theory and measurement of moral vitalism provides exciting and novel avenues for cross-cultural research. For example, [11] showed in a cross-national study that historically higher levels of pathogen prevalence were positively associated with the endorsement of moral vitalistic beliefs. Other social ecological factors could also be explored, such as the prevalence and frequency of natural disasters, because they may equally be related to the development of moral vitalism as a cultural meaning-making belief system. Given that moral vitalism takes account of the role of spiritual belief within the moral domain by focusing on core underlying assumptions, rather than specific tenets of religious, cultural or political beliefs, it opens up new avenues for comparison across culturally diverse populations, and across varying ideolog-ical and religious commitments. A cross-nationally reliable scale on moral vitalism is able to provide novel insights into the factors that stimulated the development and preservation of such beliefs.
Method
The scale
The current version of the MVS features five items assessing the belief in real, agentic forces of good and evil (e.g., “There are underlying forces of good and evil in this world”) on a 6-point Likert scale ranging from 1 = strongly disagree to 6 = strongly agree [1]. The item wordings are presented inTable 1. The scale was translated from English into the respective languages of countries (seeTable 2) by bilinguals. Accuracy of the translation was verified through back-translations or a committee approach.S1 Fileinclude translations of the MVS into these languages.
Data
A total of 3,202 undergraduate university students residing in 28 countries participated in this study. Ethical approval for this study was obtained by the last author from the Univer-sity of Melbourne’s Behavioural and Social Sciences Ethical Review Committee, project no. 2009001486. Informed consent was obtained in line with the requirements of ethical approval. All other samples in this study were collected in line with relevant ethical proto-cols and informed consent procedures for each country.
Table 1. Descriptive statistics of the five items comprising the moral vitalism scale.
Item labels Item wording Pooled sample means
Standard deviation % missing existence There are underlying forces of good and evil in this world 3.76 (1.66) .35
responsible Either the forces of good or the forces of evil are responsible for most of the events in the world
today
3.15 (1.62) .26
motivates The forces of good and evil often motivate human behavior 3.62 (1.66) .38
awareness People need to be aware of the good and evil that are in this world today 4.57 (1.37) .42
natural Good and evil are aspects of the natural world 3.87 (1.55) .29
The participants and cultures were sampled on a convenience basis. The central team reached researchers through professional networks and asked them to collect a sample of 80–100 respon-dents. Participants responded to a larger questionnaire that included the MVS. Respondents who took part in the study received non-monetary incentive such as course credits.
The average age of the total sample was 22.6 years (SD = 6.3), ANOVA test showed signifi-cant differences in age across samples. In Spain, the average age was substantially higher as the participants were students of an open university, which attracts more mature attendance. Gen-der composition was also significantly different across samples as indicated by a significantχ2 test. Overall 65% of all participants were female (seeTable 2). The data contained less than one percent of cases with missing values, these were treated with full information maximum likeli-hood in frequentist models, whereas Bayesian models implicitly incorporated missing values.
Analytical approach
The analysis followed three major steps. At first, we identified a pool of the items that showed similar factor structure across cultural groups. Second, we ran a series of full and partial exact
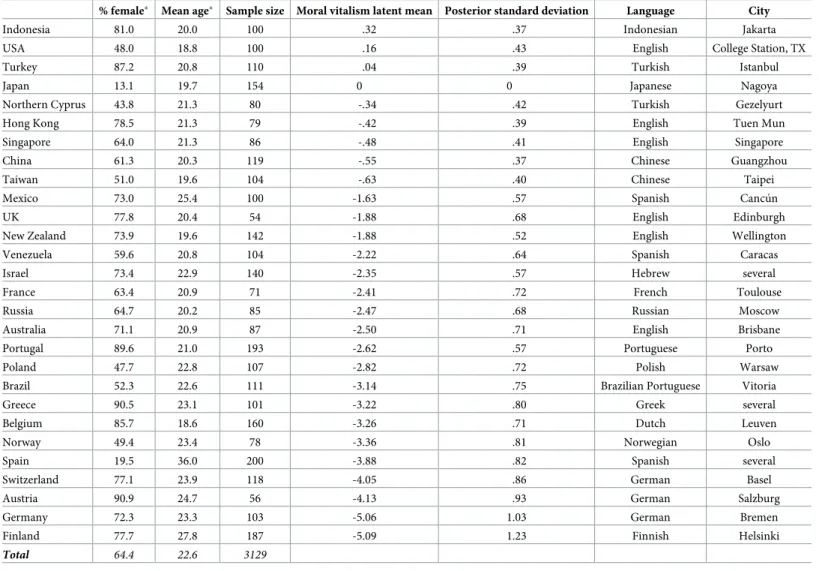
Table 2. Sample characteristics and the latent means of moral vitalism estimated by the partial approximate scalar invariance model (sorted by latent mean). % female� Mean age� Sample size Moral vitalism latent mean Posterior standard deviation Language City
Indonesia 81.0 20.0 100 .32 .37 Indonesian Jakarta
USA 48.0 18.8 100 .16 .43 English College Station, TX
Turkey 87.2 20.8 110 .04 .39 Turkish Istanbul
Japan 13.1 19.7 154 0 0 Japanese Nagoya
Northern Cyprus 43.8 21.3 80 -.34 .42 Turkish Gezelyurt
Hong Kong 78.5 21.3 79 -.42 .39 English Tuen Mun
Singapore 64.0 21.3 86 -.48 .41 English Singapore
China 61.3 20.3 119 -.55 .37 Chinese Guangzhou
Taiwan 51.0 19.6 104 -.63 .40 Chinese Taipei
Mexico 73.0 25.4 100 -1.63 .57 Spanish Cancu´n
UK 77.8 20.4 54 -1.88 .68 English Edinburgh
New Zealand 73.9 19.6 142 -1.88 .52 English Wellington
Venezuela 59.6 20.8 104 -2.22 .64 Spanish Caracas
Israel 73.4 22.9 140 -2.35 .57 Hebrew several
France 63.4 20.9 71 -2.41 .72 French Toulouse
Russia 64.7 20.2 85 -2.47 .68 Russian Moscow
Australia 71.1 20.9 87 -2.50 .71 English Brisbane
Portugal 89.6 21.0 193 -2.62 .57 Portuguese Porto
Poland 47.7 22.8 107 -2.82 .72 Polish Warsaw
Brazil 52.3 22.6 111 -3.14 .75 Brazilian Portuguese Vitoria
Greece 90.5 23.1 101 -3.22 .80 Greek several
Belgium 85.7 18.6 160 -3.26 .71 Dutch Leuven
Norway 49.4 23.4 78 -3.36 .81 Norwegian Oslo
Spain 19.5 36.0 200 -3.88 .82 Spanish several
Switzerland 77.1 23.9 118 -4.05 .86 German Basel
Austria 90.9 24.7 56 -4.13 .93 German Salzburg
Germany 72.3 23.3 103 -5.06 1.03 German Bremen
Finland 77.7 27.8 187 -5.09 1.23 Finnish Helsinki
Total 64.4 22.6 3129
�26 respondents did not indicate their gender and 34 respondents did not indicate their age.
invariance tests. Third, an approximate invariance approach was applied to adjust the model to the population more closely. At all stages we applied confirmatory factor analysis models using R package “lavaan” [13] and Mplus version 7.3 software [14]. All the codes with details of the analyses and the replication data can be found in theS1 File.
A conventional way to assess measurement invariance is to run a series of multiple groups confirmatory analyses [15]. First, a configural model is fitted to the data. Configural model does not constrain factor loadings or item intercepts. Second, a metric invariance model is fit to the data, which is similar to the configural model, but the factor loadings are constrained to be equal across groups. And finally, a scalar invariance model is fitted, which constrains both factor loadings and item intercepts. After fitting these three models to the data, they can be compared using likelihood ratioχ2test. However,χ2difference test was shown to be overly conservative with larger sample sizes [16]. Thus, another set of criteria was suggested: differ-ences in comparative fit index (CFI) larger than .01 and difference in RMSEA larger than .015 as an indication of substantial differences between models [17]. If a configural model has a substantially better fit than a metric invariance model, it is preferred over the metric invariance model. Likewise, if a metric invariance model has a substantially better fit than a scalar invari-ance model, the former is preferred over the latter.
An important prerequisite to this sequence of model testing is a well-fitting configural model. As a criterion of an acceptable fit for a factor model we used CFI/TLI > .90, RMSEA < .08; SRMR < .08 [18];χ2was ignored in this analysis due to a large (over 3000) sample. The model was identified using a marker variable approach (see [19]). After a preliminary analysis, we decided to use item “existence” as a marker, because it showed highly invariant parameters across groups when using different model specifications. Switching of a marker variable to the other items did not affect substantive results.
At the second stage of analysis we tested several partial invariance models. Byrne, Shavel-son, and Muthe´n [20] proposed the idea of partial invariance, which claims that some of the loadings/intercepts are allowed to vary without creating a substantial bias. They suggested that it is sufficient to have two invariant loadings for a partial metric invariance and two invariant intercepts for a partial scalar invariance. However, the consecutive tests of partial invariance might lead to an inductive solution which brings a danger of overfitting, that is, a possibility that the final model may not replicate with different data. For this reason, we were especially careful in handling model modifications which were not expected by the theory.
The third stage of analysis was based on Bayesian statistics with informative priors. The prior between-group difference in factor loadings and/or item intercepts was set to zero (no differences) and its variance was set to a conventionally low value. The between-group vari-ance in factor loadings and intercepts of the size .01 was considered negligibly small for most substantive conclusions (it defines the 95% confidence interval of absolute differences in parameters of .20, see also [21]). Between-group variance in parameters of .10 was considered large and deviating from the invariance (corresponds to±.63 difference on a standardized scale).
First, we tested an approximate configural model, in which the factor loadings and item intercepts were allowed to vary with a prior between-group variance of .10. Given a well-fitting configural model, we then set the prior between-group variance to .01 for loadings (approxi-mate metric invariance) and then for both loadings and intercepts (approxi(approxi-mate scalar invari-ance). In order to evaluate the model fit to the data, two key statistics were examined: 95% confidence interval for the difference between the observed and the replicatedχ2values (if it includes zero, it indicates acceptable fit), and related standardized index of posterior predictive p-value (PPP, which should be higher than .05 with a perfect fit indicated by value of .50). As long as the sample sizes were relatively small, we expected convergence issues. To ensure
convergence the models were run using 4 chains and a minimum of 30,000 iterations. All the models revealed stable solutions indicated by potential scale reduction factor (R-hat), which was smaller than 1.1 for every parameter. Scanning of trace plots did not reveal issues with convergence as well. Visual examination of autocorrelation plots detected no substantial prob-lems with the parameter estimation.
Results
Identifying the pool of items
The MVS initially included eight items: three reverse-coded items and five non-reversed items. Non-reversed items are listed inTable 1; reversed items were following: “Good and evil are human constructions”, “Things happen and sometimes they have good or evil conse-quences, but there is nothing that is truly good or truly evil”, “There is nothing that is really good or really evil in this world, it’s all a matter of perspective”. A preliminary analysis on the pooled sample demonstrated acceptable fit of a two-factor model: one factor loaded on all the reverse-coded items and the other factor loaded on the rest of items [CFI = .964, RMSEA = .069, SRMR = .045,χ2
(df = 19) = 299]. However, applying this model in the multiple group set-tings was challenging, as in many groups it resulted in a non-positive definite matrix, which signaled potential problems with the model and the data (such as high multicollinearity com-bined with small samples). Moreover, running the two-factor model separately in each group resulted in various model problems across groups.
We concluded that configural invariance across groups could not be detected with the eight items. Therefore, we dropped the reverse-coded items and examined measurement invariance for a one-factor model with the five straight-coded items only.
Exact measurement invariance tests
A simple multiple-group factor model with a single factor at the pooled sample showed unac-ceptable fit as indicated by a high value of RMSEA (.098; the other fit measures were within the recommended range, CFI = .971, TLI = .942). Modification indices suggested adding a covariance between items “awareness” and “natural” which improved the model and yielded a marginally acceptable value of .078 for RMSEA. At the next step, the modification indices sug-gested to add a covariance between residuals of the items “natural” and “existence” which makes sense, because both items claim the existence of good and evil forces in a natural world. The resulting model (Fig 1) had appropriate fit in a multiple-group setting (see model 1 in
Table 3), as well as it fitted to the data from each country separately–p-values of χ2tests of model fit were above .01 in every group. Therefore, this model was further used in the invari-ance testing as a configural model. The alternative model with two factors, one including “exis-tence”, “natural”, and “responsible”, and the other including “motivates” and “awareness” showed acceptable fit on the pooled sample but did not converge in multiple-group analysis (configural model).
Table 3lists fit indices from a series of the exact measurement invariance tests with multiple group confirmatory factor analyses. Constraining factor loadings across groups to equality, that is, testing the metric invariance, decreased CFI by .045 and increased RMSEA by .034, both values are much greater than the recommended ones. Therefore, we had to select config-ural invariance model over metric invariance and concluded that there is no full metric invariance.
Next, we tested partially invariant models. We examined the factor loadings in each group from the configural model in which they were estimated independently in every group. This information as well as modification indices indicated that factor loadings of items “existence”
and “awareness” had the largest differences across groups, so we relaxed these equality con-straints. Comparing the model fit of the partial metric invariance model (model 4) to the fit of the configural model revealed a decrease in CFI of .011 and increase in RMSEA of .013, which almost fell in the recommended range. So, we were able to conditionally accept this partial metric invariance model. However, when we tested the partial scalar invariance model, the decrease in CFI and increase in RMSEA were very large (model 5), thus, it was rejected. We also tried a minimal partial metric invariance model, releasing equality constraints on loadings of “existence”, “nature”, and “awareness” items, which expectedly showed an acceptable
Fig 1. Measurement model of moral vitalism scale.
https://doi.org/10.1371/journal.pone.0233989.g001
Table 3. Exact measurement invariance tests of the single-factor model of moral vitalism.
Model CFI ΔCFI RMSEA ΔRMSEA SRMR ΔSRMR χ2 Df
Full measurement invariance with 5 items and covariance between “awareness” and “natural” and between “existence” and “natural”
1 Configural .992 .066 .023 124.6 84
2 Metric .947 .045 .113 .047 .101 .078 465.7 192
3 Scalar .810 .137 .172 .059 .150 .048 1286.5 300
4 Partial metric, loadings of “existence” and “awareness” are allowed to vary across groups .982 .011 .079 .013 .056 .033 233.7 138 5 Partial scalar, loadings and intercepts of “existence” and “awareness” are allowed to vary across
groups
.934 .047 .126 .047 .082 .026 532.6 192 6 Partial metric, loadings of “existence”, “awareness” and “natural” are allowed to vary across
groups
.987 .005 .074 .008 .036 .013 178.3 111 7 Partial scalar, loadings and intercepts of “existence”, “awareness” and “natural” are allowed to
vary across groups
.973 .014 .096 .022 .044 .008 279.7 138
decrease in the model fit (model 6) compared to configural invariance model. This model was then used to test for the partial scalar invariance (model 7), a decrease in CFI was .014, close to the suggested threshold, but increase in RMSEA was .022, substantially larger than the recom-mended threshold of .015, and the absolute value of RMSEA of .096 pointed to the model’s overall poor fit to the data.
The resulting partial metric invariance model is prone to criticism, because, first, the RMSEA statistic, although technically being under the recommended threshold of .08, had an upper confidence bound which was beyond this threshold. Moreover, these models had a very few degrees of freedom, which may imply that the models could have been overfitted, that is, be applicable only to the current sample. Given the nature of the convenience sample, the problem of overfitting is especially important issue, so the minimally fitting model might not be the population model. Due to these concerns, we switched to the approximate measurement invariance approach [21–22], which in a way avoids the problem of overfitting by allowing some across-group variance in item intercepts and factor loadings.
Approximate invariance approach
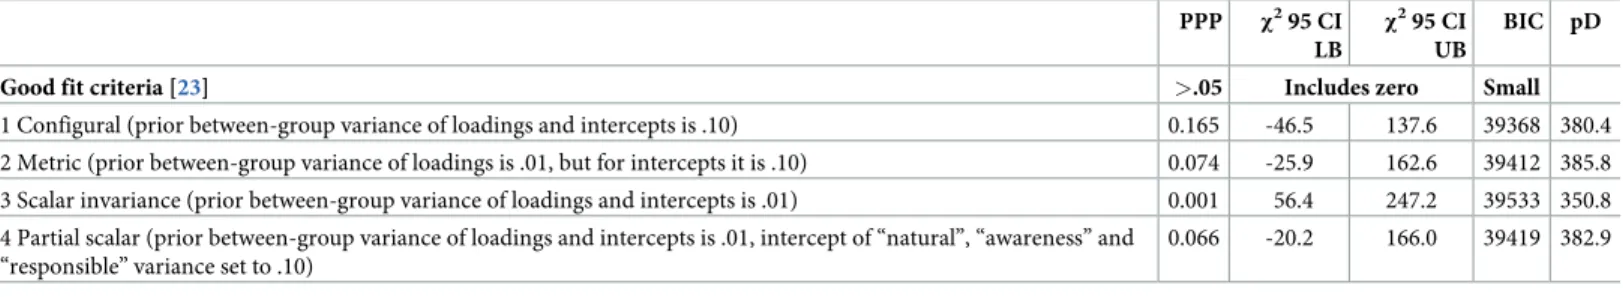
Table 4lists the model fit statistics of approximate invariance testing. The approximate config-ural model fits the data very well, showing PPP of .164 and a confidence interval ofχ2 includ-ing zero. The metric model showed a similarly good fit with PPP = .060. The scalar invariance model showed a deterioration in fit with a PPP dropping below the recommended threshold of .05 to essentially zero, and BIC increasing compared to the metric and configural models. Increasing prior variance of the intercepts of the items “natural”, “awareness”, and “responsi-ble” resulted in a partial approximate scalar invariance model that fitted the data sufficiently well: PPP of .061 was in the recommended range,χ2confidence interval included zero and the increase in BIC was relatively small. We consider this model final and conclude that the mea-surement model of moral vitalism with five items and two residual covariances (of the items “natural” with “awareness” and “existence”) is approximately and partially invariant at the sca-lar level, which implies that the means and regression/correlation coefficients can be compared across all 28 cultural groups.
The latent means estimated by the partial approximate scalar invariance model are listed in
Table 2. The latent mean had to be fixed to zero in one of the groups, so we randomly chose Japan. The other means represent differences in moral vitalism compared to Japan. Expect-edly, Western European countries occupied the lower ranks, while Asian cultures as well as USA and Cyprus scored the highest on moral vitalism. Previous analyses have shown that country-level the moral vitalism score correlated robustly with pathogen prevalence, therefore,
Table 4. Model fit indices of approximate invariance tests.
PPP χ295 CI LB χ2 95 CI UB BIC pD Good fit criteria [23] >.05 Includes zero Small
1 Configural (prior between-group variance of loadings and intercepts is .10) 0.165 -46.5 137.6 39368 380.4 2 Metric (prior between-group variance of loadings is .01, but for intercepts it is .10) 0.074 -25.9 162.6 39412 385.8 3 Scalar invariance (prior between-group variance of loadings and intercepts is .01) 0.001 56.4 247.2 39533 350.8 4 Partial scalar (prior between-group variance of loadings and intercepts is .01, intercept of “natural”, “awareness” and
“responsible” variance set to .10)
0.066 -20.2 166.0 39419 382.9
95 CI LB and 96 CI UB stand for 95% confidence interval, lower bound and upper bound, respectively. pD is estimated number of parameters.
underscoring the cross-cultural validity of the scale [11]. Interestingly, the lower levels of moral vitalism tended to coincide with the larger confidence interval of the estimate.
It is noteworthy that the latent means estimated by different models were highly similar. For example, the latent means from the exact scalar invariance model (model 3 inTable 3
which showed poor fit) correlated with the means estimated by the approximate partial scalar invariance model (model 4 inTable 4) at .99.
Discussion and conclusion
In this paper we aimed at testing a novel scale of moral vitalism across 28 cultural groups. A model with five items, a single factor and covariance of residuals for three items showed an acceptable fit. The multiple tests of measurement invariance indicated the lack of exact scalar as well as full metric invariance. The tests of approximate measurement invariance supported the presence of partial scalar invariance, where only intercepts of item “natural” were allowed to vary across groups. This conclusion allowed to correctly estimate latent means: Asian coun-tries as well USA and Northern Cyprus tended to be high on moral vitalism, while Western Europeans are less prone to follow this belief.
The results of the analysis demonstrated that MVS can be used to correctly measure moral vitalism in a wide range of cultures. Moreover, the results suggest that the concept of moral vitalism has approximately the same meaning across these cultures, whereas in general the lay theories of good and evil are intertwined with specific religious and cultural beliefs.
The current study has several limitations. First, the convenience sampling of the student participants may have affected the results, which might be biased towards younger, female, and educated individuals, rather than reflecting the parameters of the general population. However, a systematic pattern of latent means found in the study demonstrated that the group differences do indeed reflect cultural differences in the moral vitalism beliefs. Moreover, the use of similar samples across national contexts helped to tackle cultural differences while hold-ing other differences across samples constant.
Another limitation regards the exclusion of reversed-coded items at the preliminary analy-sis stage. It might have affected the results in a way that the final score and respective latent means of moral vitalism are likely to also include response tendencies, such as acquiescence and non-differentiation. It might not be problematic as [1] demonstrated that the measure had criterion and predictive validity regardless of the lack of balance in item wordings. However, future research should investigate this issue in depth.
Yet another potential limitation is related to the fact that we detected only a weak evidence of scalar invariance–that is, the initial model was appended with the two residual covariances and only two out of five item intercepts were found to be invariant across all the countries under study. Notwithstanding the differences in model fit, various models tested in the study estimated highly similar factor means which correlated across countries at .99 or higher. It indicates that the small differences in item intercepts and factor loadings did not substantively affect the latent means proving their reliability. It suggests that the poor fit of the exact scalar invariance model was due to some noise in the data unrelated to the problems of measurement invariance itself.
Despite these limitations, our results provided evidence of MVS ability to reliably measure moral vitalism in a wide range of cultures which allows comparison of latent means and corre-lations/regression coefficients across a wide range of cultures. Establishing the cross-cultural invariance of moral vitalism opens new lines of inquiry into cultural variability in naïve theo-ries of spirituality and morality.
Supporting information
S1 File.(ZIP)
Author Contributions
Conceptualization: Brock Bastian.Data curation: Maksim Rudnev, Samira Aminihajibashi, Maja Becker, Michal Bilewicz, Jose´
Luis Castellanos Guevara, Emma Collier-Baker, Carla Crespo, Paul Eastwick, Ronald Fischer, Malte Friese, Angel Gomez, Valeschka Guerra, Katja Hanke, Nic Hooper, Li-li Huang, Minoru Karasawa, Peter Kuppens, Steve Loughnan, Mu¨jde Peker, Cesar Pelay, Afroditi Pina, Marianna Sachkova, Tamar Saguy, Junqi Shi, Mia Silfver-Kuhalampi, Floren-cia Sortheix, William Swann, Jennifer (Yuk-Yue) Tong, Victoria Wai-lan Yeung.
Formal analysis: Maksim Rudnev.
Funding acquisition: Christin-Melanie Vauclair. Investigation: Maksim Rudnev, Brock Bastian. Methodology: Maksim Rudnev, Brock Bastian.
Project administration: Maksim Rudnev, Christin-Melanie Vauclair. Software: Maksim Rudnev.
Supervision: Christin-Melanie Vauclair. Validation: Maksim Rudnev, Brock Bastian. Visualization: Maksim Rudnev.
Writing – original draft: Maksim Rudnev, Brock Bastian.
Writing – review & editing: Maksim Rudnev, Christin-Melanie Vauclair, Brock Bastian.
References
1. Bastian B, Bain P, Buhrmester MD, Go´mez A´ , Va´zquez A, Knight CG et al. Moral vitalism: Seeing good and evil as real, agentic forces. Personality and Social Psychology Bulletin. 2015 Aug; 41(8):1069–81. https://doi.org/10.1177/0146167215589819PMID:26089349
2. Bastian B. Moral Vitalism. In: Gray K., Graham J., editors. Atlas of Moral Psychology. New York: Guil-ford Press; 2018. pp. 303–309.
3. Staub E. The roots of evil: The origins of genocide and other group violence. Cambridge: Cambridge University Press; 1989.
4. Staub E. The psychology of good and evil: Why children, adults, and groups help and harm others. Cambridge: Cambridge University Press; 2003.
5. Zimbardo PG. The Lucifer effect: Understanding how good people turn evil. New York, NY: Random House, 2007.
6. Shariff AF, Norenzayan A. God is watching you: Priming God concepts increases prosocial behavior in an anonymous economic game. Psychological science. 2007 Sep; 18(9):803–9.https://doi.org/10. 1111/j.1467-9280.2007.01983.xPMID:17760777
7. Haidt J, Joseph C. Intuitive ethics: How innately prepared intuitions generate culturally variable virtues. Daedalus. 2004; 133(4):55–66.
8. Gray K, Waytz A, Young L. The moral dyad: A fundamental template unifying moral judgment. Psycho-logical Inquiry. 2012 Apr 1; 23(2):206–15.https://doi.org/10.1080/1047840X.2012.686247PMID: 22815620
9. Goodwin GP. Moral character in person perception. Current Directions in Psychological Science. 2015 Feb; 24(1):38–44.
10. Webster RJ, Saucier DA. Angels and demons are among us: Assessing individual differences in belief in pure evil and belief in pure good. Personality and Social Psychology Bulletin. 2013 Nov; 39 (11):1455–70.https://doi.org/10.1177/0146167213496282PMID:23885037
11. Bastian B, Vauclair CM, Loughnan S, Bain P, Ashokkumar A, Becker M et. al. Explaining illness with evil: pathogen prevalence fosters moral vitalism. Proceedings of the Royal Society B. 2019 Oct 30; 286 (1914):20191576.https://doi.org/10.1098/rspb.2019.1576PMID:31662082
12. van Leeuwen F, Park JH, Koenig BL, Graham J. Regional variation in pathogen prevalence predicts endorsement of group-focused moral concerns. Evolution and Human Behavior. 2012 Sep 1; 33 (5):429–37.
13. Rosseel Y. Lavaan: An R package for structural equation modeling and more. Version 0.5–12 (BETA). Journal of statistical software. 2012; 48(2):1–36.
14. Muthe´n LK, Muthe´n BO. Mplus User’s Guide. Eighth Edition. Los Angeles, CA: Muthe´n & Muthe´n; 1998–2017.
15. Vandenberg RJ, Lance CE. A review and synthesis of the measurement invariance literature: Sugges-tions, practices, and recommendations for organizational research. Organizational research methods. 2000 Jan; 3(1):4–70.
16. Cheung GW, Rensvold RB. Evaluating goodness-of-fit indexes for testing measurement invariance. Structural equation modeling. 2002 Apr 1; 9(2):233–55.
17. Chen FF. Sensitivity of goodness of fit indexes to lack of measurement invariance. Structural Equation Modeling: A Multidisciplinary Journal. 2007 Jul 31; 14(3):464–504.
18. Brown TA. Confirmatory factor analysis for applied research. Guilford publications, 2006.
19. Little TD, Slegers DW, Card NA. A non-arbitrary method of identifying and scaling latent variables in SEM and MACS models. Structural equation modeling. 2006 Jan 1; 13(1):59–72.
20. Byrne BM, Shavelson RJ, Muthe´n B. Testing for the equivalence of factor covariance and mean struc-tures: the issue of partial measurement invariance. Psychological bulletin. 1989 May; 105(3):456.
21. Muthe´n BO, and Asparouhov T. BSEM measurement invariance analysis. Mplus web notes: No. 17. 2013.www.statmodel.com
22. Cieciuch J, Davidov E, Schmidt P, Algesheimer R. How to obtain comparable measures for cross-national comparisons. KZfSS Ko¨lner Zeitschrift fu¨r Soziologie und Sozialpsychologie. 2019; 71(Supple-ment 1): 157–186.https://doi.org/10.1007/s11577-019-00598-7
23. Van de Schoot R, Kluytmans A, Tummers L, Lugtig P, Hox J, Muthe´n B. Facing off with Scylla and Cha-rybdis: a comparison of scalar, partial, and the novel possibility of approximate measurement invari-ance. Frontiers in psychology. 2013 Oct 23; 4:770.https://doi.org/10.3389/fpsyg.2013.00770PMID: 24167495