,« •fÎzn·«
*^*ί «г ·' Й- ІМ 'S»«»!- Vtoto*» «toto>Щ': r Ue*^ e i! “i'ïïS 'i ^wto. *' i». .3Ч ^ ^жш n s T л л т S ü b m l t i ->:r г * f í -^ . И|^< «¿i Jt M 'WD 4a to kl' W t» ú 4to<^ t o t h s D e p ? j " t e s r ^ t c 4 S c o í r i s r r s ’ ü í •■-I (Гй‘‘? Р.г^.іЛ.гЛ'-Г··«-'’·W й 4*-. Ч > -W · й to ·-..■ - to to W ¿a- ^ ^ J i>' 4toJ " W ' ' ·^^.-to.'v¿Já ' Ч)·»* — . W - to ■<■‘^* ;■■··,-■.
-··-.-L·/ 3 'Ί* P f r.i">· ?^.·.*··^ Γ;·$- ■ /
^ a *гй «0 « “ 'а» W i* a to W к,гй ·4«»»Ί» %i 7
in Pas-^îlaî F u !îf3 5 :m e r/: Ы ^^^■зіліз’^ггізг/^з «>^ ^(» î|·^ ,·^ <fíj f»í ΐ/» ,-J^, ■·"'; '?» .
;r,-íJ to tí ». to. ·
' <to^ ¿ v*<' '<tto*' e sí ''^y* ' .Λ·'
EVALUATION OF THE OOLDFELD-QUANDT TEST AND ALTERNATIVES
A Thesis
Submitted to the Department of Economics and the Institute of Economics and Social Sciences of
Bilkent University
In Partial Fullfillment of the Requirements for the Degree of
MASTER OF ARTS IN ECONOMICS
by
Kerem Tomak
0 0 2 3 9 9 9
ÖH
I (Ч'ГІ.іГу llial. i lia.ví' lívi.d ibis Uk'sÍs and in my opinion il is Γη11\'
a.do(|iiat(p in scopí' and in (|ча,!ііѵ\ a,s a. ilu'sis ioi' Ιΐκ' d(\f.!;i4‘(' of iVla.sUn' of /\rls in Kroin.nnics.
1 Г('і‘1і1у iJia.l 1 liava' roa.d this llu'sis and in m\' <;»рІ!иі.мі il is (nlly a.d(a|iiai(n in s(s.)p(' a.nd in (jiialil.y, as a t.Iusdis ioi' (In' (l· уі('(М)І ¡\!asi(‘r <d Arts in iV-.onomics.
1 (Чп/ІіГу llia.l I hav(' i<'ad ihis lli<\sis and in my opinion ii, is· lidl\· ad('(|ua.l(\ in s('op(' and in (jnalily, as a Un^sis lor l.lio (Іооіч.м'o! Ma. li·!· -d Ai'ls in ICconomics.
¿ S ' ...
Assordd-oi. I )i·. dv n<l іУд\)Ік)коі()\\'аІ:і
' idl·ΐñ^ Л|)річ)ѵчч1 by ll)(' lnsli(.iil(' ol Scxna.l a.nd ¡'/(‘onoiinr Scicm os Dircs'Un·;
<dM=a-A B S T R <dM=a-A C T
KI'.KRM ^ГОМЛК МА ill Economics
Supervisor: Prof. Dr. Asad Zamaii June 1994
In this study, the widely used Coldfeld-C^uandt test for lieterosk('da.sticity in the linear regression model is evaluated. VV(' reduce the dimension of the data spa.ce that is needed lor tin' computaticui of tlu' t('sts. VVe tlu'ii compa.r(‘ the pi'rformaiK'es of tin' Likelihood Ratio and tin* Cloldh'ld-C^uandt tests by using stringency measure. The problem of analytically non-tractable distribution function in the case of the Likelihood Ratio test is overcome by employing Monte Carlo methods.
It is observed that the Likelihood Ratio test is better in most of the cases than the Goldfeld-Quandt test.
Key Words: Ileteroskedasticity, linear r('gr('ssion model, Coldfeld-Quandt test, stringency measure. Likelihood liatio test, Monte Carlo methods, Kullback- Liebler Distance.
Ö Z E T
KEREM TOMAK
Yüksek Lisans Tezi, İktisat, Bölümü Fez Yöneticisi: Prof. Dr. Asa.d Zaman
Haziran I 99d
Bu çalışmada, doğrusal regresyon modelinde heteroskedastisite durumu nun test edilmesinde sık kullanılan Goldfeld-Quandt testi değerlendirilmektedir. Testler için gerekli veri uzayının büyüklüğü azaltılmıştır. Daha sonra Like lihood Ratio ve Coldfeld-Quaiidt testlerinin performansları sıkılık ölçüsü kullanılarak kanşılaştırılmıştır. Likelihood Ratio testi hesaplanırken anali tik olarak yazılamayan dağılım lönksiyonu problemi. Monte Carlo metodları kullanıl arak çözü 1 m üş t ü r.
Hemen hemen bütün durumlarda Likelihood Ratio testinin Goldfeld-Quandt testinden daha iyi olduğu gözlemlenmiştir.
Anahtar Kelimeler: Heteroskedastisite, doğrusal regresyon modeli, Goldfeld- C^uandt testi, sıkılık ölçümü. Likelihood Ratio testi. Monte Carlo nu'todları, Ku 11back-Liebler Uzaklığı.
A ck n o w led g em en ts
I would like to express my gratitude to Prol'. Dr. Asad Zainan for his inspiring and valuable supervision, his patience and for teaching me the sub ject.
I also would like to thank Assoc. Prof. Osman Zaim and Assoc. Prof. Andrzej Sokolowski for their valuable comments.
Special thanks go to Professor Sydney Afriat who convinced me about the necessity of completing a work started and to Professor Seinih Koray who introduced me to the world of Economics.
I also thank my family for their understanding and care during the hard and sometimes frustrating learning period and Fethiye Akbulut for her valu able help during the literature survey.
C o n te n ts
1 I n tro d u c tio n
2 S ta tis tic a l an d E co n o m etric B ack g ro u n d
3 T h e G o ld feld -Q u a n d t T est
23
4 T h e M odel 26
5 T h e P ow er E nvelope 31
6 T h e L ikelihood R a tio T est 32
7 A lg o rith m 8 E x am p le 9 R e su lts 34 37 40
1
I n tr o d u c t io n
The linear regi’ession model is the most frequently employed way of describ ing and analyzing data, and making predictions in economics, statistics and various other disciplines. Due to this popularity, as it is in other ’’popular” methods, it is commonly used in cases where its main assumptions are not satisfied. Very often certain predictions are made and prescriptions written for data at hand, which have very little, if not at all, to do with the real life.
” ... As a consequence, recent years have witnessed a remark able growth of interest in testing - rather than estimating - econo metric models. While it took more than a quarter of a century for the first serious article on testing to appear in Econometrica (the Chow test in 1960), the predominance of testing among articles in theoretical econometrics can hardly be overlooked in more recent volumes. In the 1980-1984 jieriod alone, about fifty articles and notes appeared with a focus on testing econometric models.” [13]
The disturbance structure of the regression models has been studied at length for a long time. Tests for normality, homoskedasticity and indepen dence of disturbances and ways to overcome the difficulties caused by the
existence or non existence of such concepts have been suggested and dis cussed in the literature and textbooks.
In our study, we will conc(iiitrate on one of the rnisbelmviours, namely heteroskedasticity of the error terms in the linear regression model. We are familiar with the standard regression model:
yt = /3'xt + ct,
where for t = 1, 2, . . . , T , yi cLve scalar observations on the dependent variable, ¡3 is K x 1 vector of unknown parameters, Xi is a /C x 1 vector of the regressors, and Cj is the unobserved error term. The problem of het eroskedasticity arises when the errors have different variances so that Cj are independent but not identically distributed: tt ‘ N{0,a'}). In this case, while the OLS estimates are consistent, they fail to be efficient. A more serious problem is that the usual regression statistics t and /'’ are biased.
The first step in solving problems posed by heteroskedasticity is of course the detection of heteroskedasticity. For this purpose Goldfeld and Quandt suggested a test which has proven to be very popular and is widely used in applications today. Our goal in this paper is to suggest that this test is seriously deficient and to suggest improved alternatives and study tlie performance of these tests by Monte Carlo studies for a number of models.
2
S t a t is t ic a l a n d E c o n o m e tr ic B a c k g r o u n d
In this section, we will follow the standard statistical definitions and theorems which can be found in any statistics tcixtbook (s(ic for cxami)lo, [9]). A considerably large portion of econometric theory is devoted to the study of how a certain variable yt is related to the values of some other variables Xi. The following relationship is central in many studies:
Vt — i ^2ti · · · 1 h)l /, 1, 2, . . . , /
If T is taken to be sufficiently large, and several of the variables are observed, we can estimate the function / . Hypotheses regarding the form of / is the goal of many econometric studies.
Throughout the text, we will employ the following model:
yt = Pixu + ^ 2X2t + ■ ■ ■ + PkXkt + ^t for / = 1, 2, . . . , r
In matrix form, we can write the above model as follows:
y = X fi + e
where j/ is a T x 1 vector of observations on the dependent variable, X is a T
X
A: matrix of observations on the independent variables, /? is a A: x 1vector of unknown coefficients, cuid e is an unobserved error term. Following assumptions about this model are standard:
1. €t are normally distributed, ~ (0,cr^/7’)
2. C( are independent,
.3. tt have zero means and equal variances (homoskedasticity oi the errors).
4. the regressors Xfu are independent of the error terms C(.
Under these assumptions, our model is called the linear regression model under the fully ideal conditions.
The implicit assumptions here are thcit the regression parameters do not changeover time, that there are no measurement errors in x, that all relevant regressors are indeed included in the equation, and that the relationship between the dependent and the indei)endent variables is indeed of a linear form. None of these a.ssumptions is obvious in most applications, and the tests to be discussed in this study are supposed to determine whether in a given situation they hold or not [13].
The main concern of a regression problem is to estimate the parcimeters (3 and cr^ and under the fully ideal conditions, these estimates are called the maximum likelihood estimates. Assuming that X '‘X is positive definite, the
unique solution for /9 is given by
0 = { x ‘x ) ~ ' X 'y
where E = 0 and c o v0 ) = <r^ (X^X)~^ . The following definitions are in order:
D efin itio n 1 A 71 estimator g is said to be unbiased for 0 if E (g) = 0.
D efin itio n 2 If g is an unbiased estimator and it has the minimum variance in the class of unbiased estimatoi's, g is said to be an efficient estimator.
D efin itio n 3 Suppose that 9n is the estimator of 0 based on a sample size of n. Then the sequence of estimators On is called a consistent seq'uence if
lim P ( On — 0 < e) = 1 I—>-00 \ /
The modified minimum variance unbiased estimate of a'^ is given by:
^MVU
T - K y - A7^
The densities of these estimates are given in the following theorem:
T h e o re m 1 The maximum likelihood estimator's /3 and are independent with densities P '^ N ^/9, cг^ mid T a ^ ~ Xr-k·
Following facts are used in the proof of this theorem and we will also use them in our computations:
1. The notation CYx'j^ is used to denote tlie density of a clii-square random variable after it has been multiplied by the scalar a. We Sciy that Z luns a Gamma density with parameters p and X (Z G{p,X)) if
f (z) = ·
In this notation, the chi-square density with p degrees of free dom, Xp is the same as G '(p/2, 1/2) and the scalar multiple ax^ is the same as G ( p /2 ,1/ ( 2«)) . Thus the theorem states that ~ G { { T - k ) t 2 , l H 2 a ^ ) ) .
2. U Y = A X + b then Y ^ N{Afx + b, AYA^ ) .
3. If Y — A X and Z = B X and A Y B ' = 0 then Y and Z are independent.
4. If = 0 and E = I and M is an idernpotent matrix, then Y = X ' M X ~ X^, where k = trace{M).
D efin itio n 4 Suppose that we observe random variables (X , Y) with joint distribution (x,y,0), and the distributio7i o f Y \ X does not depend on the parameter of interest 0. In this case, we say that X is sufficient for 6.
We can describe the hypothesis testing problem as follows. For the ob servations V that come from a family of distributions p ' {y.,0), indexed by the parameter 0 G 0 , the null hypothesis JJq is that the parameter 0 belongs
to some subset 0q of 0 , while the alternative is //] : 0 G Qi, where 0 i is a subset of 0 not intersecting with 0o· If we reject the null when it is true, this is called a type I error, while accepting the null when it is false is called a type II error. The probability of rejecting the null when the null is true is called the size or the significance level of the test. The probability of not making a type II error is called the power of the test.
The Neyman-Pearson Theorem describes the test of maximum power for any given size:
T h e o re m 2 Suppose that the densities of the observation Y under the null and alternative hypothesis are Hq : Y ^ (2/)^o) o,nd H\ : Y ^ {y,0i). Fix a > 0. Then there exists a constant Ca such that
P { N P { Y ) > c , P Ho) = a,
where NP{y) - Dejinc hypothesis test S* {y) by 6* (y) = 1 if NP{y) > Ca and 6* (y) = 0 if NP{y) < c„. Then this test has size a and if S' {y) is a different test of smaller or equal size, then S' has power less than the power of S*.
Neyman-Pearson Theorem provides a complete solution to the hypothesis testing problem in the case of a simple versus simple hypothesis.
The concept of stringency measure is an important milestone in com paring the advantages of two hypothesis tests. We will use this entity in comparing various tests with each other so it is suitable to explain what it means and for that purpose, the following definitions are used throughout the text. Let X be an observation from a parametric family of densities / (a;, 0). Suppose we wish to test Ho : 0 ^ 0qv.s. the alternative Hi : 0 £ & i. Let 1' be the set of all hypothesis tests or equivalently, functions mapping X to the unit interval [0, 1].
For any test t E T, define R{t , $) to be the probability of rejecting the null when 0 is the true parameter. Then, the level (size) of the test Ij{L) is defined to be the maximum probability of type 1 error:
L (¿) = sup a (¿, 0) o'eeo
Let To be the set of all tests of size cv. For any 0i G 0 i, the maximum possible power any test of size a can attain is given by the i)ower envelojK' ft* defined as:
/j;№ ) = sup R { T A ) TgTa
It is convenient to define the deficiency of a test to be the negative of its maximum shortcoming:
The shortcoming S of a test 1' G 7« is mecisured with reference to fj* (·):
S { T ) = - sup R{T, 0i ) Oieei
The deficiency of a test is the largest gap between the power curve of a test and the maximum possible power. The smaller the gap, the better the test. We will use the term stringency of a test for the negative of its deficiency.
D efin itio n 5 A test having the largest possible stringency in the set Ta is called a most stringent test of level a for testing Ho against H\.
Having set a common ground for our analysis, it is now the time lor explaining what heteroskedasticity means and how the previous work on detecting it evolved.
Heteroskedasticity problem arises when the error terms do not have con stant variance for each observation in the regression problem, unlike one of our assumptions, namely homoskedasticity cissumption, when we set the fully ideal conditions.
In that case, the cov{^) = E 7^ cr^I. Thus although P is still unbiased and consistent, its covariance matrix is now:
cov (j5) = i^ X ^ X y ' .
It is clear that one will make wrong inferences if he assumes that S = <τ^I. More than that, it is known that there are more efficient linear estimators when E 7^ rr^I.
A common example where heteroskedasticity is observed is the linear regression model where the dependent variable y represents consumption expenditures and the independent variable x represents income for several families. In this problem, if we estimate the problem by OLS, the residuals will be larger for larger values of x. Thus the error variances will not stciy constant but increase with the value of x.
The consequences of heteroskedasticity are seen primarily on the least squares estimators. It is shown [15] that in the case of heteroskedasticity, the least squares estimators are still unbiased but inefficient. It is also shown that the estimates of the variances are akso bia,sed, thus invalidating the tests of significance. Thus it would be the case that under heteroskedcvsticity, we would get lower estimates than the true variance of the OLS estimator and our confidence intervals will be shorter than the true ones. Hypothesis for the regression coefficients would also be affected by this problem.
There have been various studi(is on testing for heteroskedasticity. Tlie study of the presence of heteroskedasticity had mainly two directions. One direction led to only stating whether there was a problem of heteroskedas ticity or not. Goldfeld and Quandt [7] named the tests suggested for this purpose as nonconstructive. The other direction also involved estimation by stating the form of heteroskedasticity. In our work, we will deal with the first direction and study the performance of the Goldfeld Quandt (GQ) test and try to suggest better alternatives.
A number of authors have studied the performance of the Goldfeld Quandt test under different forms of heteroskedasticity.
Evans and King [4] have recommended a new test and found that their suggested test was generally more powerful against medium and severe het eroskedasticity whereas the King and Szroeter tests performed better against weak heteroskedasticity.
They employed the linear regression model and toasted //o : E = /„, vs. //i : E ^ In- They study tlie form of heteroskedasticity given by
= h{z[a), i = 1, 2, . . . , n
and they restrict the case to s = 2 in which af can be expressed as a kih power of some linear function of exogenous variable. They propose to reject
Ho for small values of the statistic
s(A*) = iT S -' (A*)u/u'u
where u is the GLS residual vector assuming covariance matrix E(A*). They assert that this test corresponds to the LR test against the alternative A = AT
In their experiments, they employed 9 different sets of data, 3 of which were artificial and the rest are real economic time series data. Tht\y ordered the regressors according to increasing values of the postulated deflator vari able. They found out that against moderate or severe heteroskedasticity, tests based on OLS residuals alone were generally inferior. They also stated that
’’...the OLS based tests, the Harrison and McCabe and (¡old- feld Quandt tests perform poorly because they largely ignore the form of the heteroskedasticity.”
In another paper [5], they consider the problem of testing for het eroskedasticity in the linear regression model when one is willing to postulate oidy the ranking of the disturbance variances under the alternative hypoth esis. They have compared the powers of various tests for heteroskedasticity of a given form. They computed the power of the GQ test by omitting 3 central observations for a sample size of 15, 4 for 20, 8 for 40 and 16 for 60.
They found out that the GQ test was better than Breusch and Pagan test and Harrison and McCabe test but worse than Szroeter and two other Evcins and King tests.
Ali and Giacotto [1] asserted that the power of tests can be improved with the OLS residual estimates, the increased sample size and the variability of the regressors and it can be substantially reduced if the observations are not normally distributed. Each test that they studied was optimum to detect a specific form of heteroskedasticity. They also pointed out that a serious power loss might occur if the underlying heteroskedasticity assumption in the data generation deviated from it.
They carried out Monte Carlo experiments for power computations using 1000 replications. They performed the majority of their experiments with the following model:
Vt = + / A - i - ' i i + Ui
where they set Д) = (i\ = 1 (among all the authors that we liav(' survciyed, they were the only ones to set e(|ual regression coefficients across the two sam ples and they used this information for all the test statistic computations). They used 6 different data sets, three of which were stationary and the rest non-stationary. They experimented with 6 types of heteroskedasticity which
had the following structure:
(-Vv).
They considered four distributions for Ui's. Finally, they experimented with three sample sizes: 10, 25 and 40 and three residual estimates, OLS, Recursive and BLUS.
Harvey and Phillips [8] proposed an exact |)arametric test agciinst het- eroskedasticity in the general linear model. They compared its power with Goldfeld Quandt and with BLUS. They found out that under a variety of circumstances all three tests were of comparable power. They employed two forms of heteroskedasticity and in their computations they used one variable for determining the variances of the disturbances and (an)other variable(s) for the constant term. They generated the variable associated with the dis turbances once from a uniform and another time from a lognormal distribu tion and they kept the sample size at 20. They computed the powers of 3 tests including the Goldfeld Quandt test at the 5% significcince level. Th(;y concluded that Goldfeld Quandt test was the worst among the three.
Griffiths and Surekha [16] found out that Szroeter’s asymptotically nor mal test outperforms the Goldfeld Quandt test, the Breusch-Pagan Lagrange multiplier test and BAMSET, when it is possible to order the observations according to increasing variance. With no prior information on variance
or-deriiig, they concluded that BAMSIid' is the best, ddie highlight of their analysis was on the problem of ordering the observations according to in creasing variances. They stated that when the observations are not ordered according to increasing variances, Coldfeld-Quandt, .Szroeter and BAMSI'jT tests loose their perlorinances and BAM.Sl'iT is the Ixist among th(' thiec'. Their findings de.serve considerable interest for further studies on the other problem that we have side stepped, namely assuming strong prior informa tion before calculating the GQ test. They set the regression coefficients to be different throughout their experiments and they used a linear regression model which included a constant term. They set the dimension of the regres sor space to be equal to 2 and they considered two types variance structures referring to two types of heteroskedasticity, namely additive and multiplica tive. They estimated the power of the tests by calculating the proportion of rejections in 5000 repliccitions at a 5% level of significance.
Kadiyalaand Ob('rh(dman [12] sugg('st(id new t('sts for h('t('rosk('da.sticity which w(M’(i moi(' favorable'and tlie^y also (|iiot('d IVom Tlxdl that ”th<^ Gold- feld Quandt test’s u.se of the hiast squareis reisiduals based on two sc'parate subsets of the n observations implies that the analyst sacrifices twice the k degrees of freedom necessary to estimate the parameter vector, p. Thus it seems plausible that when it is assumed to be known that the two subsets have the same parameter vector, the power of the tests can be improved by taking this knowledge into account” . But they still assume that the a;’s
have been ordered in an ascending way and I,lie disturbance variance changes monotonically with one of the independent variables or with a linear combi nation of them.
In general, we see that under different forms of heteroskedasticity, al though Goldfeld Quandt is easy to compute - even without iiny computer work - it is deficient. Due to computational inefficiency, until now, there has been a tendency toward ecisily computed and at the same time more efficient tests for heteroskedasticity.
Almost all the authors cited above, have ignored the additional assump tion of equal regression coefficients across the two samples and ignored the information contained in that assumption.
3
T h e G o ld fe ld -Q u a n d t T e st
The basic situation envisaged by Golcll’eld and Quandt is as follows. Suppose that we an; sonudiow able to order tlie ob.s(;rvation.s so that the variances arc; increasing: erf < aj < ... < a]·. GQ suggest tliat we sliould choose T\ and such that 1 < Ti < T’2 < 2', and divide the scunple into two parts as follows. Define ya,yb to be the T \ x l and (T —T2 + I) x 1 vectors ya — (j/1, 2/2, ■ · ■ lyTi)' and jjb = (2/72, · · · yr)' ■ bet Xa and AT be 1\ x K and (7" —7'2+ 1) x A" inatric.es of corresponding values of the regrc-;ssors and f.„ and Cf, be the corresponding error vectors. Define ¡3a = {^a^a)~^ ^aVa and ¡3b — {XlXb)~^ ^bVb and let s s m = J/a ^a/3a and S S R l = yii — XbPb be the sum of squarcid residuals for each half of the sample. While T\ ^ T ! ‘l and T2 T\ + 1 are reasonable valuers, G L· Q propose omitting a few observations from the' middle to increase the;contrast betw(;en the; variaiic(;s in the first half of the' sam])le and that of the last half of the sam|)le. 7’hc;y suggc;st that wc' should r(;j(;ct the; null of homoshedasticity for large; value's of
s s K U k
This is an exact test since the GQ has an /'' distribution with li) = 1' — (Ti — K ) and ta = Ti — K degrees of freedom under the null.
Two major sources of information are ignored in the GQ procedure. Tak
ing these sources of information into account should improve the test. Our goal will be to study the extent of improvement that is possible.
The first information is that the regression coefficients are the same on both halves of the sample. In estimating separately on each half of the regression, we are effectively using only half of the sample. This is obviously a major loss of information and will seriously reduce efficiency of estima tion for ft. Furthermore, this loss will persist in large samples, so that even asymptotically the efficiency of estimation will be ini|)aired.
The ability to order the obs(;rvations in order of increasing variance pre supposes that we have some information about the source of tlie variancxc Without such information it is impossible to order the observations in the manner required for the test. In applications, this information is nearly al ways in the form of some regressor say Zi and the GQ procedure is applied. It seems obvious however that if we have information about the source of the heteroskedasticity utilizing this information will also improve the testing procedure. This then is the second major source of inefficiency of the GQ test.
In our research we propose to isolate these two effects and study them separately since each problem has to be tackled in their own ways. Ordering the observations according to increasing variances attracts further investiga tion since it is by no means informative to accept some phenomenon before running the tests and draw conclusions out of these. But for our purposes,
we will side step this problem and focus our attention to equcd regression coefficients across the two sarni)les case.
Consider the regression model separately on the two lialves of the sample:
Va = + ^ai Vb — ^ b P b +
^b-Assume the e„ ~ N {0,allri) and to ~ It-T2+\)· Zarnan (1994)
shows that the Cloldfeld-Quandt statistic provides a UMP invariant test for the hypothesis Hq : versus the alternative Hi : al < a^. This
situation differs substantially from the one studied by Goldfeld and Quandt where the regression coefficients and /3b are assumed to be different so there is no loss of information from not utilizing information relating to the source of change of variances.
The power of the Goldfeld Quandt test can easily be obtained from tables of the F distribution. Let _a = crUal as before. Define GQ — ( t aSSRl ) / {tbSSR/^). Then aGQ has an F distribution with ta and tb de grees of freedom. Choose c such that F { G Q > c ) = 0.01 for exainph'. Then the power of the level one percent test is obtained by calculating P {GQ > c I a) -- P{ aGQ > nc) . 'rids last i)robability is a tail ])robal)il- ity of F{ta, tb) and can be looked up in an F table.
4
T h e M o d e l
In this section we propose to study the elFect of adding tlie inlbrination that ba = fth- 111 lh.ct, th(i (¡Q proccxiure is widely usetl in applications whei'c this assumption is maintained, that the regression coefficients are the same across the two subsamples. It appears likely that utilizing this information will provide a test superior to the Goldfeld Quandt. We propose to study the amount of the gains available by coin|)aring the power of CQ test with the likelihood ratio test using Monte Carlo methods.
.Sufficient statistics for the model are S S R \ ~ SSR ^ ~ (^IXib in addition to the OLS estimates ~ Af cr^ and also ^¡, ~ N (^/3t,,crl {XlXb)~^^· The GQ test is based on the ratio ta S S R l I t b S S R ^ which is effectively a ratio of th(i estimates of the a'l and However, when
— /i//,, additional information about tlie variances can be obtained by looking at A = fi, -
fh.
Then A ^ /V (o,<7;i (A7.AT)"' + cr'i (X ^W )"') · This can be simplified further as follows:Let P be a nonsingular K x K matrix such that PP' = (X'Xa)~^ so that P-1 P '-i = Ik. Then if 0 = P " 'A , we have 0 -N (o^ctI Ik + cr^P"' {XlXb)~^ P'~'^ . Let Q and A be the orthogonal and di agonal matrix of eigenvectors and eigenvalues of P “ ’ (A^,'AT)” ' P'~' so that
Let '0 - Q~^0. Then we have 0 ~ N {0,al + o’^A) where A is a diagonal matrix. Thus in addition to SSRf^ ~ R ixii S S R l ~ crlxlb we liave the following information for i = 1, 2, . . . , K
■^l>i ~ (<^a + '^6^.') x'i>
where all of these are independent of each other and also of and SSK l-The value of this additional information depends on the Aj.
L em m a 3 A,· are eigenvalues of the matrix Xf Xa{Xl Xb) ~' ·
P ro o f. By definition, since A is the diagomil matrix of eigenvalues of A ■ P “ ' the roots of the following polynomial yields the diagonal elements of A :
det (aI - {X'bXbV' P'~') = 0
multiplying by (let {P) from tlu', left ¿iiid by (let [P') from the right yielcLs:
det (P A IP ' - P P - i {X'bXby^ P'~^P') = 0 det ( A i ( A - x „ r * - ( ; ( ^ X 6r b = 0 det [ M - { X ' M { X ' b X b V ) = ^
So that A has the eigenvalues of X'^Xa (^b^b)~^ on its diagonal. □
Now, the joint density of (/)* = -tiyf/SSKl, i = (/'/c+i S S R l / S S R l and = ' 9 6 ' will be calculated.
T h e o re m 4 The joint density of-ij)* = i/yflSSRf^, i = i/’a + i — S S R l f S S R l and i/'/<+2 — •5''5'-Ra
f'^ (2/i>2/2, · · · ,Ул'+ь«) = ^ T i - \
1/2
1 + (уА'+i/cv) + E '/л*/ (« + ^¿)
¿=1
Proof. For the proof, set
\/· 2 2 _ ' f ^ ^
~ Vu. = T ’2ct;7 (
1
)where a'f = aj + сг,^Л,· for г — 1, 2, . . . , Л' and crf^i = cj, егд·^^ == cr'^ with n,· = 1, for г = 1, 2, . . . , К, пк+\ = ta, пд-+2 = tb. In the context of our first model, Xi — i = 1, 2, . . . , K , and Х к +i = SSKf^, Xk+2 = S S И^.
Now, transform these variables as follows:
Yi = XilXi<+2. i = i , 2 , . . . , K + l Гл-+2 = ^л'+2
The inverse transformation is:
Xi = YiYK+2, ¿ = l , 2, . . . , / f + 1 A^C + 2 = ^A'+2
and the Jacobian of this transformation is:
J = \Yk+2\‘^'+'
By 1 and facts from the second chapter, the joint density of X
f ( x „ x „ . . . . x „ , ) =
n
2a f V( n, / i ) “ P 2cr? Thus the joint density of the transformation is:r [Vx.yi.···. Vkvi) = n {-yiyi<+2l2af) x ¿=1
X |2/k+2|^'·*·’ exp(-yK-+2/ 2(j|)
Now, we luied to calculate / p ' (i/i, 2/2, · · ·, yk+2) ^^2/A'+2· Bor that purpose, we make the following change of variables: vy/v+i = 2 a p . d'hen.
<Xj
I P '
(yi>
2/
2, · ·
-,yk+2) dyi<+20
= f P ’"u ----e x p ( -2/iZ(T6VcTj^) X |2crii2:|^' + ‘ x e x p (-; A'+l
= / 0^ ‘W ^ {zy^l af p' ' "-' exp i - z ( 1 + E y ./ ^ n 1 d2T
where af = crfieri.
A '+ l
Now, we make the following change of variables: For /1 = 1 + E t=l
set w = z * A. Then, ^ ■ dz, cuid
r n' i
exp I +e
‘
V i RI I
i z1=1 ¿=1
= /(T 'n '
T, {w V ilA a tr'l‘‘-'
X exp ( -« ,) fz = 1 »
But then, taking out the constants and ti;-independent terms, we have
C n ' i ( w y t/A a R ·'^ - ' X e x p (-te ) (u,/A)‘+'+“ /*-· i=l
yitb+k/2
/o°°
X exp(—tu)(i'(.o
A'+l ^
n
/R)
~AirpITiir V {Lh + A7‘2) (2) So that.* n 1/ (V’.· (a +
(pi,!/2, . . - , yK+i , a) = — ^ ---n i73+ S ~ '’ ( '* + + (;!/K'+l/« ) + '(/’*/ (fV + A;) j
5
T h e P o w e r E n v e lo p e
As argued in Zaman (1994B) tests can be evaluated effectively using the stringency measure. In order to measure stringency, we need to calculate the power envelope. Since the problem is scale invariant, it is convenient to define cv = CT^Icfl and calculate the envelope for Hq : a = I versus the alternative
II\ : fv > 1. I'or a fix(id (■>>!, tlui |)ower of tlui Neyman- Pearson test giv(>s th(! maximum possible ])ower attajiiabhc TIu' Nciyman-Pc'arson test for this scale invariant situation is calculated as follows:
The Neyman-Pearson most powerful test for Hq : ot = I versus H\ : a = Qi > 1 rejects for large values of the statistic, after dropping the constants.
N F P ' {y
I
F (i/ I 1)where F calculated in the |)revious chapter (2). From this, it is easily seen that the Neyman-Pearson test rejects for large values of the following statistic;
/i'+ l
xj,·
1 + E 6 '=
-A'+l
Plotting the power of these tests for different values of ai will generate the power curve.
6
T h e L ik e lih o o d R a tio T est
In addition to coiri|)aring the CQ test to tlie power envelope, we also wish to compare the likelihood ratio test to the power envelope. To compute the likelihood ratio test, we need to obtain the ML estimator for o·. The first order condition for a maximum of the joint log-likelihood function (computed in the previous section) can be written as follows:
n,/2 (c r-f Ai) K + l
E
„ ,
J < \it',
V.· E ^ i = l(3)
where n,· = 1 for i < K\ = 0, and n;^-+i = tb.
This equation can be solved by standard root finding procedures to obtain ML estimate a.
Once we have the ML estimate, we can obtain the likelihood ratio statistic by plugging this into the likelihood ratio. The log-likelihood function for the data can be written as:
/(,/-·,« ) = c + E ( t - E ( f ) 1.1 (a + AO
From this, the likelihood ratio statistic can be written as
The distribution of this is not tractable, but can easily be obtained by Monte Carlo. Similarly, we can trace out the power curve of this test using Monte Carlo methods and obtain stringency by comparing the power with the power envelope.
7
A lg o r ith m
The computations were based on the parameters K , la, tb and A chosen as follows:
First, A was fixed at a 1 x K vector of ones. Then, K was fixed at 4, and 6 where the corresponding values of la and ib were adjusted according to the formulas T = 2 * (A" + la) and la = tb. The sample sizes T were chosen to be T = 20,40 and 60. The main focus of the computations was on the form of the A,’s and we experimented with different values. The more the difference of the A,’s, the more favorable LR test became. The experiments were held with Monte Carlo sample size of 5000.
For the computation of the power of the tests, we used two programs for the PC: Mathematica for Windows 2.2 and Gauss 386. In Gauss, the algorithms used to find out the root of the first order condition were bisection, secant, fixed point, false position and Newton-Raphson methods. Among these, the most edieient ones W(T(‘ s('c<uit and N('wton-Raph.son methods. In Mathematica, the computations took more tinu' than they did in Gauss but the results were more accurate due to Mathematica’s built-in facilities.
Overall time that is needed on a 486DX-33 with 8MB of RAM was around 2 hours with Gauss for the generation of a power curve of 10 points of the LR test with Monte Carlo sample size of 10000. With Mathematica it was a couple of hours longer.
The following cilgorithrn, outlined by Zaman [18], was used to compute the power of the tests (the algorithm is for the Likelihood H,atio Test compu tations. For other tests, just omit the part where the root finding procedures are called):
1. Set the values for /F, to, tb, X.
2. Set the significance level (to %10, %5, %1).
3. Set cv = 1 in order to generate numbers according to LR statistic under the null hypothesis.
4. Call GEN() procedure.
•5. Create random numbers with distributions specified in the model.
6. Call MLBIS [ML] [SEC] [MLA] procedure to calculate the ML es tim ate by finding the solution of the first order condition for the maximum of the log-likelihood function, by employing the bisection method [Newton-Raphson method] [Secant method] [Hooke and Jeeves method]. The last method directly maximizes the log-likelihood func tion.
7. Calculate the LR statistic.
8. Goto the 5th step until you reach the previously specified Monte Carlo sample size (MCSS).
9. Exit GEN() procedure which returns a MCSSxl vector of LR statistic values under the null hypothesis.
10. Sort the returned vector in an ascending incinner. If the significance level is %10, set the critical value index to be 0.90*MCSS. If it is %5, set the critical value index to be 0.95*MCSS etc.. The approximation to the real critical value is then the LR statistic value in the returned vector at that index level.
1 1. Set a - ?i, where n is the value of « at which we want to conii)ute the power of the LR test.
12. Repeat steps 4-9, where now, the GEN() procedure returns a M CSSxl vector of LR statistic values under the alternative hypothesis.
13. Calculate the number of times the elements of this last vector exceeds the critical value calculated at step 10 and divide this number by MCSS to get the power of the LR statistic.
8
E x a m p le
The following example is given by Maddala, [15], p. 165. The given data are the consumption expenditures (y) and income (x) for 20 families in thou sands of dollars. Maddala shows graphically (Figure 5.1, p. 161) that there is a heteroskedasticity problem. In order to apply the Goldfeld-Quandt test, he divides the observations into two groups of ten each. The first group is Xa = {22.3,12.1,6.2,10.3,8.1,14.1,16.4,24.1,18.2,20.1} and the second group is Xb = {.32.3,36.6,42.3,44.7,26.1,40.2,34.5,38,30.1,28.3} . The esti mated equations are:
Va = 1.0533 -k 0.876x·,.
Vb = 3.279 + 0.83.5.f6
where Rl = 0.985, R\ = 0.904, al = 0.475, al = 3.154. For this set of equations, F-ratio for the GQ test is 6.64 and it is significant at the 1% level thus we reject the null hypothesis of homoskedasticity. For the LR test, the estimated cr-value is 6.64, A = 0.2059 and the approximate critical values are 0.1753, 0.1982, 0.2384 for 10%, 5% and 1% significance levels. The value of the LR statistic is computed as follows:
1. Calculate A = ~ A = 0.041;
2. Compute {X'^Xa)~^;
3. Get the cholesky decomposition of the matrix computed at step 2,
which, for this example, is 0.019471068; 4. Calculate 0 = P " 'Д = 2.1056883;
5. Get Q and Л as the eigenvoictor and eigenvalue of P " ’ {Х'^Хь) P '~ \ which, again for this example, are 1.000 and 0.2059;
6. Finally compute ф = Q~'0 and divide by f{^. For our example, we got ф^ = 2.3293.
When you substitute these values into the LR statistic formula given in section 6 and use the estimated cr—value, namely 6.64, we get the LR statistic value, 1.04782. Thus LR, statistic rejects the null hypothesis of homoskcdasticity at all significance levels.
When the logarithmic form is considered, the estimated equations be come:
Da — 0.128 0.934.'C(j 2/6 = 0.276 + 0.902,T6
and lii = 0.992, Fit = 0.912, al = 0.001596, a'l = 0.002789.
In this case, F-ratio for the test is 1.75 and if we use the 5% significance level, we do not reject the null hypothesis. But if we consider the LR test, estimated o:—value is now 1.75, 0 = 1.6435, V’* = 1.8020, A is the same, the critical values are 0.1764, 0.2009, 0.2331 for 10%, 5% and 1% significance levels respectively and the value of the LR statistic is 0.6089. Thus LR test
still rejects the null hypothesis whereas GQ test does not reject it at 5% significance level. We calculated the approximate critical values for the LR test by running Monte Carlo on the ·)/)* variable in our model with a Mont(' Carlo sample size of 10000.
9
R e s u lt s
As we have stated earlier in the section on Goldfeld-Quandt test, there are two difficulties one of which is the ordering of the observations according to increasing variances under the alternative. In order to avoid this, we transformed this problem so that we only study the effects of the maintained hypothesis that = /^6 on testing the null hypothesis Hq : = crl versus the one-sided alternative Hi : a j < al. In this case, the difficulty of ordering tlie observations does not arise since the variances are not correlated with any other variable.
Once we reduced the number of difficulties that we faced from two to one, and the dimension of the data space from T x K to 1 x -f-1, we had to deal with Xi which are constants depending on the regressor matrices and which contain additional information. The number of different combinations of A; was too high so we first experinu'iited with supposedly worst, best and some intermediate cases. We kept the number of regressors at 6, sample size at 20, 40, 60 and 100 and changed a between 1 and 10 with step size equal to 1. As we employed a reduced form of the ])roblem, we only decilt with one ])ararneter a which sim|)lified tlui com|)utations dramatically. Alter we w(U(' convinced that the gains were actually possible in line with our intuition, we concentrated on a serious problem, namely the structure of the A,’s.
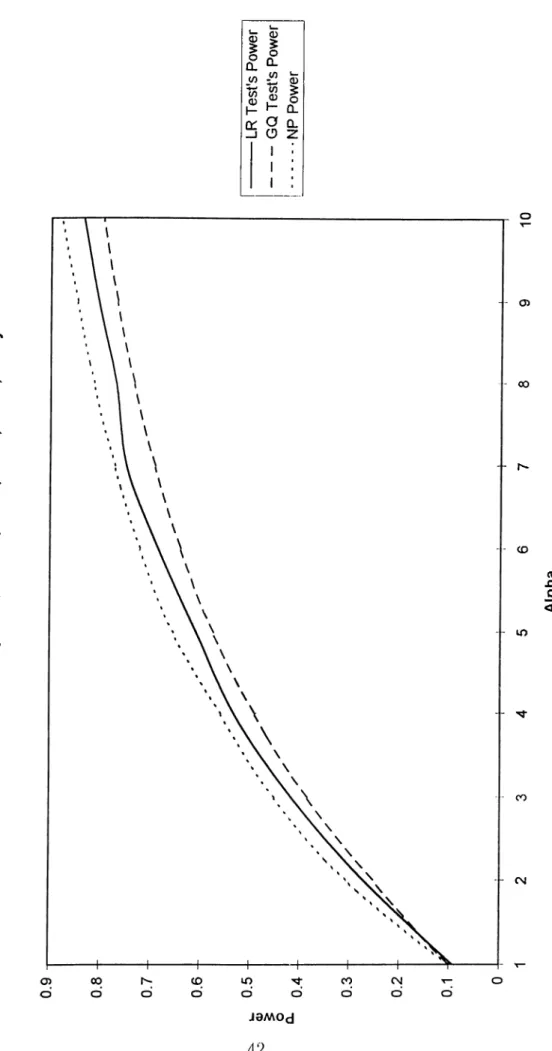
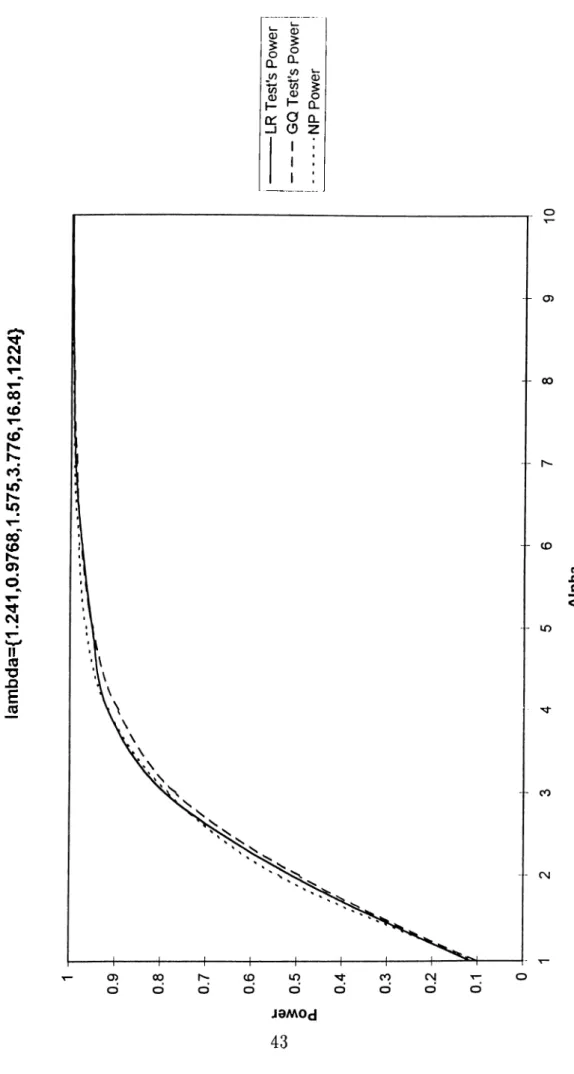
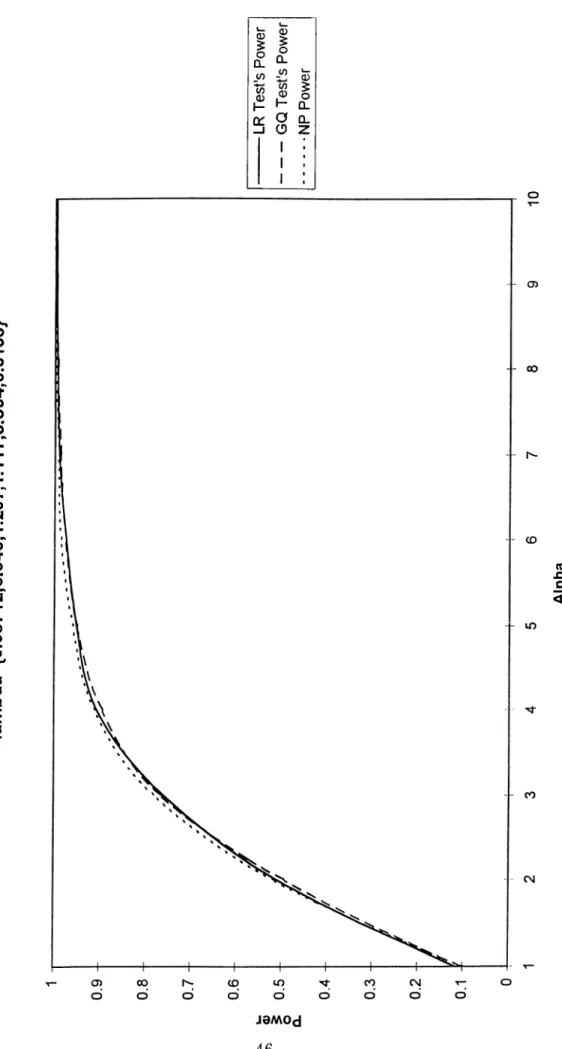
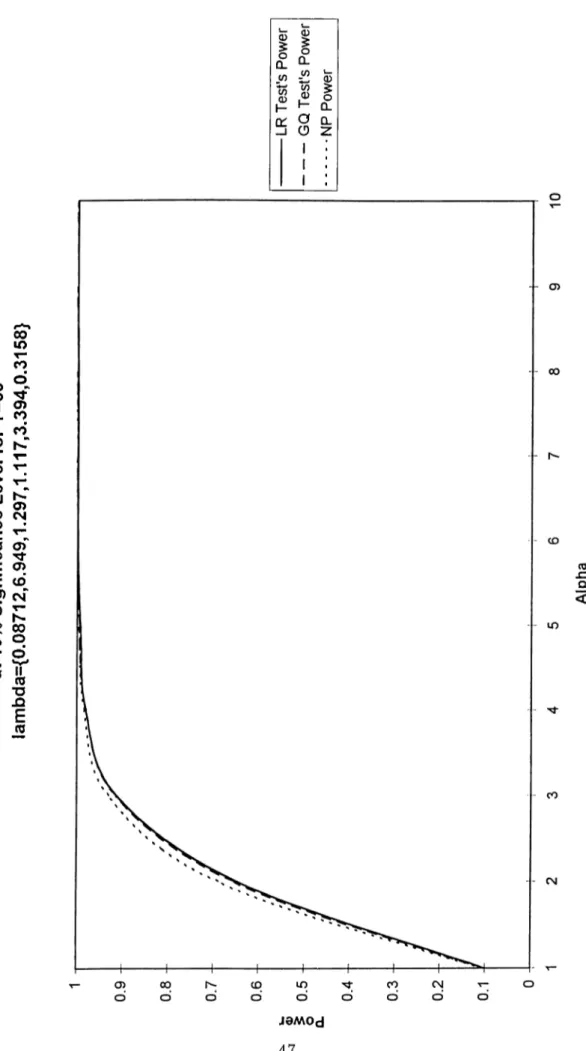
A,’s since it would tell us the conditions under which it would be reason able to use Likelihood Ratio test instead of Goldfeld-Quandt test. For this purpose, we calculated the Kullback-Liebler Distance to alpha from the null hypothesis. We generated random A ~ Af (0,1) /f / (0,1) and calculated the intervals that would correspond to different a increments. Then, for each new A set that is generated, we calculated the power curves, KL Distance and tried to find out the worst and the best cases out of 10 generations. The Figures 1-6 represent the worst and best cases that we encountered at this point. It is our finding that for A values that correspond to certain KL Distance intervals that we have calculated, one will end up with a power- curve somewhere between these two representative curves, i.e. A values that have the same KL Distance value will generate very similar LR power curves. Idius we conclude that Likelihood Ratio test’s ])ower is higher than Goldfeld- Quandt test’s power - although slightly at some ’’bad” configurations of A- and the gains from using LR test for heteroskedasticity wheir the structure of the A’s is studied, is of considerable intei-est.
F ig u re 1 . Ma xim um LR P ow er v s . G Q P o w e r a t 1 0 % Si gn if ic an ce L e v e l fo r T=20 lam bda={1.2 4 1, 0.9 76 8, 1.5 75 ,3. 77 6,1 6.8 1,1 22 4} -L R T e s t 's P o w e r --G Q T e s t 's P o w e r .. .. .. .. .. .. .N P P o w e r 5 6 A lp h a 1 0
F ig u re 2 . Ma ximu m L R P o w e r v s . G Q P o w e r a t 1 0 % Sig nificance L e v e l fo r T= 40 lamb da ={1 .24 1,0.9 76 8,1 .57 5, 3. 77 6, 1 6. 81 ,1 22 4} -L R T e s t' s P o w e r I --G Q T e s t' s P o w e r ! • N P P o w e r
F ig u re 3 . Ma xim um L R P o w e r v s . G Q P o w e r a t 1 0 % Sig nificance L e v e l fo r T= 6 0 lambd a={ 1. 24 1,0 .97 68 ,1. 57 5,3 .77 6,1 6.8 1,1 22 4}
F ig u re 4 . M in im u m LR P ow er v s . G Q P ow er a t 1 0 % Sign if ica nce L e v e l fo r T = 2 0 lam bd a= {0 .0 8 71 2,6.949 ,1. 29 7,1 .11 7,3 .3 94 ,0. 31 58 } ---L R T e s t 's P o w e r --G Q T e s t' s P o w e r ... ... ....N P P o w e r
F ig u re 5 . Min im um LR P o w e r v s . G Q P o w e r a t 1 0 % Si gn if ica n ce L e v e l fo r T = 4 0 lam bda ={ 0.08 712 ,6 .9 49 ,1 .2 9 7, 1. 11 7, 3. 3 94 ,0 .3 15 8} -L R T e s t' s P o w e r --G Q T e s t' s P o w e r .. .. .. .. .. .. . N P P o w e r
F ig u re 6 . M in im u m L R P o w e r v s . GQ P o w e r a t 1 0 % Significance L e v e l fo r T =60 lam bda ={ 0.0 87 12,6.949 ,1.29 7,1.1 17 ,3.3 94 ,0.31 58 } -L R T e s t' s P o w e r --G Q T e s t' s P o w e r .. .. .. .. .. .. . N P P o w e r
R e fe r e n c e s
[1] M. Ali and C. Giacotto, 1984, A study oT several new and existing tests for heteroskedasticity in the general linear model. Journal of Economet rics, 26 , 355-374.
[2] R.B. Davies, 1969, Beta-optimal tests and an application to the sum mary evaluation of experiments. Journal of the Royal Statistical Society B, 31:524-538.
[3] Jaysri D utta and Asad Zaman, 1990, What do tests for heteroskedas ticity detect?. Technical Rei)ort 9022, Center for Operational Research and Econometrics, üniversite Catholique de Louvain, Belgium.
[4] M.A. Evans and M.L. King, 1985, A point optimal test for heteroskedas- tic disturbances. Journal of Econometrics, 27, 163-178.
[5] M.A. Evans and M.L. King, 1988, A further class of tests for het eroskedasticity. Journal of Econometrics, 37.
[6] S. M. Goldfeld and R. E. Quandt, 1965, Some tests for homoskedasticity. Journal of the American Statistical Association, 60, 539-547.
[7] S. M. Goldfeld and R. E. Quandt, 1972, Nonlinear Methods in Econo metrics. North Holland, Amsterdam.
[8] A. Harvey and (1. I^liilli|),s, 1974, A comparison of tlu^ pow(n'orsonun,('sts lor heteroskedcisticity in the geiuiral linear model. Journal oj I'JconorncI- rics, 2, 307-316.
[9] R. V. Hogg and A. T. Craig, 1978, Introduction to Mathematical Statis tics. Macmillan Publishing Co., Inc., New York.
[10] C. C. Judge, W. E. Criffiths, R. Carter Hill, and Tsoung-Chao Lee, 1980, The Theory and Practice of Econometrics. Wiley Series in Probability and Mathematical Statistics. John Wiley & Sons, Inc., New York.
[11] M. L. King. A bounds test for heteroskedasticity, 1982, Technical Report 5/82, Monash University, Department of Economics and Operations Re- .search. Monash University, Australia.
[12] K. Rao Kadiyala and H. D. Oberhelman, 1984, Alternative Tests for Heteroskedasticity of Disturbances: A Comparative Study. Commun. Statist. Theor. Meth., 13 (8), 987-1001.
[13] W. Kramer and H. Sonnberger, 1986, The Linear Regression Model Un der Test. Physica-Verlag Heidelberg Wien.
[14] E.L. Lehmann, 1980, Testing Statistical Hypotheses. Wiley Series in Probability and Mathematical Statistics. John Wiley L· Sons, Inc., New York.
[15] Maddala, 1989, Econometrics. Macmillan Pub. Co., New York.
[16] K. Surekha and W. E. Griffiths, 1986, An evaluation of the power of .some tests for heteroskedasticity. Journal of Econometrics, 31, 219-231.
[17] Asad Zaman, 1994, Most stringent and best invariant hypothesis tests for regression models. Technical Report 94-06, Bilkent University, Ankara, Turkey, February.
[18] Asad Zaman. Shortcomings of tests for autoregression. Technical Report 94-04, Bilkent University, Economics Department, Bilkent University, Ankara, Turkey, January 19!^l·.