(REFEREED RESEARCH)
COMPUTER AIDED CONTROL OF CUTTING
ERROR IN TEXTILE PRODUCTS
TEKSTİL ÜRÜNLERİ KESİM HATALARININ BİLGİSAYAR
DESTEKLİ KONTROLÜ
Kerim Kürşat ÇEVİK
1, Hasan Erdinç KOÇER
2 *1
Ömer Halisdemir University Bor Vocational School, Niğde, Turkey
2
Selçuk University Faculty of Technology, Konya, Turkey
Received: 01.02.2017 Accepted: 12.04. 2017
ABSTRACT
At present, the audits about the cutting error of textile products (leather, fabric, etc.) are made by the human by the eye via the template. Making these audits that necessitate accurate measurement by eye both takes so much time and enhance the risk occurrence risk. In this article, the image processing based industrial quality control system that determines the cutting errors of textile products automatically and discriminates between faulty and faultless products is explained. The system minimizes the faults based upon the human auditing and increases the number of pieces that are controlled by the unit of time. The performed system is composed of Panel PC, line scan camera, system of conveyor, basket control unit, image processing software and control user interface. The textile pieces (cuts) to be inspected come into the part by the conveyor where the camera and illumination unit are available, and the image is captured. This captured image is sent to the Panel PC and controlled whether there is a cutting error via image processing software. According to the result of the audit, the basket system at the end of the conveyor (conveyor belt) moves back and forth on wheel rail, and the textile pieces are provided to fall into the required basket. The performed system was tested on the leather pieces that were taken from a company in the leather sector. Totally it was tried by 150 times for 50 pieces of leather in 5 different templates and these pieces felt into the required basket correctly by discriminating for faulty/faultiness ones by 149 times (99,33% success ratio).
Keywords: Textile cutting errors, Textile quality control, Image processing ÖZET
Günümüzde tekstil (deri, kumaş vb.) ürünleri kesim hataları ile ilgili denetimler şablon vasıtasıyla insan tarafından gözle yapılmaktadır. Hassas ölçüm gerektiren bu denetimlerin gözle yapılması, hem çok uzun zaman almakta hem de hata oluşma riskini artırmaktadır. Bu makalede tekstil parçalarının kesim hatalarını otomatik olarak tespit eden ve hatalı/hatasız parça ayrımı yapabilen görüntü işleme tabanlı endüstriyel kalite kontrol sistemi anlatılmıştır. Sistem insan denetiminden kaynaklanan hatayı en aza indirmekte ve birim zamanda kontrol edilen parça sayısını artırmaktadır. Gerçekleştirilen sistem, Panel PC, çizgi tarama kamerası, yürüyen bant sistemi, sepet kontrol ünitesi, görüntü işleme yazılımı ve kullanıcı kontrol ara yüzünden oluşmaktadır. Denetimi yapılacak kesilmiş tekstil parçaları yürüyen bant üzerinde kamera ve aydınlatma ünitesinin bulunduğu kısma gelir ve görüntü yakalanır. Yakalanan görüntü Panel PC’ye gönderilir ve görüntü işleme yazılımı vasıtasıyla kesim hatası olup olmadığı denetlenir. Denetim sonucuna göre yürüyen bandın sonunda yer alan sepet sistemi, pnömatik olarak ileri/geri hareket ettirilerek parçanın istenen sepete düşmesi sağlanır. 5 farklı şablona sahip 50 adet deri parçası için yapılan 150 denemeden 149 unda (%99.33 başarı oranı) doğru olarak hatalı/hatasız ayrımı yapılarak belirlenen sepete otomatik olarak düşürüldüğü görülmüştür.
Anahtar Kelimeler: Tekstil kesim hataları, Tekstil kalite kontrol, Görüntü işleme
Corresponding Author: Kerim Kürşat Çevik, [email protected].
1. INTRODUCTION
The companies in textile and the leather sector make several audits include raw material entrance and exit of the product. The cutting errors of separated pieces are controlled especially before sewing the textile products have printing and weaving errors. The machines which control the
printing and weaving errors have existed nowadays. But there is not any quality control system for the cutting process. At present, the audits about the cutting error of textile products are made by the human by the eye via the template. Making these checks that necessitate accurate measurement by eye enhances the error risk. Thus, these
faults cause to severe financial losses for both manufacturer and the economy.
The textile products are cut by blade markers, vertical cutting saws, and laser based on the required piece shape. During this cutting process, there may be shifts in or out of the part. This kind of mistakes highly damages the manufacturer in inerrability sectors (seat and panel leather upholstery of cars). The producers cut the textile products as significant numbers of packets such as 1000-2000, that's why the amount of the financial loss rises.
It is observed a huge increment on the production rate and productivities of the textile machines in today. The increasing production capacity generates a set of problems like escaping the attention of errors in quality control departments where the audit is made by the human eye or employing more people for being audited whole products. For this reason, it is so important to measure the quality during the production by the manufacturer for reducing the costs regarding quality control and enhancing the productivity by producing high-quality products (1).
In quality control (QC) departments of many textile companies, the audit of the goods is made by the people (2, 3). Under this condition, the possibility of oversight of the errors on or in the product is high by the people and moreover it not possible for seeing the whole of the control table in a particular period. The recent studies show that the visual control capacity of a human is on average at a level that can detect 60% to 75% of apparent errors (4). Due to being the price of the second quality product cheaper than first quality one by 45% – 60, improving the rates of error determination of quality control departments is significant for the manufacturer (4).
Chan and Pang (4) worked on the errors in the warp direction by comparing the spectrum drawings of the images are faulty or faultiness in textile fabrics. The result of the study shows that a broken thread in both warp and weft direction could be determined by shifting the normalized size of unified spectrum drawing. Huang et al., (5) specified the structural characteristics of the fabric such as textile fabric analysis, fabric value and yarn twist by the image processing techniques. They used the gray stage levels of the pictures during the test. Kumar and Pang (3) used a set consisting of 16 different Gabor filter that each of them is in various shape and direction. They determined the best fit filter selection for characteristics of the errors on the fabric such as size, direction by using the error segmentation algorithm and showed the effectiveness of this system for changing dimensions and also ongoing faults. Huang and Ghosh (6) advised real-time system measures the properties of fabric pushing.
They mentioned at the end of the study that the real-time measurement systems improve the quality and productivity, after all, provides more automatization opportunity. Tsai and
Huang (7) who focused on the errors on weave surfaces showed that the repetitive design could be eliminated by taking small circular examples from the spectrum image of Fourier, equalizing the frequency components in the circle, out of the circle and in the center to the zero, trying to emphasize the possible errors. Baştürk et al., (8) worked the wavelets of Gabor and principle component analysis for to audit the errors in fabrics. They obtained unique qualifications about the characteristics of the fabric by the wavelets of Gabor. They actualized a work for determining the faulty areas on the fabric by the skills obtained. They achieved very satisfactory results in determining of the errors of the hole, torn and knot. Ala, (9) defined the errors so as to the system understands by determining them via image analysis method. After the images which were taken by the CDD linear camera by the same distance and light intensity had been transferred to the computer, it was tried to found the fabric errors in the images. Arıkan, (10) worked for determining the errors occurred on the thread and the fabric during the production with the help of the cameras as real-time.
Most of the quality control systems that are used in the textile sector include the audits on fabric weaving. These audits show the errors of the knitting in weaving. In addition to this, control of the printings on the fabric is another audit mechanism. A machine vision based system which controls the cutting errors of cut fabric or leathers automatically and separates the faulty ones was not found in our research of literature.
2. MATERIAL METHOD
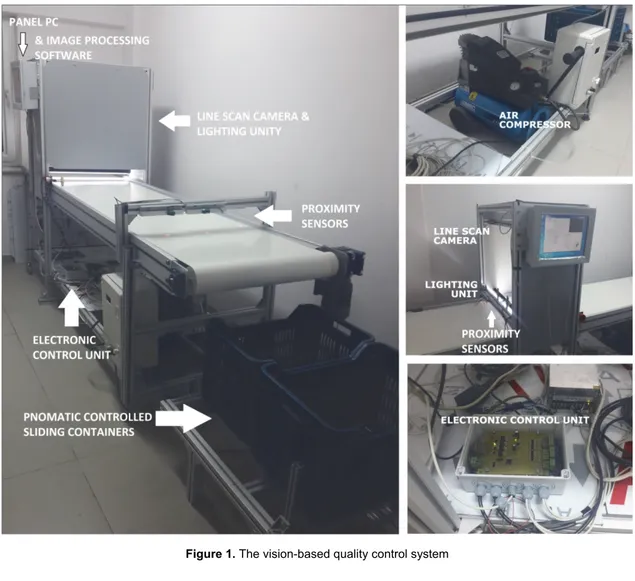
The quality control system performed in this study is composed of Panel PC, line scan camera, the illumination unit, conveyor system, image processing software, the electronic unit that controls the pneumatic basket system and user control interface units. The images belong to the developed cutting error auditing system are shown in Figure 1. In our work, Basler brand Racer raL2048-48gm model line scan camera, Kowa brand LM16HC model 1 "16 mm Megapixel lens are used. LATAB brand SAW4 6711 model line lighting is used for lighting. An electronic card for controlling the sensors and pneumatic system was designed and communicated with the computer. The Panel PC that enables the software to work is the Advantech PPC-6150. The computer has an Intel i5 2.7 Ghz processor, 8 GB RAM and a 1 GB graphics card.
As is shown in Figure 1, the developed machine vision-based quality control system is composed of line scan and the illumination unit, conveyor system, electronically control unit and pneumatic controlled sliding basket units. There are the proximity sensors in the system which determine the existence of the pieces to be controlled before entering into the camera unit and coming to the edge point of the conveyor.
Figure 1. The vision-based quality control system
(a)
(b)
(c)
(d)
(e)
Figure 2. Templates used in testing of the system
As shown in Figure 2, five different templates were used for testing the proposed quality control system. 50 pieces of leather in 5 different templates were implemented and get results. The process of the system is presented by using the first template in Figure 2.
In the designed software, the template is selected first, therefore leather templates selected one by one. The pieces tested on the conveyor are fed by human. The designed software indicates the feeding time with led lights. There is no need to specify the angles or orientation of the on the conveyor due to the use of the Hu moment method.
Because, the Hu moments method makes it possible to make comparisons independent of angle and direction. Therefore, there is no need to control any angle or direction while the pieces are placed on the conveyor.
The working phases of the system could be aligned as follows; firstly, the template of the pieces to be controlled is selected. The proximity sensors determine the pieces that come from the entrance part of the conveyor to the camera unit. The sensor sends ‘1' signal to the electronically control unit and the image process software starts the image capturing by stimulating the camera. The same proximity
sensors send the ‘0' signal to the electronically control unit after finishing the pieces, and the image process software sends the stimulation signal after 1 second of delay for completing the capturing process of the camera. Due to this delay, colored image of whole pieces could be taken. As soon as the image capturing process ends, the performed software makes the operations respectively by RGB-gray level conversion, Gaussian filter, thresholding (gray level – B/W conversion), edge finding, sharpening, feature extraction and the comparison of input image with the template data in a database. These all operations take approximately 1.8 sec. It provides to move the baskets of faulty/faultiness ones back and forth and open the relevant pneumatics valve by sending "1" or "0" signal to the electronic control unit after the faulty/faultiness determination is actualized. Stimulating this move off back and forth is achieved by the proximity sensors at the final part of the conveyor.
The most important factor that affects the success of the system is the image processing software in the computer. The commonly used Microsoft Visual Studio 2015 program and C# language were utilized for the program and being benefitted from the libraries of image processing.
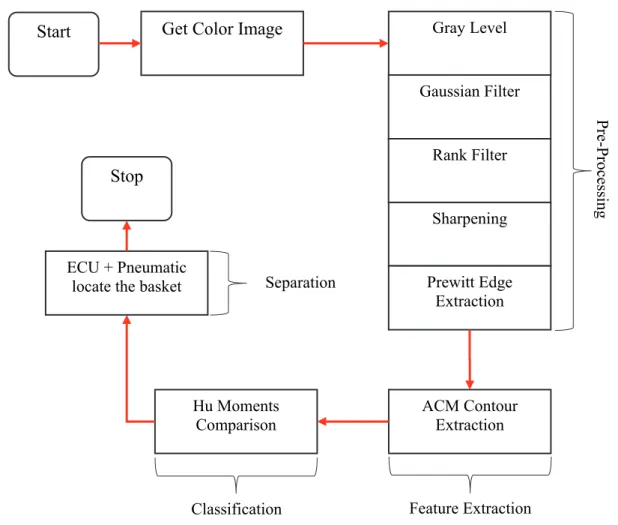
The operation phases of the designed software are shown in the block diagram in Figure 3.
2.1. Preprocessing stage
The colored (RGB) image (Figure 6a) that is obtained from the camera initially is converted to the gray level (pixel value is between 0-255) image regarding the operation convenience. This conversion is the operation of distributing the pixels in the picture between black (0) and white (255) as proportional. The equation 1 is used to set this equality. The V in equation 1 represents the new occurred pixel value, R accounts for the red value of the previous image, G represents the green value of the image and B is the blue value of the last image.
(1) Many image processing algorithms for grayscale images are described in the literature. It is stated that specific weights for the R, G, and B channels should be applied when converting from RGB to grayscale. These weights are: 0.2989, 0.5870, and 0.1140. It is said that the reason for this is that humans have different perception/sensibility towards these three colors (11). When the literature is examined it is observed that this equation is frequently used. Moreover, these values were quite successful in the image processing phase of our study.
Figure 3. The operation phases of the designed software
Start
Get Color Image
Gray Level
Gaussian Filter
Sharpening
Prewitt Edge
Extraction
Stop
Rank Filter
ACM Contour
Extraction
Hu Moments
Comparison
ECU + Pneumatic
locate the basket
Pre-Proces
sin
g
Feature Extraction
Classification
Separation
Then, the image is softened by applying the Gaussian filter for the gray level image and the edge finding operation is avoided from the negative effect of the speckle noises (Figure 6c). The general equation of this filter is given in
figure 3. At this stage, the input signal and the
convulution of the Gaussian ( ) function are calculated
(12). In this equation, is the value
of the row column of the pixel in the filter process. The in
the equation is the variance of the image.
Figure 4. Gaussians filters
The resulting gray scaled image then was converted to Black & White image by using Otsu’s thresholding method. Otsu method is generally used for performing the histogram shape-based image thresholding (13). In this algorithm, the image contains foreground and background classes of pixels. Then the optimum thresholding value is calculated for separating those into two classes. The weight, the mean and the variance values are determined for different threshold values. The first step of the algorithm is computing the histogram and probabilities of each intensity level. Then the initial probability weights and mean values are set up. By updating these values and computing intra-class variances, desired threshold value is obtained. Experiments show that when the variance value is close to 0.5, the algorithm gives better result (14). The optimum thresholding value is calculated as T=3 in our experiment. The thresholded B&W image is shown in Figure 6d.
The edge map creation process is actualized at the next step of the study. Softening the image by the Gaussian filter in the pretreatment stage complicates the edge map creation. That's why firstly the sharpening process is actualized by applying the Rank filter, then the Prewitt algorithm what we commonly faced within the edge extraction applications and produces results rapidly is implemented (15). The Rank filter is a nonlinear filter that is used to improve the edge map (16). Grading lists all pixels in an image window with the rank filter based on the physical locations in the window. The output of the filter is selected as the pixel value in defined line of this list. Let's assume that N number of pixels in an area are aligned as numerical;
(2)
The output of the color filter is selected like this
(3) For all possible window positions
(4)
In here, is the input image, is the processed image,
and is the selected pixel from the rank list. The center
pixel of the window in the rank filter is compared with the average of the predetermined two limit values. If the center pixel is bigger than this mean value, the great rank is selected as the limit value; the small rank limit value could be chosen for other circumstances as well. We can define this process as below;
(5)
(6) When the window is in the vicinity of an edge, the two rank values are considered to represent the regions on either side of the edge. The center pixel is assigned the value of the region that it is nearer to in intensity. It has been found that the use of extreme rank positions gives the best edge enhancing properties; however, such a filter also emphasizes the noise. Using rank positions somewhere between the median and the extreme positions is better in that noise enhancement is minimized (17).
The algorithm of Prewitt edge finding determined the edges by the gradient measurement. We can obtain 2 results at the end of these measures. These are gradient amplitude and the edge orientation. In Prewitt operator, generally, 8 kern matrixes receive the edge information (45º for 8). The two Kern matrixes (0º and 45º) that are used for Prewitt edge finding process could be seen in Figure 5.
Figure 5. The masks of Prewitt operator
A function like in Figure 7 is applied in 8 gradient amplitudes which were obtained from the Kern matrixes and the maximums are calculated. Then the result edge map is obtained. (Figure 6e).
(7)
2.2. Feature extraction
The feature extraction is obtained the feature set which is occurred by the qualifier components belong to the area
where the decision making or classification process will be realized. This stage comes before the decision-making phase and has a significant effect for getting the correct result. The Active Contour Model (ACM) is used as the feature extraction technique in this research. The closed areas are defined by this method, and these areas are also used for the classification level.
Active Contour Model
In recent years, ACM has been commonly used for medical image segmentation. ACM is known as basic idea of the overall development curve fitting method curves converge to object called (18-22). It is selected a curve segments around the object and then according to effects of internal and external forces converge process is performed. When representation of the curve, ACM is divided two as open (20, 23) and close (19, 24, 25). Snake model that made open demonstration of growing curve can be shown as an example for open ACM (20, 23). Level sets modal that change the curve as parametric with a certain distance function can be shown as an example for close ACM (21, 26, 27). Generally, close ACM's can cope with topological deformation more than open ACM's.
Unlimited ACM presented by Chan and Vese is a successful segmentation study that was used in many studies on various subjects (19). It is based on Curve distribution, Mumford-Shah method and level set techniques (27). It is known as Chan-Vese (CV model) region-based segmentation algorithm. This method is less sensitive to noise than other contour method. This model includes a function similar to the values of our energy to other mini-contour model. While determining the interior lines, it moves without depending on initial value. This feature is separated from the snake model. Zero level set of the surface image is a moving curve and this curve detected the object. The changes such as splitting and merging can be detected
automatically. According to this method, an image is divided into homogeneous regions using this level function. This region is composed of image parts containing closed area value (28).
C-V algorithm divided by C is off limits 0 official describes the energy function. This function is shown in Equation 8.
n equation 8, , are fixed parameters,
and are changing parameters, also they are average
value respectively remaining areas outside and inside of C contour. The first term is regularization term that prevents contour merging with a small area. The last two terms are fitting terms (29).
2.3. Classification
It could be defined as the separating the data based on the common features in classification data. The most commonly used method for converting the data into the information is the image classification. The image classification is a process that produces meaningful numerical subject maps. The class is defined as a type of the area what is determined by the image elements of the same species or specific biophysical characteristics.
The classification operation is actualized by making the area comparison in the picture which closed areas are specified. But the Hu Moments from the shape comparison operators is used in this comparison process to minimize the effects of the angles (30).
Hu mentioned in his research in 1962 that the angular differences of the shape are not sufficient for applying the moment's values. The pattern recognition is used to provide the representation of a Hu moments object that not to vary by a scale, direction, and position (31).
Figure 6. Preprocessing stages a) colored b) gray level c) filtered d) threshold e) edge map
Calculation of Hu moments: The standard geometric
moment calculation is as in Equation 9.
(9) This equation allows for the dual masked image to calculate
the center of the mass center. The pivotal moment that is
the geometrical moment of the image is computed with
center of mass:
(10)
(11) The central moment is constant at the twirling time. The
normalized moment is used to provide the constancy
according to the scale.
(12) Hu scale advised the orthogonal moment value constants based on the location and direction. These constants are
calculated by the normalize moments that are defined
below (30):
2.4. Decision stage
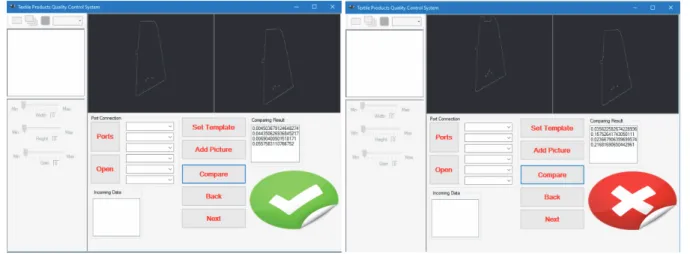
The feature vector belongs to the edge information is compared with the edge information feature vector of the template product that is predetermined into the program. Then the distinction of faulty/faultiness ones is made. The acceptable error value is defined as 2% in similarity rate. Based on this rate, it is provided to be felt the pieces to be discriminated into the relevant basket at the end of the conveyor. The electronic control unit that is designed for this process positions the basket at the end of the conveyor by controlling the pneumatics system based on the information of faulty/faultiness from the software through the serial port. The display images of the performed quality control software are shown in Figure 7. These images are shown symbolically for the system. When the system is in operation, by using the signals from the sensors, a single picture of the pieces on the conveyor is taken with the camera. Therefore, there is no video stream in the system. After receiving the single frame picture, the system processes the picture and produces the result, and according to the result, the signal is sent to the output sensors so that the pieces falls into the correct area.
(13) (14) (15) (16) (17) (18) (19)
The line scan camera is linked to Panel PC through GigE in the menu of camera settings on the left of the interface of the application. The settings of this line scan camera such as resolution, inducing, earning ratio could be arranged. The control buttons about the comparison process and port connection buttons are located at the bottom of the screen. The links of the camera, proximity sensors, and electronic control unit are made by opening the active ports in the part of the port connection. Determining the template and the comparing process manually if it needs, are located in the part of the comparison. The edge image of the product which edge map is obtained by passing through the picture processing phases and prerecorded template side image of the faultiness product are shown at the top of the screen. The visual that demonstrates the information of faulty/faultiness is located at the bottom right corner of the screen.
3. RESULTS AND DISCUSSION
In this research, a system (hardware + software) is developed for the computer aided control of the cutting errors of the textile products and discrimination of faulty/faultiness products. The performed system was tested on the leather pieces that were taken from a company in the leather sector. Totally it was tried by 150 times for 50 pieces of leather in 5 different templates and these pieces felt into the required basket correctly by discriminating for faulty/faultiness ones by 149 times. The settlement position of the pieces is the reason of misclassification. This condition could be fixed by setting the product as the required angular form. Thus, we can say that the success rate of the system is 100%.
At the same time, it could be mentioned by looking at the working time of the system that this system actualizes much more quality control as against a human who does the same work. The time elapsed from entrance of the product to the
camera control unit to the decision time of the software about fault condition is about 1.8sec. When being thought about the products settle on the conveyor that moves at intervals of 2 seconds by considering the times such as laying, detection, dropping into the basket; 30 products (1800 pieces/hour-43200 pieces/day) could be controlled per minute.
The information received from the company where the leather pieces used in the study are taken from shows that the quality control process is carried out as follows; the quality control process is carried out by 3 persons working in 8 hour shifts a day. These quality control workers place leather pieces on the templates and look for faults with their sensory organs. This manual quality control process can be applied to approximately 300-400 pieces per hour. The process is not completely faultless, and there is the possibility of some errors still remaining even after the evaluation. In the designed system, approximately 1800 pieces are checked per hour and no error is observed according to our test data. Thus, the effectiveness of the automatic control system designed for manual control is obvious.
Most of the quality control systems in textile sector are for the weaving of the fabric and determining the errors. The cutting errors that are ignored by the companies can cause the production faults in end-product. After the controls of the cutting errors by the human; there may be escaper issues, and the reliability of the company diminishes. When considered all these negative situations, the importance and the necessity of the computer aided cutting error auditing system reveals.
4. ACKNOWLEDGEMENTS
This study is supported by the frame of the Techno-initiative capital support program by Turkish Republic Ministry of Science, Industry, and Technology.
REFERENCES
1. Sari-Sarraf, H. and J.S. Goddard Jr, 1999, Vision system for on-loom fabric inspection. Industry Applications, IEEE Transactions on, Vol: 35(6), pp: 1252-1259.
2. Baykut, A., et al., 2000, Real-time defect inspection of textured surfaces, Real-Time Imaging, Vol: 6(1), pp: 17-27.
3. Kumar, A. and G.K. Pang, 2002, Defect detection in textured materials using Gabor filters, Industry Applications, IEEE Transactions on, Vol: 38(2), pp: 425-440.
4. Chan, C.-h. and G.K. Pang, 2000, Fabric defect detection by Fourier analysis, Industry Applications, IEEE Transactions on, Vol: 36(5), pp: 1267-1276. 5. Huang, C.-C., S.-C. Liu, and W.-H. Yu, 2000, Woven fabric analysis by image processing Part I: identification of weave patterns, Textile Research Journal,
Vol: 70(6), pp: 481-485.
6. Huang, W. and T.K. Ghosh, 2002, Online characterization of fabric compressional behavior, Textile research journal, Vol: 72(2), pp: 103-112. 7. Tsai, D.-M. and T.-Y. Huang, 2003, Automated surface inspection for statistical textures, Image and Vision computing, Vol: 21(4), pp: 307-323.
8. Baştürk, A., Yuğnak, Z., Ketencioğlu, H., Yüksel, M.E., 2006, Fault inspection of textile fabrics using Gabor wavelets and basic component analysis, in Eleco'2006 Electrical - Electronics - Computer Engineering Symposium, ELECO: Bursa.
9. Ala, D.M., 2008, Numerating Woven Fabric Defects With Image Analysis, M.Sc. Thesis, Pamukkale University, Denizli.
10. Arıkan, C.O., 2009, Used computer aided image processing applications in textile technology, Ph.D. Thesis, Ege University, İzmir.
11. Jyothi, G., Sushma, C.H. and Veeresh, D.S.S., 2015, Luminance Based Conversion of Gray Scale Image to RGB Image, International Journal of Computer Science and Information Technology Research, Vol: 3(3), pp: 279-283.
13. Otsu, N., 1979, An automatic threshold selection method based on discriminate and least squares criteria, Denshi Tsushin Gakkai Ronbunshi, Vol: 63, pp: 349-356.
14. Umbaugh, R.E., 1999, Handbook of IS management, Auerbach.
15. Gonzalez, R.C. and R.E. Woods, 2002, Digital image processing, Prentice hall Upper Saddle River. 16. Mitra, S.K. and G.L. Sicuranza, 2001, Nonlinear image processing, Academic Press.
17. Hodgson, R., et al., 1985, Properties, implementations and applications of rank filters, Image and Vision Computing, Vol: 3(1), pp: 3-14.
18. Chan, T.F., B.Y. Sandberg, and L.A. Vese, 2000, Active contours without edges for vector-valued images, Journal of Visual Communication and Image Representation, Vol: 11(2), pp: 130-141.
19. Chan, T.F. and L.A. Vese, 2001, Active contours without edges, Image Processing, IEEE Transactions on, Vol: 10(2), pp: 266-277.
20. Chenyang, X. and J.L. Prince, 1998, Snakes, shapes, and gradient vector flow, Image Processing, IEEE Transactions on, Vol: 7(3), pp: 359-369.
21. Osher, S. and J.A. Sethian, 1988, Fronts propagating with curvature-dependent speed: Algorithms based on Hamilton-Jacobi formulations, Journal of Computational Physics, Vol: 79(1), pp: 12-49.
22. Sapiro, G., 2006, Geometric partial differential equations and image analysis, New York: Cambridge university press, 386.
23. Chesnaud, C., P. Réfrégier, and W. Boulet, 1999, Statistical region snake-based segmentation adapted to different physical noise models, Pattern Analysis and Machine Intelligence, IEEE Transactions on, Vol: 21(11), pp: 1145-1157.
24. Li, C., Xu, C., Gui, C. and Fox, M. D., 2005, Level set evolution without re-initialization: a new variational formulation, in Computer Vision and Pattern Recognition, CVPR 2005 IEEE Computer Society Conference on, Vol: 1, pp: 430-436.
25. Suri, J. S., Liu, K., Singh, S., Laxminarayan, S. N., Zeng, X. and Reden, L., 2002, Shape recovery algorithms using level sets in 2-D/3-D medical imagery: a state-of-the-art review, Information Technology in Biomedicine, IEEE Transactions on, Vol: 6(1), pp: 8-28.
26. Malladi, R., Sethian J. and Vemuri, B.C., 1995, Shape modeling with front propagation: A level set approach, Pattern Analysis and Machine Intelligence, IEEE Transactions on, Vol: 17(2), pp: 158-175.
27. Osher, S. and Fedkiw, R., 2006, Level set methods and dynamic implicit surfaces, New York: Springer Science & Business Media, Vol: 153, pp: 280. 28. Özmen, N., 2009, Image segmentation and smoothing via partial differential equations, M.Sc. Thesis, Middle East Technical University, Ankara, pp: 102. 29. Tunali, I. and Kilic, E., 2013, Mass segmantation on mammograms using active contours." 21st IEEE Signal Processing and Communications Applications
Conference, pp:1-4.
30. Hu, M.K., 1962, Visual pattern recognition by moment invariants. Information Theory, IRE Transactions on, Vol: 8(2), pp: 179-187.
31. Conseil, S., Bourennane, S. and Martin, L., 2007, Comparison of Fourier descriptors and Hu moments for hand posture recognition, 15th European IEEE Signal Processing Conference, pp: 1960-1964.