Light-controlled microwave whispering-gallery-mode quasi-optical resonators at
50W LED array illumination
V. B. Yurchenko, M. Ciydem, and A. Altintas
Citation: AIP Advances 5, 087144 (2015); View online: https://doi.org/10.1063/1.4928868
View Table of Contents: http://aip.scitation.org/toc/adv/5/8
Published by the American Institute of Physics
Articles you may be interested in
High -factor sapphire whispering gallery mode microwave resonator at single photon energies and millikelvin temperatures
Applied Physics Letters 98, 222903 (2011); 10.1063/1.3595942
Maser oscillation in a whispering-gallery-mode microwave resonator
Applied Physics Letters 87, 224104 (2005); 10.1063/1.2137452
Whispering-gallery mode microdisk lasers
Applied Physics Letters 60, 289 (1998); 10.1063/1.106688
Refractometric sensors based on microsphere resonators
Applied Physics Letters 87, 201107 (2005); 10.1063/1.2132076
Nanoliter liquid characterization by open whispering-gallery mode dielectric resonators at millimeter wave frequencies
We present experimental observations of light-controlled resonance effects in mi-crowave whispering-gallery-mode quasi-optical dielectric-semiconductor disk res-onators in the frequency band of 5 GHz to 20 GHz arising due to illumination from a light emitting diode (LED) of 50W power range. We obtain huge enhance-ment of photo-sensitivity (growing with the resonator Q-factor) that makes light-microwave interaction observable with an ordinary light (no laser) at conventional brightness (like an office lighting) in quasi-optical microwave structures at rather long (centimeter-scale) wavelength. We also demonstrate non-conventional photo-response of Fano resonances when the light suppresses one group of resonances and enhances another group. The effects could be used for the optical control and quasi-optical switching of microwave propagation through either one or another frequency channel. C 2015 Author(s). All article content, except where otherwise noted, is licensed under a Creative Commons Attribution 3.0 Unported License. [http://dx.doi.org/10.1063/1.4928868]
I. INTRODUCTION
Whispering-gallery-mode (WGM) resonators found numerous applications1due to their
excep-tional performance associated with extremely high quality factors Q. Major progress is achieved in optics where Q factors exceeding one billion2are demonstrated and huge enhancement to other
characteristics of devices are realized. The devices include biological and chemical sensors of nanoparticles and bio-molecules,3,4unique ultralow-threshold lasers,5advanced opto-electronic and
electro-optical switchers and oscillators,6–8etc.
Microwave WGM structures do also have significant Q factors (Q > 105at the room tempera-ture9) that allows for realization of high-performance multi-pole filters,10enhanced microwave os-cillators,11ultra-sensitive (nanoWatt level) photonic microwave receivers,12new dielectric material characterization tools and techniques.13,14
In this paper, we present experimental observations of light-controlled resonance effects in microwave whispering-gallery-mode (WGM) disk resonators in the frequency band of 5 GHz to 20 GHz arising due to illumination from a light emitting diode (LED) integrated circuit array of 50W power range.
Light-controlled microwave devices offer the advantages of very high bandwidth and unique functionality, particularly, in quasi-optical systems in the higher frequency bands.15–17 Optically controlled dielectric WGM resonators have also been considered in this respect.18 In distinction from numerical simulations in Ref. 18where signal transmission peaks are of interest (the res-onator works as a pass-band filter), we present experimental study of those cases when the reso-nant deeps in signal transmission are the main feature (the structure is used as a stop-band filter device).
aElectronic mail:[email protected]
087144-2 Yurchenko, Ciydem, and Altintas AIP Advances 5, 087144 (2015)
(a) (b)
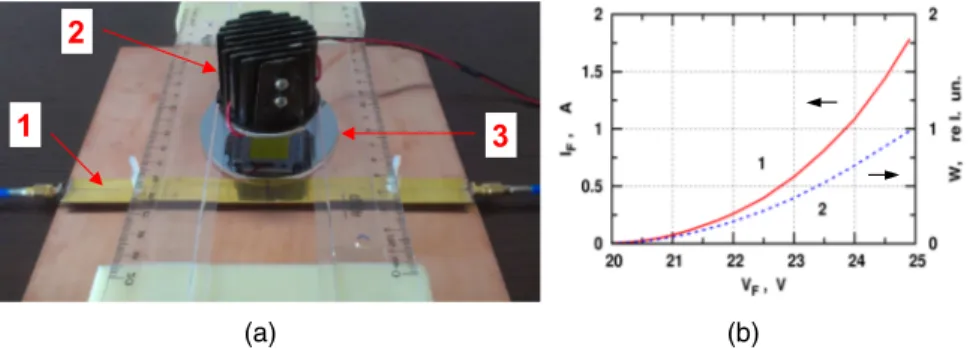
FIG. 1. (a) Experimental setup including (1) strip line, (2) LED array with a heat sink, and (3) WGM resonator, and (b) LED array current-voltage (curve 1) and luminosity-voltage (curve 2) characteristics.
II. EXPERIMENTAL SETUP
A general view of experimental setup is shown in Fig.1. The system consists of a cylindrical disk resonator placed on a metallic plate, a suspended strip line for the microwave excitation, and a 50W LED array (P003F13W-50B6C8) for the illumination of resonator surface. Metallic plate works as a mirror supporting the resonances at the lower frequencies as those in the disk suspended in free space (yet, they are higher as compared to those in the disk squeezed between two plates19). Microwave measurements are made with the E5071C network analyzer in the frequency band from 300 KHz to 20 GHz. The measured quantity is the S21 coefficient representing the signal transmission through the system as shown in Fig.2.
Each resonator is assembled as a stack of disk wafers of sapphire ‘s’, fused quartz ‘q’, and high-resistivity silicon ‘si’ ( ρ= 30 KOhm cm) which is, typically, used as a top layer. The stacks are denoted as, e.g., MsNsi and MqNsi where the coefficients M and N specify the numbers of relevant wafers. The thickness of ‘s’, ‘q’, and ‘si’ wafers is ts= 0.40 − 0.42 mm, tq= 0.52 mm,
and tsi= 0.50 mm, respectively, and the diameters are Ds= Dsi= 76.2 mm and Dq= 75.0 mm.
Below we present the results for 7s1si, 7q3si, 10s1si, and 7q2si stacks.
The size and the number of wafers in each resonator have been chosen so as to provide a well-developed resonant spectrum in the given frequency band. The bulk of the resonator consists of traditional low-loss materials whereas semiconductor wafers are used only as the top layers to be illuminated. Both the depths and the frequencies of the resonant deeps could be fine tuned by adjusting the number of wafers and the size of the air slot between the resonator and the excitation line. The metallic plate used as a substrate helps to provide an efficient excitation of the resonator. In addition, once the plate is operating as a mirror, when the top semiconductor wafer is illuminated, the image wafer also increases the conductivity and contributes to the better control of the resonator performance.
III. DARK-STATE WGM RESONATOR RESPONSE
Fig.3 shows the dark-state microwave transmission spectra of strip line loaded with one of two kinds of disk resonators, 7q3si and 7s1si. Transmission of the strip line with no resonator is
(a) (b)
FIG. 3. Dark-state microwave transmission spectra S21 in case of (a) no resonator (curve 1, to be used as a reference) and 7q3si resonator (curve 2) and (b) 7s1si and 7q3si resonators when presented with respect to the reference (curves 1 and 2, respectively).
shown by curve 1 in Fig. 3(a). The line is made to have the intrinsic impedance of 50 Ohms at the frequency f = 10 GHz. Transmission of the line decreases with increasing the frequency due to radiation losses, dropping down to -60 dB near the frequency of f = 20 GHz.
When loaded with a disk resonator, the strip line shows the microwave transmission spectrum with a sequence of resonant deeps due to the WGM disk excitation (curve 2 in Fig. 3(a)). Fur-ther, we show the S21 spectra with respect to the reference curve of unloaded line so as to better represent the resonator effects.
Exact simulations of three-dimensional WGM disk resonators are complicated,18,20,21 espe-cially, with account of excitation lines. In the meantime, simplistic estimates based on two-dimensional model22confirm the excitation of basic modes at about those frequencies as observed in the experiments. Fine tuning of disk position with respect to strip line, while keeping a minor slot between the disk and the line, allows us to obtain a significant depth of the resonant deeps in the signal transmission.
In our cases of 7s1si and 7q3si resonators (curves 1 and 2 in Fig. 3(b), respectively), fine tuning resulted in the leading resonant deeps of S21 signal down to the level of P1= −76 dB
and P2= −42 dB with respect to the reference curve at the frequencies of f1= 8.20095 GHz
and f2= 9.99214 GHz where the deeps are specified by the quality factors Q1= 3 × 10⁵ and
Q2= 5 × 10⁴, respectively. The deep quality factor Q is defined as Q= f /∆ f where ∆ f is the width
of the deep measured at the level of 3 dB above the minimum (measurements are made under the conditions of sufficient darkness).
IV. LIGHT SENSITIVITY OF TOP-SEMICONDUCTOR DISK RESONATOR
Light effects on the disk resonators with top semiconductor wafers (Figs.4–6) were investi-gated using a white-color LED array whose current-voltage (IF-VF) and luminosity-voltage (W -VF)
characteristics are shown in Fig.1(b). The characteristics were measured in a pulse mode with the
(a) (b)
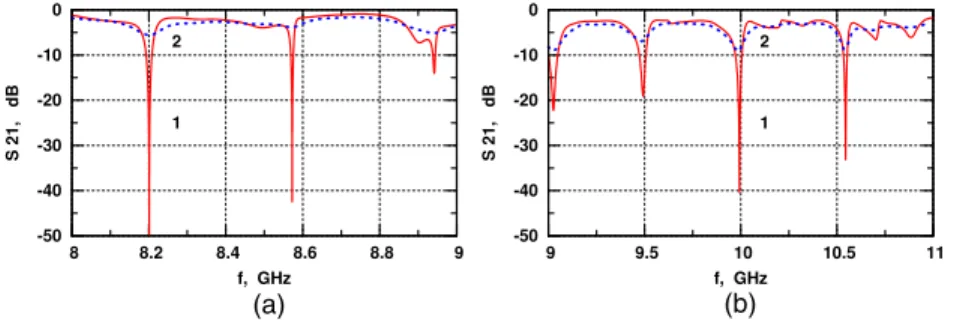
FIG. 4. Light sensitivity of resonances in case of (a) 7s1si and (b) 7q3si disk resonators (curves 1 and 2 show the dark and light states, VF= 0V and VF= 28V, respectively).
087144-4 Yurchenko, Ciydem, and Altintas AIP Advances 5, 087144 (2015)
(a) (b)
FIG. 5. (a) Light sensitivity of the leading resonant deep of S21 signal in case of 7s1si resonator (VF= 0, 21, 23V, curves 1
to 3, respectively) and (b) the LED voltage dependence of the leading resonant deeps in case of 7s1si and 7q3si structures.
light pulse duration τp= 1s being the same as needed for recording separate traces of microwave
spectrum. Microwave measurements were also made in a pulse mode, with sufficient relaxation time between pulses for avoiding heat and light accumulation effects, and with proper averaging of recorded signal over multiple traces.
Fig.4 shows the light effects on the WGM resonances in case of 7s1si and 7q3si structures at the maximum power of LED array. In this case, the light suppresses all the resonances. This happens due to photo-excitation of electron-hole plasma in a semiconductor that induces electrical conductivity and creates significant microwave losses so as the resonances are completely damped.
Fig.5 shows the effect of intermediate light intensity on the leading resonance of 7s1si res-onator and the LED voltage dependence of the leading resonant deeps in case of 7s1si and 7q3si structures ( f1= 8.20095 GHz and f2= 9.99214 GHz, respectively). As expected, the resonance of
higher quality factor Q and deeper drop of S21 signal is more sensitive to the illumination.
As an example, the illumination by the LED array at the voltage of VF= 21V increases the
microwave transmission at the leading resonant frequencies by 50 dB in case of 7s1si resonator (curve 2 in Fig.1(a)) and only by 13 dB in case of 7q3si structure. The illuminance Evon a silicon
wafer (18 mm away from the array with active area of 15 × 15 mm2) is estimated to be about 65 lx
when using the LED array specification (the luminous flux is about Fv= 2370 lm at VF= 25 V and
IF = 1.75 A, that means one relative unit of luminosity W in Fig.1(b)). Direct measurements with a
pin photodiode SFH 203P show that Evon the wafer at VF= 21V is about 1.3 times greater than the
illuminance in an office with a typical artificial lighting.
Finally, Fig.6shows the light effects in two other cases of resonators, 10s1si and 7q2si ones. Each resonator is tuned to have a weak coupling to the excitation line that results in a regular sequence of resonant deeps in microwave transmission as a function of frequency.
It is worth noting that, in the resonators with sapphire wafers, we observed a specific long-term photorefractive effect which did not appear in other cases. On a time-scale of a few seconds after the turning on the light (faster at the higher light intensity), the resonant deeps shifted towards the higher frequencies and showed increased microwave losses as compared to the values emerging at
(a) (b)
FIG. 6. Microwave transmission spectra in case of weak coupling of (a) 10s1si and (b) 7q2si resonators (curves 1 and 2 correspond to the dark and light states, VF= 0V and VF= 28V, respectively).
Enhanced light sensitivity of resonant deeps in microwave transmission provides a possibility of light-controlled switching of signal propagation with quasi-optical WGM resonators. At present, we could achieve switching with a 50W LED array at a partial load when the radiant flux is about E= 0.5W/cm2 (that corresponds to the illuminance of E
v= 65 lx at the given LED spectrum),
though it is limited in the repetition rate fRby the recombination lifetime in a silicon wafer (the
latter is about τR∼ 30µs, so as fRshould be less than τR−1∼ 30kHz).
When using a semiconductor with recombination lifetime τR∼ 1ns, the light-controlled
switch-ing could be obtained at the higher repetition rate with pulses of short duration τp∼ 1ns at the pulse
power flux of 15kW/cm2. In this case, the total radiant energy of a single pulse would be about
7 × 10⁻⁴J that could be achieved with a short-pulse laser operating in a pulse mode at the repetition
rate being about fR∼ 1GHz.
V. OVER-COUPLING EFFECTS
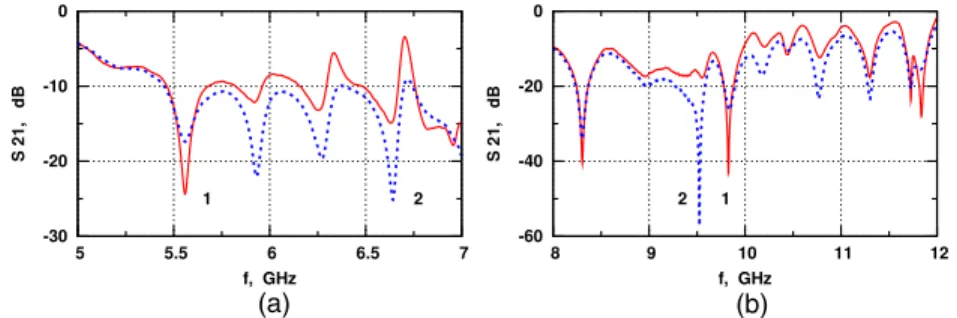
A group of more unusual effects is observed under the strong coupling of resonators with an excitation line. Fig. 7 shows the effects arising due to the strong coupling when using the same resonators as those in Fig.6. In this case, when reducing the air slot between the disks and the strip line, the resonant lines acquire specific asymmetric shapes characteristic for the Fano resonances.23
Fano resonances are the form of resonant oscillations emerging in the presence of continuous wave propagation when there is a coupling of oscillations with propagating waves.
Once the excitation line is supporting the propagating waves coupled to the resonator, the resonances being observed are always the Fano resonances which, though, look like conventional ones in case of a weak coupling. With increasing the coupling, they reveal their features as Fano resonances, such as the asymmetric shape of the resonant line profile.
When the coupling is particularly strong, the spectrum alters drastically and abruptly. This is the case of over-coupling, which is realized when the disks may touch the strip line, or slip under the strip, or one disk may be shifted with respect to another and partially overlay the strip line, etc. In these cases, the spectrum is getting especially complicated.
Regarding the light effects, the structures with over-coupling could be used as the light-controlled switches between different propagation channels. Fig.7shows a possibility of switching between two frequency channels through opening one channel and blocking the other (either f1or
f2) when turning on and off the light incident on the resonator ( f1= 5.56 GHz, f2= 6.64 GHz in
case of 10s1si structure and f1= 9.82 GHz, f2= 9.52 GHz in the 7q2si resonator).
(a) (b)
FIG. 7. Over-coupling effects in case of (a) 10s1si and (b) 7q2si resonators (curves 1 and 2 correspond to the dark and light states, VF= 0V and VF= 28V, respectively).
087144-6 Yurchenko, Ciydem, and Altintas AIP Advances 5, 087144 (2015)
VI. CONCLUSION
We present experimental study of light-controlled resonance response of microwave structures based on sapphire and fused quartz disk resonators with top semiconductor (intrinsic silicon) wafers being illuminated by a 50W LED array and operated in the frequency band of 5–20 GHz. Quan-titative characteristics of the effect have been measured in the system configuration with resonant deeps in the transmission signal. The effect could be used for light-controlled switching of signal propagation in this kind of microwave systems.
ACKNOWLEDGMENTS
The work was supported by The Scientific and Technological Research Council of Turkey (TUBITAK) through the 2236 Co-Funded Brain Circulation Scheme (“Co-Circulation”).
1A. B. Matsko, ed., Practical Applications of Microresonators in Optics and Photonics (CRC Press, 2010). 2G. Lin, S. Diallo, R. Henriet, M. Jacquot, and Y. K. Chembo,Opt. Lett.39, 6009 (2014).
3Y. Shen and J.-T. Shen,Phys. Rev. A85, 013801 (2012).
4V. R. Dantham, S. Holler, C. Barbre, D. Keng, V. Kolchenko, and S. Arnold,Nano Lett.13, 3347 (2013). 5K. Nozaki, A. Nakagawa, D. Sano, and T. Baba,IEEE J. Sel. Top. Quantum Electron.9, 1355 (2003). 6K. Djordjev, S. J. Choi, and P. D. Dapkus,IEEE Photon. Technol. Lett.14, 828 (2002).
7M. Pollinger and A. Rauschenbeutel,Opt. Express18, 17764 (2010). 8X. S. Yao and L. Maleki,J. Opt. Soc. Am. B13, 1725 (1996).
9J. G. Hartnett, M. E. Tobar, E. N. Ivanov, and A. N. Luiten,IEEE Trans. Ultrason., Ferroelectr., Freq. Control60, 1041
(2013).
10A. A. Savchenkov, V. S. Ilchenko, T. Handley, and L. Maleki,IEEE Photon. Technol. Lett.15, 543 (2003).
11A. V. Dormidontov, A. Y. Kirichenko, Y. F. Lonin, A. G. Ponomarev, Y. V. Prokopenko, G. V. Sotnikov, V. T. Uvarov, and
Y. F. Filippov,Tech. Phys. Lett.38, 85 (2012).
12V. S. Ilchenko, A. A. Savchenkov, A. B. Matsko, and L. Maleki,IEEE Photon. Technol. Lett.14, 1602 (2002). 13E. N. Shaforost, A. A. Barannik, N. Klein, S. A. Vitusevich, and A. Offenhaeusser,J. Appl. Phys.104, 074111 (2008). 14V. B. Yurchenko,Prog. Electromagn. Res. M24, 265 (2012).
15A. A. Vikharev, G. G. Denisov, V. V. Kocharovskii, S. V. Kuzikov, V. V. Parshin, N. Y. Peskov, A. N. Stepanov, D. I. Sobolev,
and M. Y. Shmelev,Tech. Phys. Lett.33, 735 (2007).
16L. Fekete, F. Kadlec, P. Kuzel, and H. Nemec,Opt. Lett.32, 680 (2007).
17I. Chatzakis, P. Tassin, L. Luo, N.-H. Shen, L. Zhang, J. Wang, T. Koschny, and C. M. Soukoulis,Appl. Phys. Lett.103,
043101 (2013).
18H.-X. Zheng, J.-C. Ding, and D.-Y. Yu,Int. J. Infrared and MM Waves27, 55 (2006). 19M. F. Akay, Y. Prokopenko, and S. Kharkovsky,Microwave Opt. Technol. Lett.40, 96 (2004). 20X. Du, S. Vincent, and T. Lu,Opt. Express21, 22012 (2013).
21M. Oxborrow,IEEE Trans. Microw. Theory Tech.55, 1209 (2007).
22V. B. Yurchenko, A. Altintas, M. Ciydem, and S. Koc,Prog. Electromagn. Res. C43, 29 (2013). 23A. E. Miroshnichenko, S. Flach, and Y. S. Kivshar,Rev. Mod. Phys.82, 2257 (2010).