*,■>*!*■-· ■‘«■i·· l · ^ ц » ·^ . ■. '-'ЧИЙЯ;^ :^д' .. ■■· ■
>:.···- 4:; ν·;4·:>.·.: · ; ..··..*£ ,Ъ'· · ·;γ.- .
RADIOCHRONOLOGY OF SEDIMENTS FROM
VARIOUS REGIONS OF THE MEDITERANIAN SEA
BY DIRECT GAMMA SPECTROSCOPY USING
NATURAL 2iopb,226Ra AND FALLOUT
A T H E SIS S U B M IT T E D TO T H E D E P A R T M E N T O F C H E M IST R Y A N D T H E IN S T IT U T E OF E N G IN E E R IN G A N D SC IE N C E S O F B IL K E N T U N IV E R S IT Y IN P A R T IA L F U L F IL L M E N T O F T H E R E Q U IR E M E N T S F O R T H E D E G R E E O F M A S T E R O F S C IE N C E
By
Soheyl Tadjiki
June 1992
tarafından bağışlanmıştır.
ыь
I certify that I have read this thesis and that in my opinion it is fully adequate, in scope and in (juaJity, as a. thesis for tlu^ dcigrce ol Ma.st(M· c)l Sciencc\
Prof. Dr. Hasan N. Erten(Principal Advisor)
I certify that I have read this thesis and that in my opinion it is fully adequate, in scope and in quality, as a thesis for the degree of Master of Science.
Q ( · ^ '/ c / u A . L · Assoc. Fiof. Dr. Hale Göktürk
I certify tliat I have read this tlicsis and tliat in my o|)inion it is fnlly adcujnatii,
in scope and in quality, as a thesis for the degree of Master of Science.
Prof. Dr. Zeki Kurtbğkı
Approved for the; Institute of ISiigineeriiig and Sciences:
Prof. Dr. Melmiet Baray
RADIOCHRONOLOGY OF SEDIMENTS FROM VARIOUS
REGIONS OF THE MEDITERANIAN SEA BY DIRECT
GAMMA SPECTROSCOPY USING NATURAL
AND FALLOUT ^^^Cs.
Soheyl Tadjiki
M.S. in Ghemistry
Supervisor: Prof. Dr. Hasan N. Erten
June 1992
The and profiles are determined at two locations in south ern coast of Spain, Three locations in southern coast of Turkey and two lo cations in coast of Cyprus. Compaction-corrected sedimentation rates are derived for all locations using data. The rates range from 1..39± 0.12 crn.y"' (0.50±0.04 g.cm“^.y“ ^) to 0.08±0.01 cm.y“ ^ (0.039±0.003 g.cm~'^.y“ ^) (0.50±0.04g.cm"^.y~^). Except for BC-6A, for all of the locations the ^^’^Cs profile is used to compute sedimentation rates which are in a good agreement with those of '^^°Pb method. The result of the Constant Initial Concentration and Constant Rate of Supply dating models are in a good agreement with each other whereas in BC-6A and KS-1 cores only Constant Rate of Supply model is valid to calculate sedimentation rate. The flux of unsupported '^^°Pb vary between 0.74±0.01 pCi.cm“ ^ and 0.11 ±0.03 pCi.cm“^. The average deposi- tional flux is found to be considerably low in the coast of Turkey and Cyprus, whereas it is found to be high in the coast of Spain.
Key Words: ^^°Pb,^'^’^Cs,Sedimentation rate,^^^^Cs profile. Constant Initial Concentration model,Constant Rate of Supply model,The flux of unsupported 210pb.
ÖZET
DOĞRUDAN GAMMA SPEKTROSKOPY
KULLANILARAK, ^^^Pb ve
YÖNTEMLERİYLE
AKDENİZ SEDİMENTLERİNDE SEDİMENTASIYON HIZI
TAYİNİ.
Sobeyi Tadjiki
Kimya Bölümü Yüksek Lisans
Tez Yöneticisi: Prof. Dr. Haşan N. Erten
Haziran 1992
İspanya, Türkiye ve Kuzey Kıbrıs sahellerinden elde edilen sediment örneklerinin çökeltme hızlan, doğal ve radyoaktif döküntü çekirdeği ^^^Cs kullanılarak tayin edilmiştir. Elde edilen çökeltme hızları 1.39± 0.12 cm.sene“ ^ (0.50±0.04 g.cm“'^.sene“ ^) den 0.08±0.01 cm.sene“ ^ (0.039±0.003 g.cm“^.sene“ ^) ye kader değişmektedir. BC-6A hariç, bütün sediment örnekleri için ^^^Cs dağılımını kullanılarak, çökertme hızları hesaplanmıştır. Hesaplanan bu sonuçlar, ^^°Pb yönteminin sonuçlarıyla uyum göstermektedir. BC-6A ve Ks-1 hariç, bütün sediment örneklerinde Sabit Başlangıç Yoğunluğu ve Sabit Birikme Hızı mod ellerinin sonuçları birbiriyle uymaktadır. BC-6A ve KS-2 sediment örnekleri için sadece Sabit Birikme Hızı modeli kullanılabilmiştir. Hesaplanan beslen meyen ^^°Pb akımı 0.74±0.07 pCi.cm“ ^ den 0.11±0.03 pCi.cm"^ ye kader değişmektedir. Türkiye ve Kuzey Kıbrıs sahillerinde hava dan gelen ortalama beslenmeyen ^^°Pb akımı, 0.9 dpm.cm“^.sene~* den daha düşük , Ispanyanin sahillerinde ise daha büyük olduğu gözlenmiştir.
Anahtar Kelimeler:Çökeltme hızlan,Doğal ^^°Pb,Radyoaktif döküntü çekirdeği ^^’^Cs,^^^Cs dağılımı,Sabit Başlangıç Yoğunluğu modeli,Sabit Birikme Hızı mod eli,Beslenmeyen ^^°Pb akımı.
I gratefully acknowledge to Prof. Dr. Hasan Erten for his guidance and fruitful discussions throughout this work. W ithout his remarks and ideas this study could not be completed.
I debt special thanks to Sepideh Tadjik!, Dr. Azer Kerimov and Ogan Ocah for their valuable helps in the course of this study.
I would like to express my gratitude to shoeleh for her continibus moral support, experimental help and valuable dicussions during this study.
Contents
1 INTRODUCTION 1
1.0. 1 Distribution In the Atmosphere... 3
1.0. 2 ^^°Pb in Sediments... 3
1.0. 3 Geochronology with ^^°Pb... 5
1.0. 4 Method for the determination of ^^°Pb... 8
1.0. 5 Mathematical M o d e ls :... 9
2 EXPERIMENTAL 16 3 RESULT AND DISCUSSION 25 3.0. 6 Cores taken from the southern coast of S p a i n : ... 28
3.0. 7 Cores From Southern T u r k e y :... 41
3.0. 8 Cores taken from Cyprus: 53
4 Conclusion 65
5 APPENDIX 67
2.1 The list of the 7 rays of the background spectrum belonging to the natural radionuclides obtained with a High-purity Germa nium detector.The gain of the Multichannel analyzer was chosen
as 0.300 keV/channel. 19
2.2 The list of radionuclides used in the Energy and Efficiency cali brations of the detector... 20 2.3 Coring coordinates and sampling date of the sediments taken
from the coasts of Spain, Turkey and Cyprus. 21
3.4 Porosity,corrected depth and mass depth data of 1 and BC-6A Cores... 30 3.5 Result of Activity measurements of Total ^^°Pb,Supported ^^°Pb
and Unsupported ^^°Pb for BC-1 and BC-6A Cores.The unit of the activities are expressed by disintegration per minute for one gram of dried sample. The weighted average of Supported ^^°Pb activity for BC-1 and BC-6A cores is computed as 2.23±0.07 and 3.18±0.08 respectively... 31 3.6 The age of the each sediment section is computed from Constant
Rate of the Supply model using the Equation. 1.5 for BC-1 and BC-6A C o r e s ... 34 3.7 ^^’’'Cs Activity measurement for BC-1 and BC-6A Cores. 37 3.8 Porosity, (j){z) Corrected depth, z (cm) and Mass depth, m (g.cm~^)
LIST OF TABLES XI
3.9 Result of Activity measurements of Total Supported
and Unsupported ^^°Pb for core-2,core-3 and core-35 unit of the activities are expressed by disintegration per minute for one gram of dried sample. The weighted average of Supported ^^°Pb for core-2,core-3 and core-35 were computed as 0.48±0.07,0.55±0.08 and 1.32±0.27 dpm /g respectively... 44 3.10 Result of sedimentation rate analysis for Core-2,Core-3 and Core-
35. The sedimentation rates and flux values were calculated from weighted least square fit procedure which was applied to the unsupp. ^^°Pb activity d a t a ... 45 3.11 Age determination of each section of sediment cores taken from
southern Turkey cores using Constant Rate of Supply model. . . 45 3.12 Measured ^^"^Cs Activity for Core-2,Core-3 and Core-35... 49 3.13 Result of the sedimentation rate analysis for KS-1 and KS-2
cores using ^^°Pb and ^^^Cs methods... 53 3.14 Porosity, Corrected depth, z (cm) and Mass depth, m (g.cm“^)
data for KS-1 and KS-2 Cores... 55 3.15 Result of Activity measurements of Total,Supported and Unsup
ported ^^°Pb for KS-1 and KS-2 Cores. The unit of activities are in disintegration per minute for ten grams of dried samples.The weighted average of supported ^^°Pb activity for KS-1 and KS-2 were computed as 7.68±0.15 and 12.74±0.22 dpm/lOg respectively 56 3.16 Result of the ^^^Cs and ^^'*Cs Activity measurements for KS-1
and KS-2 Cores... 58 3.17 Age determination of sediments taken from the KS-1 and KS-2
cores using Constant Rate of Supply model... 61
4.18 Result of the sedimentation rate analysis for sediments taken from the coasts of Spain,Turkey and Cyprus using ^^°Pb and ^^^Cs methods. * indicates the result of the Constant Rate of Supply dating m o d e l ... 65
5.19 vertical distribution of Ni, Cu, Ag, Zn, Cd, Pb, P, Al, La, Tl, V, Cr, Mo, Mn, Fe, Co, Li, Va, K, Rb, Be, Mg, Ca, Sr and Ba (the concentration expressed in ppm.) in BC-1 core.The chemical analysis was done using Inductively Coupled Plasma Atomic Emission Spectroscopy (ICP/AES) by Prof. G.Evans at the Geological Department of Imperial Collage, London...67 5.20 vertical distribution of Ni, Cu, Ag, Zn, Cd, Pb, P, Al, La, Tl,
V, Cr, Mo, Mn, Fe, Co, Li, Va, K, Rb, Be, Mg, Ca, Sr and Ba (the concentration expressed in ppm.) in BC-6A core.The chemical analysis was done using Inductively Coupled Plasma Atomic Emission Spectroscopy (ICP/AES) by Prof. G.Evans at the Geological Department of Imperial Collage, London. 70 5.21 PH and Temperature profiles of BC-1 and BC-6A c o r e s ... 73 5.22 Grain size analysis, the percentage of the CaCOa and the per
centage of the Organic Carbon in Core- 2 ... 73 5.23 Grain size analysis, the percentage of the CaCOa and the per
centage of the Organic Carbon in C o re -3 ... 73 5.24 Grain size analysis, the percentage of the CaCOa and the per
L ist o f F ig u res
1.1 The natural decay series of ... 2
1.2 The pathway by which reaches lake s e d i m e n t ... 4
1.3 World-wide distribution of ^^°Pb in surface a i r ... 6
1.4 ■ World-wide distribution of ^^°Pb in rain ... 6
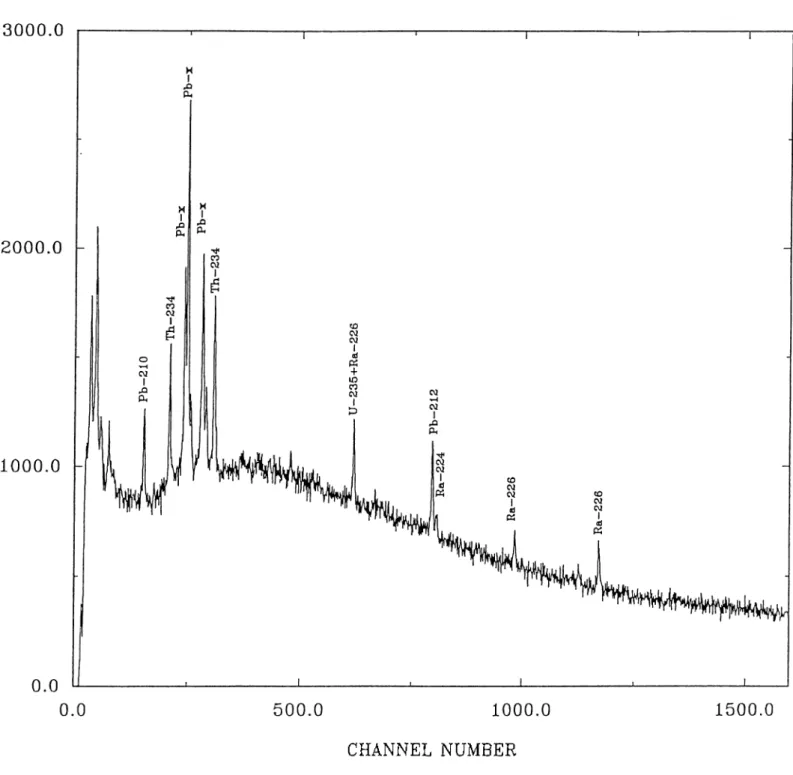
2.1 A drawing of a Ge detector 17 2.2 Spectrum of the natural background obtained by with a High- purity Germanium detector. The detector was shielded a lead cylinder with a length of 420 mm, thickness of 90 mm and a diameter of 210 mm. The gain of the multichannel analyzer was set at 0.300 keV/channel.The counting time was 8.0x10® sec. . . 22
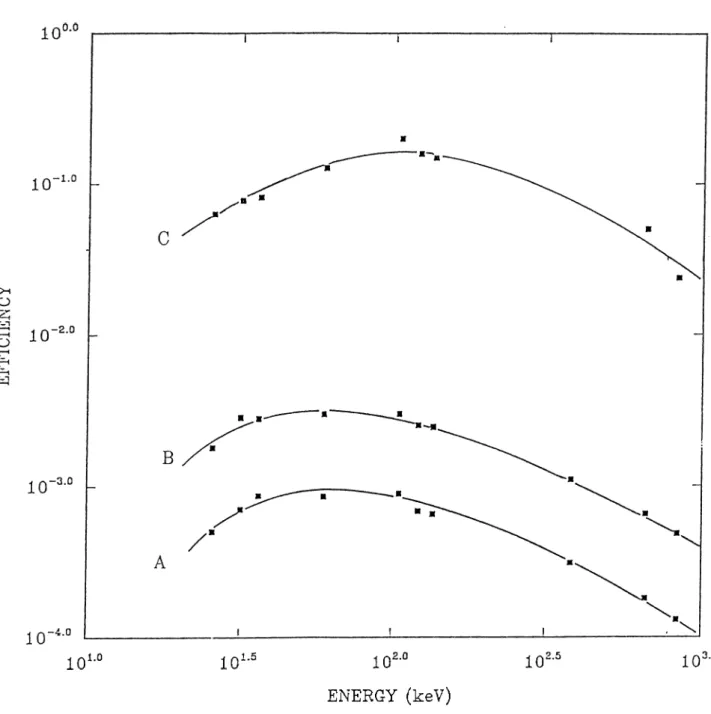
2.3 Energy Calibration of the High-purity Germanium detector us ing the calibration sources given in the Table 2.2. The gain of the multichannel analyzer was set at 0.300 keV/channel.Energy given in keV. 23 2.4 Efficiency Calibration for three different source-detector geome-try.a) source-detector distance was 19.60 cm. b) source-detector distance was 12.10 cm. c) source-detector distance was 0.61 cm. The gain of the multichannel analyzer was set at 0.300 keV/channel... 24
3.1 The 7 ray spectrum of the sediment at the top section of BC-1 core taken from southern coast of Spain.The counting time was 2.5x10® sec... 27
3.2 Coring locations of the BC-1 and BC-6A cores taken from south
ern coast of Spain. 29
3.3 Porosity, <^(z) and Mass depth, m (g.cm“^) profiles of BC-1 and BC-6A Cores.D:BC-l.A;BC-6A... 32 3.4 Profile of Total ^^°Pb activity (dpm/g) in the sediments cores
taken from the southern coast of Spain.OrBC-l core, A:BC-6A core... 35 3.5 Profile of Supported ^^°Pb activity (dpm/g) in sediments cores
taken from the southern coast of Spain.OtBC-l core, A:BC-6A core... 35 3.6 Profile of Unsupported ^^°Pb activity (dpm/g) in sediments cores
taken from the southern coast of Spain.line is the result of weighted least square fit to the unsupported ^^°Pb activity data for BC-1 core... 36 3.7 The comparison of Constant Rate of Supply and Constant Initial
Concentration dating models for BC-1 and BC-6A Cores. The points corresponds the Constant Rate of Supply model and the line represents the Constant Initial Concentration model . . . . 38 3.8 Profiles of ^^^Cs in BC-1 and BC-6A Cores. The first and the
second peaks could be attributed to fallout from 1963 and 1954 when the nuclear weapon and device testings were occurred . . . 40 3.9 Coring locations of Core-2, Core-3 and Core-35 taken from south
ern coast of Turkey... 42 3.10 Porosity profile of Core-2,Core-3 and Core-35.□ :Core-2.
A:Core-3.0:Core-35. 46
3.11 Mass depth, m (g.cm“^) of sediment taken from southern Turkey.DrCore-2.A :C ore-3.0‘Core-35... 46 3.12 Supported ^^°Pb activity of the sediment cores taken from south
ern Turkey. □:Core-2.A:Core-3.Q:Core-35... 47 3.13 Total ^^°Pb activity profile in Core-2,Core-3 and
LIST OF FIGURES IX
3-14 Unsupported activity profile in 2,3 and Core-35.The line in each figure represents the weighted least square fit to activity data.n:Core-2.A:Core-3.0:Core-35... 48 3.15 The comparison of the result of the age determination using
Constant Rate of Supply and Constant Initial Concentration models.Point represents the result of the Constant Rate of Sup ply model and straight line represents the result of the Constant Initial Concentration model... 51 3.16 ^^'^Cs activity profiles in Core-2, Core-3 and Core-35. The first
and the second peaks could be attributed to the fallout from the weapon and device nuclear testing in 1963 and 1954 respectively. 52 3-17 The general view of the coring locations of the KS-1 and KS-2
cores taken from the coast of Cyprus... 54 3.18 The porosity, ^(z) and Mass depth, m (g.cm“ ^) profiles for KS-1
and KS-2 cores. DiKS-l core, A:KS-2 core... 57 3.19 Total ^^°Pb activity profiles for KS-1 and KS-2 cores. The unit
of the activities are in disintegration per minute for ten grams of dried sample.DrKS-l core,A:KS-2 core... ; . 59 3.20 Supported ’^^°Pb activity profiles for KS-1 and KS-2 cores. The
unit of the activities are in disintegration per minute for ten grams of dried sample. DrKS-l core,A:KS-2 core... 59 3.21 Unsupported ^^°Pb activity profiles for KS-1 and KS-2 cores.
The straight line is the result of the weighted least square fit procedure which is applied to the unsupported ^^°Pb activity data... 60 3.22 The distribution of the ^^^Cs in KS-1 and KS-2 cores. The first
and the second peaks could be attributed to the 1986 and 1963 respectively... 62 3.23 The comparison of the result of the age determination using
Constant Rate of Supply and Constant Initial Concentration models, points represent the result of the Constant Rate of Supply model and the straight line represents the result of the Constant Initial Concentration model... 63
INTRODUCTION
The sediments of seas and lakes may provide historical information for recon structing many aspects of impact and dramatic transformations done by man on the environment . In order to analyze these effects it is important to estab lish accurate and detailed chronologies of sedimentation.These are required not only for dating events but also for calculating rate of sedimentation, elemental flux, and microfossil deposition.
One of the most accurate techniques of sediment dating on a time scale of about 200 years is by means of using natural radioisotopes of lead. The devel opment of this method was initiated by Goldberg in 1963 [1] and it was first applied to the dating of lake sediments by Krishnaswamy in 1971 [2]. Among the 17 radioisotopes of lead, only '^^°Pb ( ii/2=22.26 yr.) and ^^^Pb ( ¿1/2=27 min.) which are in the natural series family (fig.1.1) have geochemical and geophysical significance. They are transferred from the earths crust to the atmosphere in major amounts, due to a remarkable and fortunate property of radioactive decay sequence. In the decay sequence of chain the isotope of the chemically inert radioactive gas ^^^Rn ( ¿i/2= 3.8 d.) is formed by the disintegration of the intermediate isotope ^^®Ra ( ¿i/2=1600 yr.), and diffuses out of the crust. ^^^Rn gas is transported by turbulence and advection through the atmosphere. Because of it’s comparatively long half life some ^^^Rn reaches the upper troposphere and even the stratosphere. The ^^^Rn decay products are heavy metal atoms thus they rapidly become attached to natural aerosols and in time the longer lived decay products including ^^°Pb return to earth, lake, sea, and ocean surfaces through atmospheric scavenging processes (e.g, snow, rain, dry fallout, etc).
9
0
2 3 4 m m 2 ,4 5 x ,0 = y ^« ^; 3 I 2 3 4 P qU
.U
i
4. 47 xl 0' 'y 2 3 0 T h ,I o 2 3 4 j h 'u x 0 .0 X I0 ‘'y 2 4 . IdZ
¿5
■'-^’
R
a
,
R
ci
I. G O X lO ^ y8
5
2 1 0.
2 I O n „r-P
o
,
F
ia
F
'3 0 ,4 d8
0
9 ? 9R
n
,
R
n
>
aa
//
2
,0 1 ^ '® P o . R a A ? ld ^ ^ ' r-i y , 3 .0 5 i n In"
'"
'
pF
R
aB
-y / o ir f ^ 2 0 .0 m in -1 --yM ^ 1 O ^ r ' 4 .2 0 m in '^ A li o -^ y ^ i, ’2
0
6
Slo b fo 2 ° ® T I, R a E-2
0
6
H
g
Q .l m in ^Z
'
q:
D
e
c
a
y
\
/5
D
e
c
a
y
I
IT
A II
D
e
n
o
te
s
Ma
jor
B
ra
n
c
h
1
8
5
J .■^
'0
I o
1
3
5
1
4
0
1
4
5
i
i
i33
s o t) c: o
o
to F ig u re l. t: T h e n a tu ra l d e c a y . se ri es of ^■ ^^ U1.0.1
D istr ib u tio n In th e A tm o sp h er e.
Because of the long residence time of in the atmosphere,which is of the order weeks, it’s horizontal and vertical distributions are the result of the in tegrated effects of the distribution and intensity of the sources, the large scale •motions of the atmosphere and the distribution and intensity of removal pro
cesses. Several series of measurements of the concentration of ^^°Pb in surface air over the world have been summarized by Rangarian [3]. The approximate range of variation in most measurements as a function of latitude is shown in Fig. 1.3. Lowest levels of atmospheric ^^°Pb occur at high latitudes, primarily because of the absence of large land masses and existence of a permanent ice and snow cover, which inhibit ^^^Rn escape from polar lands. Low ^^°Pb con centration also occur over small land areas surrounded by ocean. Midlatitude high values probably reflect the distribution of continental land masses being relatively higher in the northern midlatitudes because of the higher proportion (factor of 3) of land area in the northern hemisphere. The trends apparent in the surface air are also seen in rain (Fig. 1.4)
1.0.2
^^*^Pb in S ed im en ts.
^^®Ra is supplied to lake and sea sediments as part of the particulate erosive input (pathway A in Fig. 1.2). The ^^°Pb formed by the decay of this radium is termed the supported ^^°Pb, and is normally assumed to be in equilibrium with ^^®Ra. In general however, this equilibrium will be disturbed by a supply of ^^°Pb from other sources. Figure 1.4 outlines the main pathways by which excess ^^°Pb reaches the sediments. These components are identifled as:
Pathway B) Direct atmospheric fallout; It has been discussed before.
Pathway C) Indirect atmospheric fallout:
Atmospheric ^^°Pb also reaches sediments indirectly by the catchment. Al though the distinction may be less clear-cut in practice, it is convenient to separate a CT component which is incorporated into the drainage net
i
§
is:
3
o
c: o
o
is:
F ig u re 1 .2 : T h e p a ll n v a y b y w h ic h ^ '“P b r e a c h e s la k e s e d im e n t 4 ^and follows quickly to the lake, sea and ocean without being detained on solid terrestrial particles and a C2 component which may have along residence time in the catchment before being delivered to the marine basin in association with the erosive input of fine surface particulates to which it is attached.
Pathway D) ^^^Rn decay in the water column:
^^^Rn is delivered to the lake, sea and ocean waters by diffusion from the underlying sediments and decays to ^^°Pb in the water column.
^^°Pb activity (component B,C and D ) in excess of supported activity is called the excess or unsupported ^^‘^Pb. The principle source of unsupported 210pb is generally taken to be direct atmospheric fallout (component B ), al though the importance of the other sources has not been extensively evaluated. Studies by Benninger ‘[4] showed that di.ssolved ^^°Pb in the river waters (com ponent Cl )was quickly removed from solution by suspended particles. Further, stream-born particles (component C2 ) carried away no more than 0.8% of the atmospheric flux of ^^'^Pb which reached the catchment soils. Studies by Ha- mond [9] and Krishnaswamy [11] of the production of ^^^Rn and ^^°Pb in lake, sea and ocean waters (component D ) have indicated that this component too is may be negligible, around two orders of magnitude lower than the atmospheric flux and may be negligible.
1.0.3
G eo ch ro n o lo g y w ith
Three conditions are of fundamental importance in the development of a geochronol ogy:
1) The growth or accumulation of material must be ordered in time. While the rate of growth itself may be variable there must be some definite corre spondence between a given part, such as a section of coal or layer of sediment and the time of i t ’s formation as a discrete entity.
5 0 2 0 O O O
\
Ea
CL o <M 1 0i
■P3 !2 :O -t) ■c
:
:o s
t-1o
L A T IT U D E F ig u re 1 .3 : W o rl d -w id e d is tr ib u ti o n of ^^ °P b in su rf a c e a ir F ig u re 1 .4 : W o rl d -w id e d is tr ib u ti o n o f ^^ °P b in r a inOi
2) Some component which can serve as a measure of time must be incor porated into the growing part in such a way that i t ’s association is preserved in time. Ideally this condition would involve complete immobilization of time marker in accumulation parts as encountered in the case of varved sediments. On the other hand, ^^°Pb must also have no postdepositional geochemical mo bility within undisturbed sediments.
3) A third requirement concerns the relation between the marker and time.
Not only must the marker be at least relatively immobile, but it must have definite relationship to time.In the case of varved sediments, the relation is clear; the marker characteristics bear a one to one correspondence to sea sonal events. Geochronologies of course may be based also on non-periodic events. Thus the artificial radioactivities ^^^Cs,^^^Am and etc from nuclear detonations during the 20.^^“^ century have provided useful markers bearing a definite relationship to their time of introduction. In contrast natural radioac tive geo chronologies are distinguished by their continuous nature and by the fact that the time marker, at least ideally is not connected to external events at all, but relies on continuous radioactive decay following incorporation into accumulation parts. When the rate of supply of the radioactive marker is con stant in time, the age associated with a given part may be determined from the ratio of i t ’s concentration to that of another part usually the most recent one, whose age is known. Under these circumstances, condition 3 is rigorously met because the marker is an internal clock regulated by nuclear processes which are unaffected by the geochemical environment. Thus for geochronologies in volving the use of a natural radioactive marker, time variation in it ’s rate of supply is an undesired characteristic for which allowance must be made. As the correspondence between inferred internal clock time and real time will be disputed by variations in marker activity resulting from changes in the rate of supply, condition 3 may be restated for natural radioactive geochronologies. Thus optimum conditions for natural radioactive geochronologies are:
1) Growth or accumulation order in time. 2) Spatial localization of the time marker. 3) Known time variation in marker supply rate.
In dating by ^^°Pb, it is the unsupported component only which is used since once incorporated in the sediment, it decays exponentially with time in
CHAPTER 1. INTRODUCTION
accordance with i t ’s half-life. The supported activity is estimated by assay of the ^^®Ra. Although diffusion through the sediments may re sult in a minor disequilibrium between ^^®Ra and supported ^^°Pb near the sediment-water interface, the total ^^°Pb activity is well in excess of the ^^®Ra activity,and a correction for this will generally be negligible. The unsupported ^^°Pb can be determined by subti'action of supported part from the total ^^°Pb activity, ideally, total ^^°Pb and ^^*^Ra-assays should be carried out on every sample. In practice, total ^^°Pb determinations may be scattered down a pro file with intervening levels which are unanalyzed, and supported component is often estimated from only two or three ^^*’Ra determinations, from amalga mated samples, or simply from the total ^^°Pb activity of sediments too old to given any significant disintegration from unsupported ^^°Pb.
1.0.4
M e th o d for th e d ete rm in a tio n o f
In general there are three different ways of measuring the ^^°Pb activity; 1) Measuring the very energetic 0 emission {Emax=^AlmeV) from ^^°Bi (¿i/2= 5d) decay
2) Measuring the a particles from ^^°Po (¿i/2=138d) decay 3) Measuring the 7 emission (E=0.047meV) from ^^°Pb decay
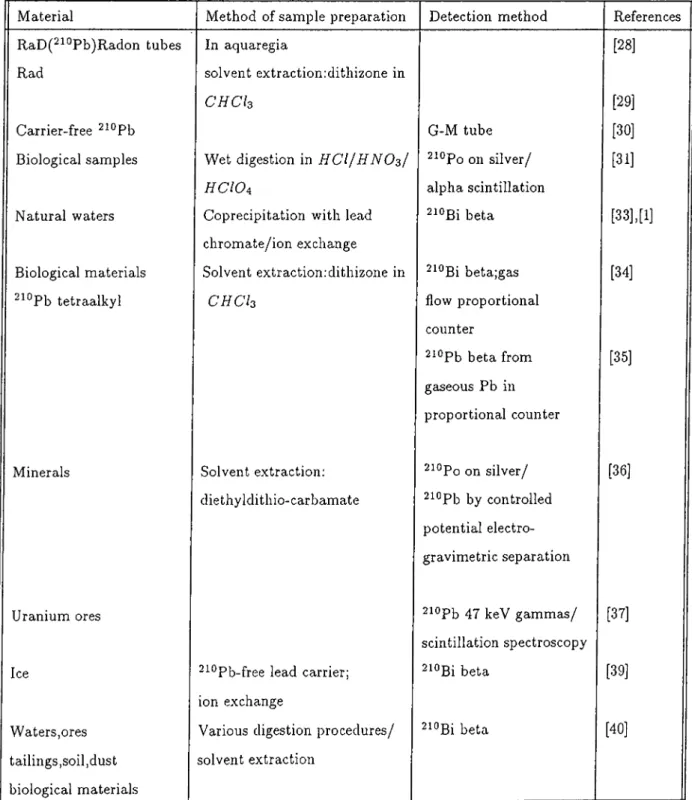
Table 1.1 presents the various techniques for measuring the ^^‘^Pb activity. The list is not exclusive but illustrates the range of materials and methods employed and mostly includes references where the analytical procedures are of primary importance.
1)0 C o u n tin g M e th o d :
Because of the short half life of ^^°Bi, comparatively little time is required to assume partial equilibrium between ^^°Bi and ^^°Pb in the 0 counting method. In determining the activity of ^^°Bi, both ^^°Pb and stable lead are isolated from samples by selective extraction or coprecipitation procedures, and ^^°Bi is subsequently separated in a second step. Two separations are usually required to ensure radiochemical purity for 0 counting. With the development of low background 0 counting, this method has been commonly used, particularly when prompt determinations are desired [12]. In 1975 Karamanos [13] has reported the use of Cerenkov radiation to detect the energetic 0 particles of
This method would seem to offer a great advantage in terms of sample preparation because accurate measurement of ^^°Bi can be made in the presence of the other decay products such as and ^^°Po. Cerenkov detectors are insensitive both to weak ¡3 emission and to a. particles.
2)oc C o u n tin g M e th o d :
To determine the ^^°Pb on the basis of the a activity of ^^°Po, several measurements spaced over a period of months may be necessary to distinguish supported from unsupported ^^°Po activity. ^^°Po is often separated from the sample by spontaneous electrodeposition on silver, nickel, or other metals and the activity of deposited ^^°Po measured by proportional gas counters or by a spectroscopy. This latter method is necessary in order to resolve a ’s of ^°®Po or ^°®Po when either of these isotopes is used as tracer to provide a control on chemical yields and counting efficiency. The a counting methods are superior to the ß method in terms of their low detection limit i.e O.Olpci [12].In 1968 Flynn [15] has studied the effect of interfering ions on the plating of ^^°Po on the silver discs. There is a discussion of the methods and factors effecting the spontaneous plating of ^^°Po on silver and nickel in the study by Mattsson [16]. Details of experimental methods for analysis of water and plankton samples and data reduction procedures can be found in the studies of Benninger [17] and Bacon [19].
3) 7 C o u n tin g M e th o d :
The levels of excess ’-^^^Pb present in the sediments may also be ascertained via direct counting of i t ’s 7 emission [15-20]. In 1976 Gaggeler [15] has used the low energy 7 (below 500 keV), detected by high resolution 7 spectroscopy with a Ge(Li) detector/M ultichannel Analyzer system. A generally unrecognized advantage of this nondistructive approach is the simultaneous determination of ^^®Ra which facilitates derivation of reliable excess ^^°Pb values and also determination of ^^^Cs (ii/2= 30.1yr), a fallout nucleus which may be used for checking the results obtained by the ^^°Pb technique.
1.0.5
M a th e m a tic a l M od els:
When a dating technique is based on the decay of a radionuclide, one makes two main assumptions;
CHAPTER 1. INTRODUCTION 10
1) The flux of radionuclide to the sediment-water interface has remained con stant.
2) No post-depositional migration of the radionuclide has occurred over the dating interval.
Under these assumptions the activity of the nuclide in the sediment at any depth z is given by
A[t) — Ao-t-X.t (1.1)
Where,
Ao = the activity of the radionuclide in dpm /g at t =0 A = decay constant
t = time
since no post-depositional migration is assumed, time t may be written as
t = z /s (1.2)
Where;
z = depth in sediment in cm s = sedimentation rate in cm.yr“ ^
Equation 1.1 then becomes
A(z) = (1.3)
If the initial activity Aq is assumed to be constant which implies that apart from the flux of the radionuclide, the sedimentation rate s is also constant, then a semilogarithmic plot of A(z) versus z should give a straight line with an intercept of log Ao and a slope of -A/s. From the slope, the sedimentation rate s may be determined. Since the initial activity Ao is assumed to be constant
this model is referred to as the Constant Initial Concentration (C.I.C) model. W ith increasing depth sediments are subjected to significant compaction over the depth range for which the method is useful. In order to correct for the compaction effect, one can develop the models in terms of mass depth m(z) (g.cm“ ^) instead of depth, z (cm) and sediment accumulation rate, r (g.cm“ ^.yr~^) instead of sedimentation rate s (cm.yr“ ^). Mass depth, m(z) can be computed from the porosity profile. Since porosity changes with depth, each sediment section Az, should be corrected for compaction according to the equation below [61] ;
Am = N z.{\ — ^z)-Ps (1.4)
where:
Am; Weight of the each section in g.cm~^ Az: The thickness of each section in cm
Porosity of sediment at depth z (the percentage of water content) The mean density of sediment solid (2.5-2.6 g.cm“^)
Another way of taking the compaction effect into account is to correct for linear depth, z by using the porosity result of each sediment section Az [53]
A z = A z .—---f A z
1 - <i>o (1.5)
where:
A z: The corrected thickness of each section in cm $ 0^ The porosity of sediment at depth z=0
If only a constant flux is assumed with a variable sedimentation rate, the corresponding model is called Constant Rate of Supply (C.R.S.) model. Ac cording to this model the unsupported ^^°Pb activity vertically integrated to the mass depth, m must be equal to the flux of the unsupported ^^°Pb inte grated over the corresponding time interval. Thus
nn ft
CHAPTER 1. INTRODUCTION 12
Where ¡jl is the variable of integration in the units of g.cm“^ and P is the atmospheric flux of unsupported since P is constant
TOO
5^ ( 00) = / yl(/i)d/i = P/A
J O
(1.7)
Thus the age-depth relationship using Equation 1.6 and 1.7 is given by
Material Method of sample preparation Detection method References
RaD(^^°Pb)Raclon tubes In aquaregia [28]
Rad solvent extractionidithizone in
C H C I3 [29]
Carrier-free ^^°Pb G-M tube [30]
Biological samples Wet digestion in H C l f H N O s I ^^°Po on silver/ [31]
H C I Oa alpha scintillation
Natural waters Coprecipitation with lead
chromate/ion exchange
2i0ßi beta [33],[1]
Biological materials Solvent extractionrdithizone in ^^°Bi beta;gas [34]
^^®Pb tetraalkyl C H C h flow proportional
counter
^^^Pb beta from gaseous Pb in proportional counter
[35]
Minerals Solvent extraction: ^^°Po on silver/ [36]
diethyldithio-carbamate ^^°Pb by controlled
potential electro- gravimetric separation
Uranium ores 2iopb 4 7 keV gammcLs/ [37]
scintillation spectroscopy
Ice ^^^Pb-free lead carrier; ^^°Bi beta [39]
ion exchange
Waters,ores Various digestion procedures/ 2iOBi beta [40]
tailings,soil,dust biological materials
solvent extraction
CHAPTER 1. INTRODUCTION 14
Material Method of sample preparation Detection method References
Ice Coprecipitation of polonium- ^^°Po on silver/ [41]
sulfide with lead semi-conductor alpha
spectroscopy
• Exposed air filters ^^^Pb/delayed-coincidence
scillintation counts 2i4Bi-2i4po alpha pair
[42]
Exposed air filters ^^^Pb/delayed-coincidence [43]
Environmental samples Digestion with H F / H N O3 ^^°Po on silver/interferences [15]
rocks and ores studied
Biological samples Low temperature ashing:
residue in ifCZ/diethyl- dithiocarbamate extraction
^^°Bi beta/^^^Pb tracer [44]
Wood Wet a s h i n g ' . H N O s / H C l O A ^^°Po on silver [45]
Sea water Solvent extraction: ^^°Po on silver/zinc-sulfide [46]
APDC-MIBK scintillation
Sediments H C l digestion,Pb carrier
also selective extraction
with N a EDTA
2i0ßi beta [2]
Seawter Ferric hydroxide scavenging
on synthetic fibers
[47]
Sea water Coprecipitation with C a C O s ^^°Pb on silver/both
proportional counting and alpha spectroscopy
[49],[50]
Sediments Wet ashed with ^^°Pb on silver/alpha [51]
H C I Oa/ H N Os spectroscopy/^^°Pb tracer
Water/plankton Iron and lead carriers ^^°Po on silver/alpha [52]
for water/wet digestion spectroscopy/^°®Pb tracer [17]
in H N OsI H C I I H C WaI H F
for phytoplankton
[53]
Sea water/sediments Electrodeposition Multiple instrumentation [56]
and isotope dilution for many uranium/
thorium series nuclides
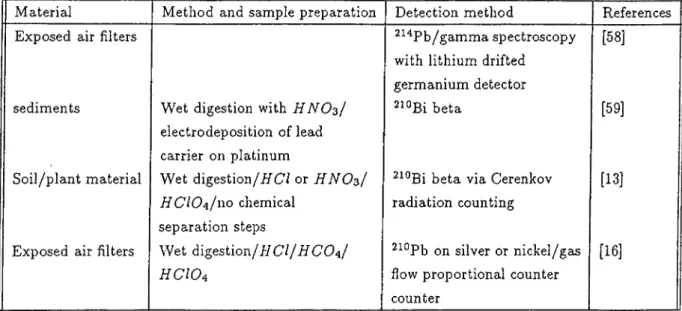
Material Method and sample preparation Detection method References
Exposed air filters ^^"^Pb/gamma spectroscopy
with lithium drifted germanium detector
[58]
sediments Wet digestion with H N O3/
electrodeposition of lead carrier on platinum
^^°Bi beta [59]
Soil/plant material Wet digestion/i/C / or H N O3/
H C I O4 / 1 1 0 chemical
separation steps
beta via Cerenkov radiation counting
[13]
Exposed air filters Wet d i g e s t i o n / H C I / H C O4/
H C I O4
^^®Pb on silver or nickel/gas flow proportional counter counter
[16]
TABLE 1.1 continued
If sedimentation rate, s and linear depth, z are replaced by sediment ac cumulation rate, r and mass depth, m respectively the Equation 1.3 can be written as follow:
A{m) = (1.9)
In the Constant Initial Concentration model the initial activity Aq is equal to P /r where P is the input flux of unsupported ^^°Pb in dpm.cm"^
Chapter 2
EXPERIMENTAL
In this work the activity was d instrumentally determined without sep aration by observing the 46.5 keV (4%) gamma line arising from the decay of ^^°Pb with a High Purity Germanium Coaxial Detector and Multichannel Analyzer. A drawing of the detector system is shown in Fig. 2.1. Detector was a p-type germanium detector with Aluminum end cup and its useful energy range was from 40 keV to 10 MeV. The outside diameter of end cup is 76 mm and its thickness is 1 mm . The front window of end cup had a 0.5 mm thickness. The characteristics of the crystal are listed below:
Diameter: Length:
Active volume:
Germanium head layer thickness: Detector to window distance:
50 mm 48 mm 9200 mm2 600 ¡JLXÍi < 5 mm
The performance specifications of High Purity Germanium Coaxial Detec tor for the 122 keV gamma ray of ^^^Co and 1.33 MeV gamma ray of ®°Co are listed as follows:
CHAPTER 2. EXPERIMENTAL 18
1.33 MeV FWHM: 1.90 keV
FW TM/FW HM: 1.90
Peak to compton ratio: 44:1
122 keV FWHM: 900 eV
The Multichannel Analyzer used in this work was a microprocessor based stand alone analyzer. It provides complete data acquisition, storage, display, manipulation and input/output capabilities. An optional floppy disk data stor age was available for the system, which was capable of storing fifteen 4096 channel spectra on each diskette. The disk system was compatible with IBM DOS version 2.00 which means that data stored on the disk may be retrieved and used by any IBM compatible computer, which used DOS version 2.00. The diskettes must be double-sided, double-density and soft-sectored
The dried and powdered samj^les were stored in closed beakers for about one month to ensure equilibrium between ^^*^Ra and ^^°Pb, which grow in with the 3.85 days half life of ^^^Rn. One to ten grams of dried samples in counting vial ( a polystyrene cup with a diameter of 50 mm) were counted for 2.5x10® sec. the (/ammo-peaks 46.5, 351.9 and 661.6 keV energies belonging to the decay of ^^°Pb, ^^®Ra and ^^^Cs were observed by placing the counting vial directly on the detector.
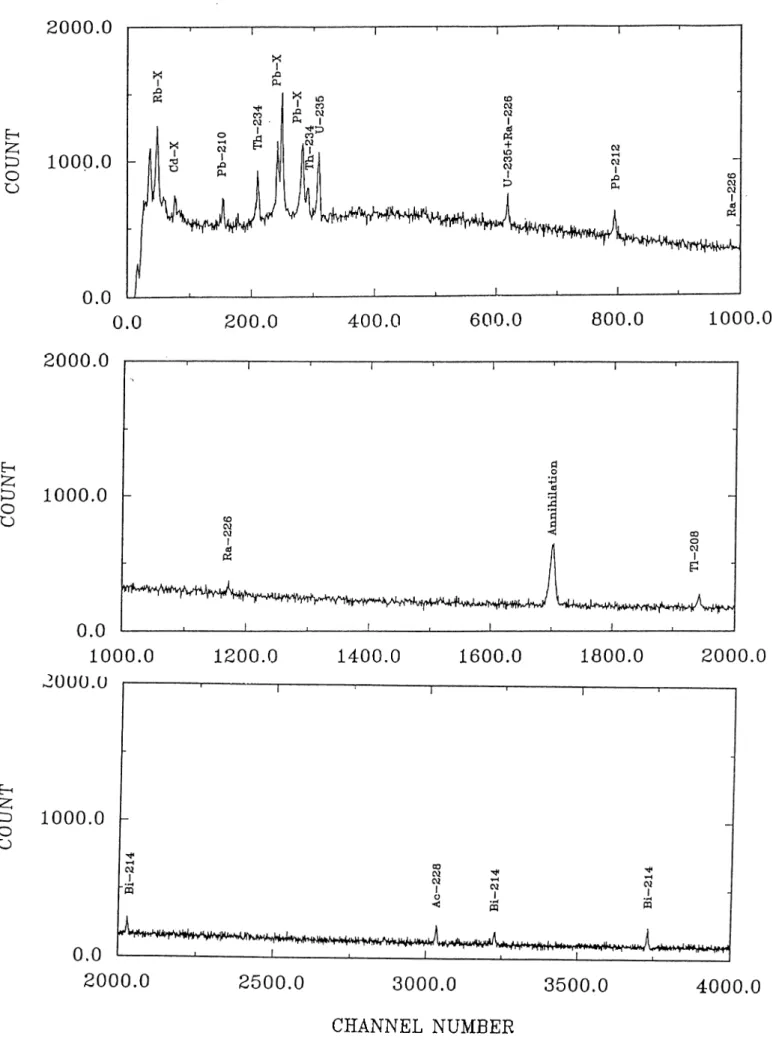
In order to minimize background activity the detector was shielded by a lead cylinder with a length of 420 mm, thickness of 90 mm and a diameter of 210 mm. In all of the measurements, the effect of self absorption was assumed to be negligible since the thin sediment samples of about 2 mm were used in all cases. For all of the measurements, the Background spectrum was counted for 6.0x10® sec. and it is illustrated in Fig.2.2. The 7 peaks of the background spectrum were identified and they are listed in Table 2.1. In the all of the measurements the background spectrum was subtracted from each spectrum.
Energy keV Count rate lO-^s-^ Radionuclide 11.77 78.00 Rb-x 23.25 4.47 Cd-x 46.64 5.94 210pb 63.53 9.85 234Th 74.31 44.06 Pb-x 84.92 13.79 Pb-x 92.73 14.62 234Th 144.22 2.26 ¿55 и 185.73 6.24 235U^226j^a 238.13 3.74 212pb 295.93 1.85 214pb 351.68 2.79 214pb 511.34 30.57 Annihilation 583.66 2.90 208'pi 609.57 4.72 214ВІ 728.15 0.63 214ВІ 795.57 0.46 228Ac 861.42 0.84 208^1 912.05 6.07 ■'28Ac 935.39 0.57 214ВІ 964.97 1.09 1121.18 5.23 214ВІ 1156.73 0.66 214ВІ
Table 2.1: The list of the 7 rays of the background spectrum belonging to the natural radionuclides obtained with a High-purity Germanium detector.The gain of the Multichannel analyzer was chosen as 0.300 keV/channel.
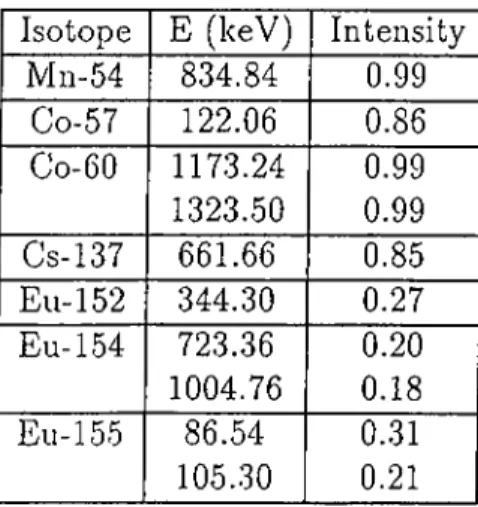
The gain of the Multichannel Analyzer set at 0.300 keV/channel. The En ergy and Efficiency calibrations of the detector were carried out before sample countings using the following calibration sources:
CHAPTER 2. EXPERIMENTAL 20
Isotope E (keV) Intensity
Mn-54 834.84 0.99 Co-57 122.06 0.86 Co-60 1173.24 0.99 1323.50 0.99 Cs-137 661.66 0.85 Ell-152 344.30 0.27 Eu-154 723.36 0.20 1004.76 0.18 Eu-155 86.54 0.31 105.30 0.21
Table 2.2: The list of radionuclides used in the Energy and Efficiency calibra tions of the detector.
Figure 2.3 and Figure 2.4 illustrate the energy and efficiency calibrations respectively. The energy calibration curve show a linear relation of the photon energy with the channel numbers. For the efficiency calibration three different source-detector geometry were chosen:
a) source-detector distance is 19.60 cm. b) source-detector distance is 12.10 cm. c) source-detector distance is 0.610 cm.
From the Efficiency calibration curve it is concluded that the efficiency of the detector is inversely proportional to the source-detector distance. Another observation that can be considered from efficiency calibration is that in the all of the source-detector geometries the efficiency of the detector is maximum at a certain range of the energy. In the a and b cases the maximum efficiency can obtained at 70 keV-80 keV range but in the c case this range is shifted to 100 keV-110 keV range.
Sediment samples were obtained using a gravity corer (Benthos, Inc). The samples were stored vertically at 4°C and later extruded and sampled at 1 cm intervals for the cores from Spain and Turkey and 0.5 cm intervals for the cores from Cyprus. Fixed volume sediment subsamples were dried at 110°C for up to 48 hours prior to analysis and percentage dry weight was recorded. These values together with wet weights were used to calculate the porosity. Table 2.3 shows sample stations, sampling depth. Latitude, Longitude, and sampling date of the analyzed cores.
Sampling Station Sampling depth (cm) Latitude Longitude Sampling Date
Core 2 (Turkey) 53 36 33 33 34 16 48 Sept/1984
Core 3 (Turkey) 83 36 32 18 34 18 30 Sept/1984
Core 35 (Turkey) 180 36 28 06 34 22 30 Oct/1984
Core BC-1 (Spain) 33 - - 1986
Core BC-6A (Spain) 33 - - 1986
Core KS-IA (Cyprus) 14 - - 1991
Core KS-2A (Cyprus) 12 - - 1991
Table 2.3: Coring coordinates and sampling date of the sediments taken from the coasts of Spain, Turkey and Cyprus.
CHAPTER 2. EXPERIMENTAL 22
CHANNEL NUMBER
Figure 2.2: Spectrum of the natural background obtained by with a High-purity Germanium detector. The detector was shielded a lead cylinder with a length of 420 mm, thickness of 90 mm and a diameter of 210 mm. The gain of the multichannel analyzer was set at 0.300 keV/channel.The counting time was 8.0x 10® sec.
CHANNEL NUMBER
Figure 2.3: Energy Calibration of the High-purity Germanium detector using the calibration sources given in the Table 2.2. The gain of the multichannel analyzer was set at 0.300 keV/channel.Energy given in keV.
CHAPTER 2. EXPERIMENTAL 24
ENERGY (keV)
Figure 2.4: Efficiency Calibration for three different source-detector geome- try.a) source-detector distance was 19.60 cm. b) source-detector distance was 12.10 cm. c) source-detector distance was 0.61 cm. The gain of the multichan nel analyzer was set at 0.300 keV/channel.
RESULT AND DISCUSSION
A typical 7 ray spectrum of the sediments taken from the southern coasts of Spain is shown in Fig.3.1. An inspection of the spectrum shows that the photo peaks belonging to and ^^*^Ra are well resolved from major potential interfering contributions from naturally occurring radionuclides. Among the five 7 emissions accumpaying the decay of ^^®Ra, only the one at 185.2 keV is not resolvable on the detector used, from the 185.7 keV 7 emission from 235pj 226j^^ measured via the 295.2 (19.2%) or 351.9 (37.1%) keV 7 emissions of ^^'‘Pb. The one at 351.9 keV provides better sensitivity due to higher emission probability and the lower background in the spectral region. The Activity of the total ^^°Pb was determined by using 46.5 keV gamma peak (4.06%). Unlike most other reported studies on ^^°Pb dating where the level of supported ^^°Pb is inferred from few measurements on much deeper sections in the sediment core, we were able to estimate the level of ^^®Ra in each section simultaneously. So the unsupported amount of ^^°Pb in each partition may be computed by subtracting the activity of ^^®Ra from the total activity of ^^°Pb. The errors in the unsupported ^^°Pb activities reported include the propagated errors of the total and supported parts.
The efficiency calibration was carried out by using a standard solution, to compute the efficiency of the detector with respect to ^^°Pb and ^^®Ra isotopes for the counting position at which all the samples were analyzed. Five grams of an inactive matrix was mixed with a known activity of standard solutions and the corresponding efficiency at the given geometry were found as 15.6% and 4.45% for ^^°Pb and ^^*^Ra respectively.
CHAPTER 3. RESULT AND DISCUSSION 26
CHANNEL NUMBER
Figure 9: The 7 ray spectrum of the sediment at the top section of BC-1 core taken from southern coast of Spain.The counting time was 2.5x10^ sec.
3 .0 .6
C ores ta k e n from th e so u th ern co a st o f Spain:
The sediments cores were collected at two station (BC-1 and BC-6A) from southern coast of Spain (Fig.3.2). The pH and tem perature profile and the result of vertical distribution of Ni, Cu, Ag, Zn, Cd, Pb, P, Al, La, Tl, V, Cr, • Mo, Mn, Fe, Co, Li, Va, K, Rb, Be, Mg, Ca, Sr and Ba (the concentration ex pressed in ppm.) in BC-1 and BC-6a cores are summarized in Appendix. The chemical analysis was done using Inductively Coupled Plasma Atomic Emis sion Spectroscopy (ICP/A ES) by Prof. G.Evans at the Geological Department of Imperial Collage,London.
The corrected depth, z and mass,depth, m of each section of BC-1 and BC- 6A cores was calculated from corresponding porosity data using Equation 1.4 and 1.5 and they are listed in Table 3.1. The result of activity measurements for BC-1 and BC-6A cores are summarized in Table 3.2. Figure 3.5 shows the distribution of ^^®Ra in BC-1 and BC-6A cores. The ^^®Ra activity remains constant in the both cores for the depth of 50 cm. Total ^^°Pb activity profile in BC-1 and BC-6A cores are shown in Fig.3.4.
The totaP^°Pb activity in BC-1 core decreases with increasing of the depth and reaches equilibrium under the depth of 15 cm. A weighted least square fit (with weights inversely proportional to the square of estimated uncertian- ity in each data point.) of unsupported activity as a function of corrected depth, z for BC-1 core, leads to a sedimentation rate of 0.842±0.074 cm.y“ ^ or 0.213db0.019 g.cm“ ^.y“ L One can also calculate the flu.x of unsupported ^^°Pb as 0.740±0.007 pCi.cm “ ^.y“ ^ using Equation 1.8. The value obtained is higher than the value reported in the literature as 0.360-0.450 pCi.cm"".y“ ^ [8]
CHAPTER 3. RESULT AND DISCUSSION 28
• G
Figure 3.2: Coring locations of the BC -1 and BC-6A cores taken from southern coast of Spain.
Depth cm BC-1 BC-6A Porosity <t>U) Corrected depth z cm Mass depth m g.cm“^ Porosity <t>U) Corrected depth z cm Mass depth m g.cm“^ 1 0.95 1.19 0.16 0.910 1.13 0.26 2 0.95 2.38 0.31 0.910 2.50 0.53 3 0.94 3.74 0.51 0.91 3.69 0.82 4 0.94 5.17 0.73 0.90 4.94 1.14 5 0.93 6.93 1.07 0.90 6.24 1.50 6 0.92 8.83 1.47 0.89 7.59 1.88 7 0.92 10.83 1.90 0.79 10.23 3.33 8 0.91 12.98 2.41 0.87 11.83 3.86 9 0.91 15.19 2.94 0.88 13.33 4.33 10 0.91 17.45 3.50 0.80 15.83 0.56 11 0.91 19.71 4.06 0.88 17.33 6.16 12 0.89 22.33 4.81 0.88 18.83 6.69 13 0.88 25.31 5.78 0.89 20.21 7.09 14 0.89 28.02 6.58 0.90 21.46 7.41 15 0.90 30.48 7.24 0.89 22.83 9.13 16 0.90 32.81 7.83 0.87 24.46 9.68 17 0.91 35.02 8.37 0.92 25.46 9.89 18 0.91 37.24 8.90 0.88 26.96 10.42 19 0.91 39.45 9.44 0.81 29.33 11.59 20 0.90 41.93 10.11 0.88 30.83 12.13 21 0.89 44.64 10.91 0.87 32.46 12.68 ,22 0.89 47.35 11.72 0.85 34.33 13.41 23 0.89 50.07 12.52 0.85 36.21 14.14 24 0.88 53.04 13.49 0.78 38.96 15.71 25 0.87 56.26 14.62 0.83 41.08 16.65 26 0.87 59.48 15.74 0.82 43.33 17.70 27 0.87 62.69 16.87 0.70 47.081 20.63 28 0.88 65.64 17.82 0.83 49.21 21.58 29 0.89 68.35 18.62 0.84 50.21 22.40
Table 3.4: Porosity,corrected depth and mass depth data of BC-1 and BC-6A Cores.
CHAPTER 3. RESULT AND DISCUSSION 30 Depth cm BC-1 dpm /g ^^^OPbsupp. dpm /g ^^^°Pbun,upp. dpm /g BC-6A ^^^°PbTct. dpm /g A ^^°PbSupp. dpm /g P^U nsupp. dpm /g 1 11.33±0.94 3.20±0.32 8.13±0.99 25.89±2.43 3.25±0.09 21.65±2.52 9.72±0.94 0.52±0.09 9.20±0.95 5.00±0.58 4.02±0.38 0.98±0.71 7.06±0.68 4.80±0.51 2.26±0.44 4.62±0.50 0.77±0.10 3.85±0.51 4.09±0.71 2.80±0.47 1.28±0.85 3.07±0.32 2.97±0.38 0.10±0.49 5.91±0.81 4.38±0.32 1.53±0.87 9.72±0.88 2.04±0.28 7.68±0.93 5.23±1.14 4.17±0.56 1.06Ü.28 6.33±0.77 3.72±0.39 2.61±0.86 4.39±0.85 3.25±0.33 1.14±0.92 2.27±0.25 2.06±0.26 0.22±0.36 4.88±0.67 1.12±0.34 3.76±0.74 1.21± 0.12 1.32±0.16 5.21±1.11 1.32±0.36 3.89±1.15 10 3.11±0.32 1.43±0.31 1.68±0.44 4.10±0.72 2.66±0.43 1.44±0.84 11 1.59±0.01 3.33±0.38 5.94±0.77 4.12±0.31 1.82±0.83 12 2.99±0.28 6.72±0.62 3.82±0.23 2.90±0.67 13 1.24±0.14 0.80±0.14 0.44±0.14 2.00±0.75 0.52±0.30 1.48±0.65 14 4.43±0.52 0.60±0.08 3.83±0.52 8.06±1.20 1.12±0.22 6.87±1.23 15 1.26±0.14 2.17dz0.31 16.30db0.99 3.70±0.42 12.61±1.07
16 1.95±0.19 0.43±0.06 1.51±0.20 22.63il.68 5.70i0.43 16.94il.73
17 4.40i0.60 0.78i0.11 3.6Ü 0.60 5.47i0.91 5.23i0.44 0.234il.04
18 3.63i0.71 4.4Ü 0.46
19 3.37i0.37 3.18i0.34 0.19i0.51 2.37i0.72 1.95i0.33 0.4Ü0.79
20 3.58i0.43 1.4Ü 0.19 2.18i0.47 ll.2 6 il.2 6 4.24i0.31 7.02il.36
21 2.39i0.22 5.96i0.59 10.22i2.24 10.38i0.97
22 0.76i0.08 1.8Ü 0.22 7 .6 7 i l.l l 1.89i0.45 5.78il.20
Table 3.5: Result of Activity measurements of Total Supported ^^°Pb and Unsupported ^^°Pb for BC-1 and BC-6A Cores.The unit of the activities are expressed by disintegration per minute for one gram of dried sample. The weighted average of Supported ^^°Pb activity for BC-1 and BC-6A cores is computed as 2.23i0.07 and 3.18i0.08 respectively.
The distribution of total ^^°Pb activity in BC-6A core shows nearly con stant ^^°Pb activity which increases at lower depth (under 30 cm).For this reason no sedimentation rate can be determined using Constant Initial Con centration model and calculation of a ^^°Pb chronology by any model other than Constant Rate of Supply model was not feasible.
The observation of plateau region in ^^°Pb profile for BC-6A core is thought to occur from the nearness of BC-6A core to the shore where the sediments may be mixed and redistributed by physical mixing which is more effective at the inshore regions.
DepLli ( c m )
D ep th ( c m )
Figure 3.3: Porosity, and Mass depth, ni (g.cm ^) profiles of BC-1 and BC-6A Cores.D:BC-l.A:BC-6A.
CHAPTER 3. RESULT AND DISCUSSION 32
Beside the physical mixing, biological mixing [5],[6] should be taken in ac count. There is a high amount of organic carbon in the average magnitude of about 5% and 3% in the top and deep sections respectively (Table 4.2 Ap pendix) which indicate the existence of microorganisms.
The reason of the increasing ^^°Pb activity in the deep sediments could be explained by the effect of surface area of these sections on the adsorption and ion exchange capacities of the sediments. The high surface area provides high adsorption and ion exchange capacities for ^^°Pb and so increases the ^^°Pb activity in such a region.[60]
The Percentage of the ^^'^Pb inventory in BC-1 and BC-6A cores are com puted from the equation bellow:
Vo Inventor y J2 ^m .A u n
$/A X 100 (3.10)
Where:
Am.y4[/„iupp.=Total integrated unsupported ^^°Pb activity in dpm.cm"^ # = Atmospheric flux of ^^°Pb in dpm .cm ~ ^.yh
A=Decay constant of ^^°Pb in y~^.
By assuming that the annual atmospheric flux of unsupported ^^°Pb is 0.9 dpm .cm “V~^ [57], the inventory of BC-1 and BC-6A cores were computed as 107% and 160% respectively.
Although in the BC-1 core, all of the atmospheric inventory seems to be collected , the assuming annual atmospheric flux of ^^°Pb may not be a proper value for calculating the percentage of ^^°Pb inventory in this region. The ab normally high inventory of BC-6A core is also a reason for such a conclusion. An explanation for having such a high inventory may be from the existence of a atmospheric flux higher than 0.9 dpm.cm~^.y“^ in those cores. Another
possible reason for such a behavior may be explained from the erosion pro cess, which increases the load of the sediments delivered to the reservoir. As a result of erosion, one can assume that, beside the atmospheric flux of ^^°Pb, there must be another source of ^^°Pb which is carried by the eroded materials.
The Constant Rate of Supply model was used to determine the date of the each section of sediment column taken from BC-1 and BC-6A cores, using Equation 1.5. The result of the age determination of BC-1 and BC-6A cores using Constant Rate of Supply model are summarized in Table 3.3
Depth BC-1 BC-6A cm Date Date yr· yr· 1 1986±2.70 1986db3.12 2 1983±2.85 1985.8T3.13 3 1982±2.86 -4 1980±2.96 1985.4±3.14 5 1980±2.93 1985±3.16 6 1972±3.28 1984.6±3.14 7 1968±3.31 1983T2.96 8 1967±3.28 198Ü3.04 9 - 1979±3.08 10 1964±3.40 1977T3.02 11 - 1975±3.04 12 - 1974±3.10 13 1962±3.49 1973±3.13 14 1946±4.40 1970T3.3 15 - 1962T3.7 16 1944±4.28 1939±5.8 17 1911±6.55 1938T5.8 18 - 1936E4.8 19 1909±6.8 1916±6.4
Table 3.6: The age of the each sediment section is computed from Constant Rate of the Supply model using the Equation.1.5 for BC-1 and BC-6A Cores
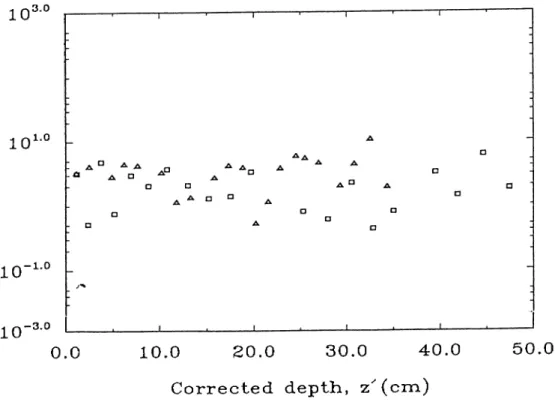
CHAPTER 3. RESULT AND DISCUSSION 34 103.0 101.0 tiO g 10- 1.0 nd § 1 0 "·° > Ü Td o E-H 101.0 10- 1.0 10- 3.0 0.0 10.0 20.0 30.0 40.0 C o r r e c t e d depth, z' ( c m ) 60.0
Figure 3.4: Profile of Total ^^°Pb activity (dpm/g) in the sediments cores taken from the southern coast of Spain.□:BC-1 core, A;BC-6A core.
103.0 101 .0 10- 1.0 10- 3.0 0.0 10.0 20.0 30.0 40.0 50.0 C o r r e c t e d depth, z ^ (c m )
Figure 3.5: Profile of Su2>ported ^^°Pb activity (dpm/g) in sediments cores taken from the southern coeist of Spain.□:BC-1 core, A:BC-6A core.
0.0 10.0 20.0 30.0 40.0
C o r r e c t e d depth, z' (e r a )
50.0
B C - 6 A CORE
C o r r e c t e d depth, z'^(cra)
Figure 3.6: Profile of Unsupporte(i activity (dpm/g) in sediments cores taken from the southern coast of Spain.line is the result of weighted least squaie fit to the unsupported ^^^Pb activity data for BC-1 core^__________
CHAPTER 3. RESULT AND DISCUSSION 36
Figure 3.7 shows the age-depth relation in BC-1 and BC-6A cores. The points represent the result of the age determination of the sediments using Constant Rate of Supply model and the line represents the result of the age determination of the sediments using Constant Initial Concentration model. In the BC-1 core two dating model are in a good agreement with each other. The result of Constant Rate of Supply model shows that in the BC-6A core, there are two different regions, a region which is between 0-20 cm having high sedimentation rate of 1.390±0.118 cm .y ^ (0.500T0.042 g.cm“^y“^) and the one that is below 20 cm having a sedimentation rate of 0.229±0.119 cm.y“ ^ (0.116±0.010 g.cm“^y~^). Depth cm BC-1 BC-6A Ai37Cs dpm/g Ai37Cs dpm/g 1 1.59T0.71 -2 0.420..54 -3 1.49±0.51 -4 0.92T0.56 0.22T0.18 5 1.16±0.56 0.48±0.10 6 1.28T0.56 -7 0.90±0.56 -8 0.67±0.56 0.50T0.10 9 0.70±0.57 -10 0.66T0.56 0.12T0.08 12 - 0.60T0.14 15 - 0.22T0.09 18 - 0.46T0.08 19 - 0.21T0.07
Table 3.7: ^^’^Cs Activity measurement for BC-1 and BC-6A Cores. The result of the ^^^Cs measurements for BC-1 and BC-6A cores are sum marized in Table 3.4. Figure 3.8 shows the distribution of ^^^Cs in the BC-1 and BC-6A cores. There are two maxima in the ^^^Cs activity of BC-1 core.
B C - 1 CORE
0 . 0 1 0 -0 2 0 .0 3 0 .0 C o r r e c t e d depth, ( c m ) 4 0 .0B C - 6 A CORE
C o r r e c t e d d ep th ( c m )tig u re 3.7: The comparison of Constant Rate of Supply and Constant Initial Concentration dating models for BC-1 and BC-6A Cores. The points corre sponds the Constant Rate of Supply model and the line represents the Constant Initial Concentration model
CHAPTER 3. RESULT AND DISCUSSION 38
The first peak located at a depth of about 0.60 cm is thought to be a marker of nuclear weapon and device testing which were restarted in 1963 and the second one at a depth of about 7.90 cm is a marker of the first high-yield thermonuclear tests which took place in 1954. According to the position of peaks in the ^^^Cs activity of the BC-1 core, the sedimentation rate was com puted as 0.8095 cm.y“ ^ or 0.132 g.cm“^.y~^. The sedimentation rate obtained from ^^^Cs profile is in a excellent agreement with value obtained from ^^°Pb method in the BC-1 core. As a result of sedimentation the peak of 1963 should be apparent at deeper section of sediment column, whereas it was observed at top levels. The reason of such a observation may be explained by the loss of sediment material from the upper part of the core during sampling. The other explanation that could be considered is the migration of ^^^Cs from the deeper section to the upper ones.
As it is visualized from Figure 3.8 the ^^^Cs profile did not reveal a clear distribution pattern that could lead to an useful dating for BC-6A core. This behavior of ^'^^Cs distribution in BC-6A core may also be a result of the phys ical and biological mixing processes. Although the sampling time of the both cores coincide with the Chernobyl accident, no high activity was measured in the top section of the sediment column and the reason of that is because there is a time lag, which was computed as 6-12 months [54] between the time of atmospheric deposition of ^^^Cs and the time of deposition of ^^'Cs in sediment profile.
By assuming that the fallout inventory of ^^^Cs was computed as 33 dpm.cm“^ [55], the percentage inventory of ^^^Cs for BC-1 and BC-6A cores were calcu lated as 12.7% and 6.4% respectively. The reason of having low ^^’^Cs inventory in BC-1 and BC-6A cores may be explained by considering the postdeposional mobility of ^^^Cs which cause a penetration of ^^^Cs from the top core to the inner part of the sediment column. The diffusional movement of ^^^Cs in the sediment profile may also cause the migration of the some part of the *^^Cs activity in to the deeper section of sediment column. The dilution of the ^^^Cs activity by the erosion process may be considered as another reason for having such a low inventory.
bX)
a
Oh nd !> o -aJ 2.0 15 -1.0 0.5 -0.0 0.0B C - 1 CORE
5.0 10.0 15.0 C o r r e c t e d d e p th ( e r a ) 20. 0B C - 6 A CORE
tiDa
Oh ncl • i —H > -t-Jo 0.80 -0.60 0.40 -0 . 2 -0 -0.00 0.0 10.0 20.0 C o r r e c t e d d e p th ( c m ) 30.0Figure 3.8: Profiles of in BC-1 and BC-6A Cores. The first and the second peaks could be attributed to fallout from 1963 and 1954 when the nuclear weapon and device testings wei'e occurred