INVESTIGATION OF ELECTRONIC PROPERTIES OF
IONIC LIQUID ELECTROCHEMICAL
DEVICES
BY
X-RAY PHOTOELECTRON SPECTROSCOPY
A DISSERTATION SUBMITED TO
THE GRADUATE SCHOOL OF ENGINEERING AND SCIENCE
OF BILKENT UNIVERSITY
IN PARTIAL FULFILLMENT OF THE REQUIREMENTS FOR
THE DEGREE OF
DOCTOR OF PHILOSOPHY
IN
CHEMISTRY
By
Merve Camcı
December 2016
ii
INVESTIGATION OF ELECTRONIC PROPERTIES OF IONIC LIQUID ELECTROCHEMICAL DEVICES BY X-RAY PHOTOELECTRON SPECTROSCOPY
December, 2016
We certify that we have read this thesis and that in our opinion it is fully adequate, in scope and in quality, as a dissertation of the degree of Doctor of Philosophy.
_______________________ Şefik Süzer (Advisor)
_______________________ Ömer Dağ
_______________________ Coşkun Kocabaş
_______________________
İrem Erel Göktepe
_______________________ Mehmet Fatih Danışman
Approved for the Graduate School of Engineering and Science: _______________________
Ezhan Karasan
iii
ABSTRACT
INVESTIGATION OF ELECTRONIC PROPERTIES OF IONIC
LIQUID ELECTROCHEMICAL DEVICES BY X-RAY
PHOTOELECTRON SPECTROSCOPY
Merve Camcı Ph.D. in Chemistry Advisor: Şefik Süzer
December 2016
Attention towards electrochemical energy storage devices assembled with innovative solvent-free electrolytes ‘ionic liquids’ (ILs) has been progressively rising over the last two decades. In order to design a particular electrochemical device it becomes crucial to understand the structure of interfacial region and the electrical response of ILs. Accordingly, this thesis focuses on X-ray Photoelectron Spectroscopic (XPS) investigations of electrochemical devices containing ILs, that is compatible with ultra high vacuum condition needed for XPS. Towards better understanding the fundamental aspects of certain electrochemical issues, electrochemical devices consisting of two metal-electrodes, which contains N,N – Diethyl -N- methyl -N- (2-methoxyethyl) ammonium bis (trifluoromethanesulfonyl) imide, (DEME-TFSI) IL-electrolyte between them, have been investigated by XPS under external electrical stimuli control, as a novel analytical tool for elucidating; (i) charging/ discharging phenomena, (ii) electrical double layer (EDL) formation and (iii) electrochemical reaction products.
iv
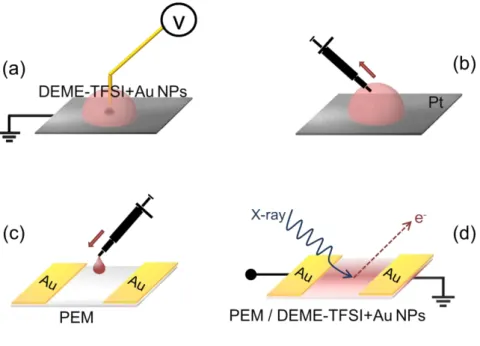
In the first part, a co-planar electrochemical device, with two gold electrodes on porous polyethylene membrane (PEM) plus DEME-TFSI impregnated between the electrodes, has been studied using external DC bias, for recording the position dependent electrical potential variations. In addition, AC bias is used to harvest temporal behavior. For the AC bias a square wave excitation is used, for which two frequencies are adopted corresponding to slow (10 mHz) and fast (1 kHz) time scales, for probing the response of the system at infinite- and zero-time onset, respectively. In all cases XP spectra have been recorded at different lateral positions. As a result of these DC and AC applications a new understanding has surfaced. Accordingly, although at the metal-electrolyte interface the EDL formation is limited to lateral dimensions at the nanometer scale, its visualization through the analysis of the XPS-probed voltage transients can be extended to very large distances from the interface, in the millimeters scale. These responses have also been modeled using a simple equivalent circuit with two oppositely polarized electrodes and an ionic conducting medium in between.
In the second part, re-arrangement of the DEME-TFSI’s ionic constituents at the Au electrode/IL-electrolyte interface has been monitored by the dynamic-XPS approach under application of electrical pulses in the form of a slow (1 mHz) triangular wave with an amplitude of 5V, while recording the intensity fluctuations of the two N1s peaks corresponding to the anionic and the cationic fragments.
In the last part, the externally bias XPS analysis has been used for in-situ and in-vacuo monitoring of anodically triggered electrochemical preparation and characterization of Au NPs in both a co-planar and also in a wire-plane
v
electrode electrochemical geometries. The small sized Au NPs’ formation within the DEME-TFSI medium has been confirmed by the characteristic peak around 470 nm in the Visible spectrum and with the spherical and well-dispersed (~4 nm) particles in TEM images.
Keywords: X-ray Photoelectron Spectroscopy, ionic liquids, electrical double layer, gold nanoparticles, electrochemical reduction, in-situ monitoring of electrochemical reactions
vi
ÖZET
İYONİK SIVILI ELEKTROKİMYASAL AYGITLARIN
ELEKTRONİK ÖZELLİKLERİNİN X-IŞINI FOTOELEKTRON
SPEKTROSKOPİSİYLE İNCELENMESİ
Merve Camcı Kimya, Doktora Tezi Danışman: Şefik Süzer
Aralık 2016
Yeni bir çığır açan solventsiz elektrolitler ‘iyonik sıvılar’ (ILs) ile bir araya getirilmiş/hazırlanmış elektrokimyasal enerji depolama aygıtlarına yönelik olan dikkat son yirmi yılda giderek artmaktadır. Belli bir elektrokimyasal cihaz tasarlamak için, IL'lerin ara yüzlerinin yapısını ve elektriksel tepkisini anlamak çok önemlidir. Buna göre, bu tez X-ışını Fotoelektron Spektroskopisi (XPS) için gerekli olan ultra yüksek vakum koşullarıyla uyumlu bir IL içeren elektrokimyasal cihazların, XPS ile incelenmelerine odaklanmaktadır.
Belirli elektrokimyasal konuların temel özelliklerini daha iyi anlamak için, iki metal elektrotun arasında N, N-Dietil -N-metil -N- (2-metoksietil) amonyum bis (triflorometansülfonil) imid (DEME-TFSI) iyonik sıvı-elektroliti içeren elektrokimyasal aygıtlar, (i) şarj / deşarj fenomenleri, (ii) elektrikli çift katman (EDL) oluşumu ve (iii) elektrokimyasal reaksiyon ürünlerinin analizlerini aydınlatmak için, yaratıcı bir analitik aracı olarak XPS’in harici elektriksel uyarı kontrolü altında incelenmiştir.
vii
İlk bölümde, gözenekli polietilen membran (PEM) üzerinde iki altın metal elektrot bulunan sistemin arasında DEME-TFSI emdirilerek elde edilen bir eş-düzlemsel elektrokimyasal cihaz, pozisyon bağımlı elektriksel potansiyel değişimlerini kaydetmek için, harici D.C. gerilimi uygulanarak çalışılmıştır.Buna ek olarak, A.C. gerilimi zamansal davranışı aydınlatmak için kullanılmıştır. A.C. gerilimi için, sistemin sonsuz- ve sıfır-zaman başlangıcında tepkilerini saptamak için sıra ile yavaş (10 mHz) ve hızlı (1 kHz) zaman ölçeğine karşılık gelen iki frekansın kullanıldığı bir kare dalga uyarımı ile gerçekleştirilir. Her koşulda, XP spektrumları farklı yerel konumlarda kaydedilmiştir. Bu D.C. ve A.C. uygulamalarının bir sonucu olarak yeni bir anlayış ortaya çıkmıştır. Buna göre, metal-elektrolit ara yüzündeki EDL oluşumu yerel boyutlarda nanometre ölçeğinde sınırlı olmasına rağmen, bunun XPS ile algılanan gerilim geçişlerinin analizi yoluyla görselleştirmesi ara yüzeyden milimetre ölçeğindeki çok geniş mesafelere kadar etkili olduğu saptanmıştır. Bu tepkiler aynı zamanda, iki zıt polarize olmuş elektrot ve bunların arasında bir iyonik iletken madde bulunan basit bir eşdeğer devre kullanılarak modellenmiştir.
İkinci bölümde, DEME-TFSI'nin iyonik bileşenlerinin Au elektrot / IL-elektrolit ara yüzünde yeniden düzenlenmesi, dinamik-XPS yaklaşımı ile yavaş (1 mHz) üçgen dalga şeklinde 5V'luk bir genlik elektriksel darbeler uygulaması altında, anyonik ve katyonik fragmanları temsil eden iki N1s tepesinin şiddetlerindeki değişimler kaydederek izlenmiştir.
Son bölümde, harici potansiyel uygulanan XPS analizleri, Au-NP'lerin hem bir eş-düzlemli hem de bir tel ve düzlem-elektrot elektrokimyasal geometrilerinde anodik tetiklemeli elektrokimyasal hazırlanışının gerçek zamanlı ve vakum ortamında izlenimi ve karakterizasyonun için kullanılmıştır.
DEME-viii
TFSI ortamı içindeki küçük boyutlu Au NP'lerin oluşumu Görünür bölgedeki optik spektrumda 470 nm civarındaki karakteristik bir tepe ve TEM görüntülerdeki küresel ve iyi dağılmış (~ 4 nm) parçacıklarla teyit edilmiştir.
Anahtar Kelimeler: X-ışını Fotoelektron Spektroskopisi, iyonik sıvı, elektrikli çift katman, altın nanopartiküller, elektrokimyasal redükleme, electrokimyasal reaksiyonların gerçek zamanlı görüntülenmesi
ix
Acknowledgement
As one-step to the end of my education in Bilkent University, but as the first step in science, I want to express my deepest gratitude and respect to my advisor Prof. Şefik Süzer; he has been always the ‘leading lights’ for me since 2009 through his scientific perception, guidance and tremendous mentoring . I learnt and have been still learning a lot from his enthusiasm and dynamism.
I would like to express my appreciations to Dr. Burak Ülgüt and Dr. Coşkun Kocabaş for their valuable support, provision, collaboration and fruitful discussions during my experiments.
The first person, who I met at the beginning of my chemistry story in Bilkent, was our graceful department secretary Emine Yiğit and many thanks for her support, alliance and assistances in administrative issues.
Special thanks to our present and former group members Pınar Aydoğan Göktürk, who is not only my lab mate but also coffee-mate, holiday-mate, shopping-mate and yoga-mate; and Ahmet Uçar; We laughed a lot, talked a lot, worked a lot, planned and did many unforgettable “a lot” things together and thank you a lot. One more special thanks to my dear friend Seylan Ayan, for her encouragements to continue but not give up and morning coffee chats in the garden.
I am always to be proud of Taners’ daughter and I could not succeed without my dad’s morning reinforcements, my mom’s patience, perception and their endless love. Thank you my Pinokyo for being my blind side…
x
I was 18 years-old when I came from Konya to Bilkent, as I am leaving at the beginning of my 30s with great memories. Whatever or whenever I lived was ephemeral, at the end I was in Bilkent and now I would like to thank you Bilkent, see you soon!
More than a thank you or more than a dedication, I am so glad to have an adorable husband who sweeps every single obstacle from my life-path and comes with a cup of tea or glass of wine while I am studying. We are now turning over a new leaf to Strasbourg and he is again with me…
This PhD work and my daughter were born in August 2012. When I have taken her to the lab, she has asked me for “two or three atoms to do some experiments.” After four years, I am graduating with my daughter from same university so I dedicate this thesis to Asya Masal…
xi
Contents
Chapter 1
11 Introduction 1
1.1 Ionic Liquids and Their Properties 1
1.1.1 Ionic Liquids 1
1.1.2 General Properties of Ionic Liquids 3 1.2 Applications of Ionic Liquids 5 1.2.1 Ionic Liquids in Electrochemical Systems 6
1.2.1.1 Ionic Liquid Interfaces 8
1.2.1.2 Electrode/Ionic Liquid Interface and Electrical Double Layer 10 1.2.2 Ionic Liquids and Metal Nanoparticle Synthesis 16
1.2.2.1 Metal Nanoparticles 17
1.2.2.2 UV-visible Spectra of Metal Nanoparticles 18 1.2.2.3 Transmission Electron Microscopy of Metal Nanoparticles 20 1.2.2.4 Use of Ionic Liquids for Metal Nanoparticle Synhesis 21
xii
1.3 X-ray Photoelectron Spectroscopy and Ionic Liquids 24 1.3.1 Basic Principles of X-ray Photoelectron Spectroscopy 24
1.3.2 Alternative Use of XPS 29
1.3.3 Ionic Liquids and XPS 32
1.3.3.1 In Situ XPS Analysis for Ionic Liquids 34 1.3.3.2 XPS for Ionic Liquid Interfaces 35
1.4 Aim of the Study 37
Chapter 2
392 Experimental 39
2.1 Materials 39
2.2 Instrumentation 40
2.3 Preparation of Ionic Liquid Devices 41 2.4 XPS Analysis of IL Devices 42 2.4.1 Electrode / IL Interfacial Region 43 2.4.2 In Situ Electrochemical Reaction Monitoring with XPS 44
Chapter 3
463 Results and Discussions 46 3.1 XPS Characterizaiton of IL in Electrochemical Device 46 3.2 XPS Study of the Electrified Au Electrode/IL Interface 52 3.2.1 Static XPS Analysis Under D.C. Bias 53 3.2.2 Dynamic XPS Analysis Under A.C. Bias 58
xiii
3.2.3 Current Measurements and Equivalent Circuit Model 63 3.3 XPS Study of Structural Rearrangements in DEME-TFSI at Au Electrode / IL Interface 66 3.4 In Situ Electrochemical Reaction Monitoring by XPS 75 3.4.1 In Situ Electro-Corrosion Monitoring 76 3.4.2 Analysis of Secondary Au Species 81 3.4.3 Role of Electrode’s Nature in Electrochemical Au Nanoparticle
Preparation 84
3.4.4 Electrical Response of Au NPs in DEME-TFSI medium 89
Chapter 4 95
4 Conclusions 95
xiv
List of Figures
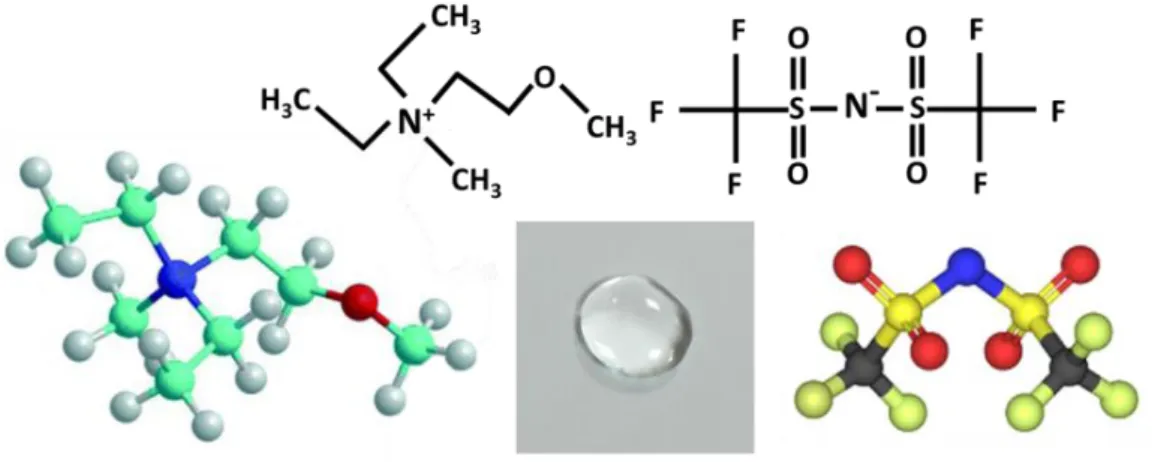
Figure 1. Representative images of potassium bromide salt (KBr) and N,N-Diethyl-N-methyl-N-(2-methoxyethyl)ammonium bis (trifluoromethanesulfonyl) imide (DEME-TFSI) ionic liquid at room temperature with molecular structures. 2
Figure 2. Chemical structures of common cations and anions of ILs. 4
Figure 3. Schematic representation of (a) Classical EDL model and (b) EDL
model for ILs. 13
Figure 4. Schematic representation corresponding to adsorption of incoming radiation I0 through a solution and transmitted light I. 18
Figure 5. XP survey of DEME-TFSI on Au-electrode representing the photoelectrons’ contribution to the spectrum and the detected elements. High resolution Au4f and N1s regions are given inlet. 25
Figure 6. AR-XPS spectra for ionic liquid DEME-TFSI at electron take-off angle normal to the surface θ =0 (left side) and θ=45 (right side). N1s region at two
xv
different electron take-off angles represented together with the schematic
illustration of the AR-XPS method. 28
Figure 7. XPS spectra of a conducting gold metal’s Au4f region when sample is (a) grounded, (b) subjected to +5V and -5V D.C. voltage bias and (c) SQW excitation of 5V amplitude with 1 kHz frequency. 31
Figure 8. Schematic representation of the electrochemical device with IL impregnation from (a) top and (b) bottom of the device. 41
Figure 9. Schematic illustration of experimental set-up to control role of
electrode’s nature. 42
Figure 10. Schematic representation of XPS analysis under external bias
application in source-drain design. 43
Figure 11. Illustration of experimental steps for analysis of electrochemically
prepared Au NPs within the DEME-TFSI. 45
Figure 12. N,N – Diethyl -N- methyl -N- (2-methoxyethyl) ammonium bis (trifluoromethanesulfonyl) (DEME-TFSI) and its molecular structure. 47
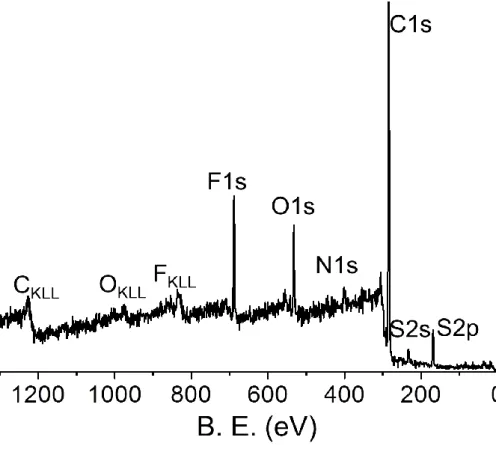
Figure 13. Typical XP survey of ionic liquid DEME-TFSI 48
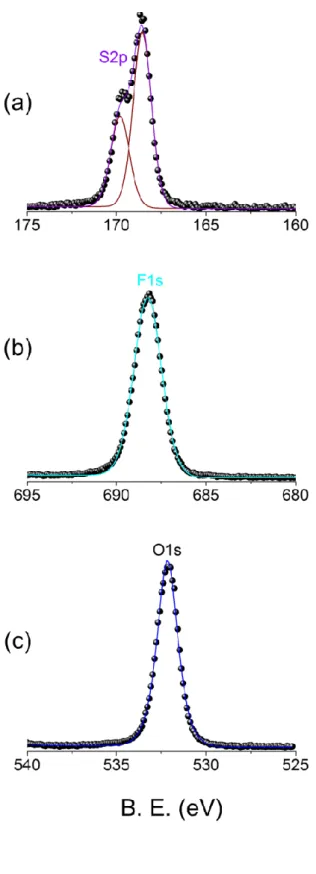
Figure 14. XP spectra of (a) S2p (b) F1s and (c) O1s regions. 49
Figure 15. N1s core level XP spectra of DEME- TFSI representing molecular structure and well-resolved two different nitrogen species. 50
xvi
Figure 17. XP Line Scan spectra of F1s and N1s regions between the electrodes when grounded (a) - (b) and when +5 V is applied to one of the electrodes (c) - (d). N1s region has two peaks corresponding to N- and N+ moieties. 54
Figure 18. XP spectra of Au4f and F1s regions, recorded in the line scan mode between the two gold electrodes, containing a porous polymer film impregnated with the ionic liquid DEME-TFSI, under the application of +3 (upper part) or -3V (lower part) D.C. bias. The IL is thicker in the middle of the device as reflected by the intensity of the F1s spectra chosen at three representative positions along the
line, shown as insets. 55
Figure 19. Schematic representation of two-electrode graphene device and smoothly varying voltage change across the electrodes when source electrode was
exposed to -4V D.C. potential. 56
Figure 20. Time-resolved F1s XP spectra recorded at nine different lateral positions across the metal electrodes with 800 μm step-size between each point. Reproduced by permission of the PCCP Owner Societies. http://pubs.rsc.org/en/content/articlelanding/2016/cp/c6cp04933h#!divAbstract ”
59
Figure 21. Time-resolved XP spectra of F1s region under 10 mHz 5V SQW excitation and recorded at three different lateral positions, corresponding (a) point1, (b) point 4 and (c) point 9 in Figure 20. Schematic representation of potential changes along the channel for positive (left) and negative (right) cycles. “Reproduced by permission of the PCCP Owner Societies. http://pubs.rsc.org/en/content/articlelanding/2016/cp/c6cp04933h#!divAbstract ”
xvii
Figure 22. F1s region recorded in line scan mode across two Au electrodes under under application of (a) 1 kHz SQW with amplitude of 3V (b) +3V D.C. and (c) -3V D.C. Similar data acquired. (d) Simulation of F1s binding energy positions under corresponding electrical stimulus. “Reproduced by permission of the PCCP OwnerSocieties.http://pubs.rsc.org/en/content/articlelanding/2016/cp/c6cp04933h
#!divAbstract ” 62
Figure 23. Measurement of current with respect to time for (a) +3V to 0V and (b)
-3V to 0V potential application. 63
Figure 24. Simulations of potential developed at near electrode region and near ground region under 5V 10 mHz SQW. Equivalent circuit model represents the resistors and capacitors. “Reproduced by permission of the PCCP Owner Societies.http://pubs.rsc.org/en/content/articlelanding/2016/cp/c6cp04933h#!divA
bstract ” 65
Figure 25. Schematic illustration of (a) preparation and impregnation of device (b) XPS analysis in source and drain geometry. 67
Figure 26. Survey XP spectrum of the Ionic Liquid DEME-TEFSI molecular structure and the corresponding N1s region inlet. 68
Figure 27. Time-resolved N1s spectral region while the recorded in the forward and reverse directions, while a 5 V TRW excitation is imposed from one of the metal electrodes. The responses of cationic (pink) and anionic (green) fragments to imposed potential change are illustrated. 70
Figure 28. Extracted B.E. positions of the two N1s peaks, together with computed intensity ratio of them, while a 5 V TRW excitation is imposed from one of the
xviii
Figure 29. Time-resolved Au4f and N1s spectral regions while the recorded in the forward direction while a 5 V TRW excitation is imposed from one of the metal electrodes and extracted B.E. positions of the Au4f7/2 and N1sA peaks, together
with computed intensity ratio. 73
Figure 30. Evaluated data for Au4f and N1s spectral regions representing the residual sum of squares and slopes together with standard deviations. 74
Figure 31. XP spectrum of Au4f region, recorded in the line scan mode from source towards drain electrodes;(a)at the beginning of the experiment (t=0), after (b)3.5 hours (t=3.5 h),(c) 6 hours (t=6 h) and (d)14 hours (t=14 h) during the continuous application of +3V D.C. external potential. Schematic illustration represents the line scan direction and the source - drain geometry including the
electrical connections. 77
Figure 32. XP line spectrum recorded (a) at the beginning of experiment and (b) after 14 hours same in the Figure 27 (a) and (d). Normalized Au 4f spectra from the two points on the line at different positions are given in; (c)at 500 µm and (d) at 6000 µm away from the polarized electrode. 79
Figure 33. XP spectrum of Au4f region, recorded in the line scan mode from source towards drain electrodes;(a)at the beginning of the experiment (t=0), after (b)3.5 hours (t=3.5 h),(c) 6 hours (t=6 h) and (d)15 hours (t=15 h) during the continuous application of +3V D.C. external potential. (e) Au 4f spectra, normalized in intensity, acquired from the position d=6.0 mm at the beginning of -3V experiment (black) and after 15 hours (red). 81
Figure 34. XP spectra of (a) F1s and (b) Au4f region in line scan mode along 1 mm from the source - electrode point recorded under application of +3V, 0V (grounded) and -3V D.C. potential. (c) Au4f XP spectra recorded in a higher resolution (normal scan mode) on Au electrode (red) and at interfacial region
xix
Figure 35. Schematic representation of experimental set-up corresponding (a) -3V (b) +3V potential application to Au-electrode. Images of the devices after ~60 hours under (c) -3V and (d) +3V external stress. 85
Figure 36. UV-visible spectrum of Au NPs in DEME-TFSI ionic liquid. 86
Figure 37. TEM images of Au NPs in DEME-TFSI ionic liquid. 88
Figure 38. TEM image of Au NPs in DEME-TFSI and the distance profile on top
from the marked region. 89
Figure 39. XP spectra of (a) Au4f and (b) F1s regions, recorded in the line scan mode from the source electrode towards the middle of the device under +3V,
grounded, and -3V D.C. bias. 91
Figure 40. Time-resolved XP spectra of Au 4f and F1s regions under 10 mHz SQW excitation and recorded at four different lateral positions. 93
xx
List of Tables
Table 1. Common Applications of Ionic Liquids 6
xxi
List of Schemes
Scheme 1. Schematic illustration of relation between the energy levels and the work function in XPS for the sample (left), the spectrometer (right). 24
Scheme 2. Schematic representation of Angle Resolved XPS and the sampling
depth. 27
Scheme 3. Schematic representation of ionic fragments across IL-device under applied +3 V potential and charge screening at two interfaces by EDL formation. “Reproduced by permission of the PCCP Owner Societies.
xxii
List of Abbrevations
A.C. : Alternating Current AFM: Atomic Force Microscopy
AR-XPS: Angle Resolved- Xray Photoelectron Spectroscopy D.C. : Direct Current
DEME-TFSI:N,N-Diethyl-N-methyl-N-(2-methoxyethyl)ammonium-bis(trifluoromethanesulfonyl) imide
EDL: Electrical Double Layer
EW: Electrochemical Potential Window IL: Ionic Liquid
NMR: Nuclear Magnetic Resonance NP: Nanoparticle
PE: Polyethylene
PEM: Polyethylene Membrane
RTIL: Room Temperature Ionic Liquids SEM: Scanning Electron Microscopy
xxiii
SFG: Sum Frequency Generation STM: Scanning Tunneling Microscopy SPR: Surface Plasmon Resonance SQW: Square Waves
TEM: Transmission Electron Microscopy TRW: Triangular Waves
UHV: Ultra High Vacuum UV-vis: UV- visible XP: X-ray Photoelectron
1
Chapter 1
Introduction
1.1. Ionic Liquids and Their Properties
1.1.1. Ionic Liquids
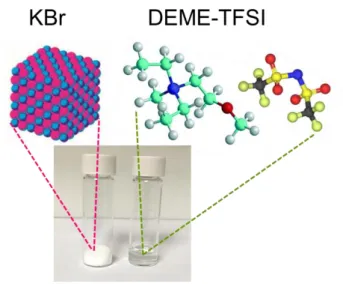
The “ionic liquid” term has been used for the salts in liquid state with melting points below 100 ˚C, which are also referred as Room Temperature Ionic Liquids (RTILs). An ionic liquid can be described as an inorganic salt, when it melts or liquefies without any molecular solvent (molten salt). In contrast to similar ionic character of the simple salts, the molten-salts are corrosive and are at high temperatures, whereas real ionic liquids have different properties. In Figure 1, an ionic liquid N,N-Diethyl-N-methyl-N-(2-methoxyethyl)ammonium bis (trifluoromethanesulfonyl) imide (DEME-TFSI) and a common inorganic KBr salt consisting of K+ and Br- ions are represented at room temperature with their molecular structures. DEME-TFSI is an ionic liquid at room temperature but has no detectable melting point, but only a very low glass transition temperature at
-2
91°C. In contrast, the melting point of KBr is 734 °C, so KBr is solid at room temperature and highly corrosive in its molten state.
Figure 1. Representative images of potassium bromide salt (KBr) and N,N-Diethyl-N-methyl-N-(2-methoxyethyl)ammonium bis (trifluoromethanesulfonyl) imide (DEME-TFSI) ionic liquid at room temperature with molecular structure.
Through the history of the ionic liquids, various terms such as “molten salts,” “room temperature molten salts,” “ionic fluids” “ionic melts,” and “liquid organic salt” have been used for their description. Ionic liquids were introduced to the literature with an article published in 1914, which described the ethyl ammonium nitrate salt liquid at room temperature with melting point of 13-14 ˚C.[1] In 1951, Hurley and Wier [2] introduced details of the chloroaluminate– based liquid salts, as melts, under ambient conditions after three years from their patent in literature.[3] The term “fused salts” entailing only of ions but in the liquid state was described in 1965 by Sundermeyer and co-workers.[4] Afterwards in 1975, use of “molten-salt system” for practical electrochemical applications was reported for the first time. The room temperature ionic liquids (ILs) were primarily introduced as “fused and liquid salts” with enhanced physio- and
3
electro-chemical properties, in late 1900s by Wilkes showing that IL can be prepared from various combinations of cations and anions.[5] By definition, ILs are non-aqueous liquid salts comprised merely of anions and cations at room temperature. Beyond the rich history, as a general description of ILs in literature they are the ionic compounds with organic cations and inorganic anions in liquid state at room temperature.[6]
1.1.2. General Properties of Ionic Liquids
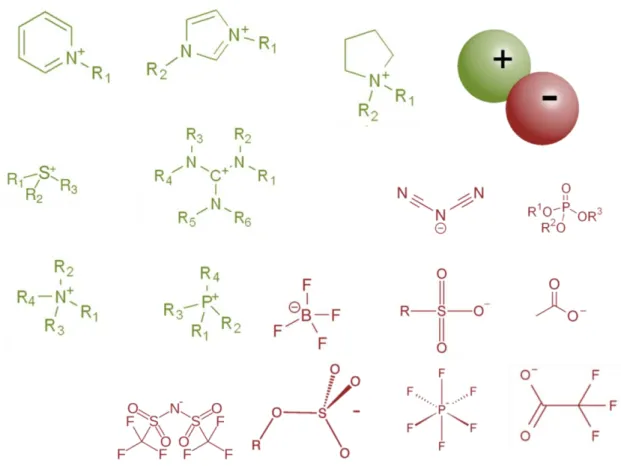
Since ILs are composed merely of ions, the properties of ILs are governed not by the individual properties of cation and anion in the structure but appear as complete average properties of both of them. The appropriate selection and so the combination of the anion and cation enables designing and fine-tuning of the ILs’ properties for particular purposes. For instance ILs can be designed in different structural variations by matching of a cation with an anion; hence there exists more than 106 possible ILs arrangements.[7] Figure 2 represents the chemical structures of most common cations and anions that are used in ILs’ arrangements. In the ILs’ structure the ionic constituents are held together with hydrogen bonds, coulombic and weak van der Waals interactions. This purely ionic composition imparts high intrinsic charge density. ILs have numerous unique physicochemical properties such as low toxicity, non-flammability, high thermal and chemical stability, wide-ranging electrochemical window etc. As a very critical characteristic property, the melting points of ILs are low, so they are liquids below 100 ˚C. Due to the relatively large size, asymmetric and complicated structure of the cation and its combination with a flexible and charge delocalized anion these organic salts deviate severely from their ordered crystal
4
structures and turn into disordered liquids under ambient conditions.[5, 6, 8-13] The density of ILs are in the range of 1.2 - 1.5 g/ml and their viscosity values are typically around 30-50 cP ( ɳH2O = 0.89 cP).[14] The type of cationic and anionic
fragments has a large effect of the ILs’ viscosity and these viscosity values are found to be one or two orders of magnitude higher than the conventional molecular solvents.[15-18] The higher viscosity values are interconnected to the low mobility of ions within the ILs’ medium, thus the ions are slowed down in highly viscous media as a rudimentary consequence of their hindered diffusions. Accordingly, because ILs are high charge carriers large conductivity values are expected at the outset. However, due to the hindered mobility their conductivities are at a level of 10 mS/cm that is not considerably different from those of the molecular solvents.[12, 16, 18-20]
5
Although ILs are ‘liquids’ they have exceedingly low vapor pressures at room temperature, that are practically not measurable, so can be accepted as zero. For example vapor pressure of 1-n-butyl-3-methylimidazolium salts was reported to be ~10-10 Pa[21] at 298 K that is 1013 orders of magnitude lower than H2O (~103
Pa at 298 K).[22] Consistent with their physical form but contrary to the volatility characteristics of the liquids, ILs are non-volatile. [7, 23, 24] The non-volatility of ILs is interrelated with the thermal stability, where ILs do not undergo thermal decomposition in wide temperature ranges (up to 600K) for 1-Alkyl-3-methyl imidazolium bis(trifluoromethylsulfonyl)imide.[25]
1.2.
Applications of Ionic Liquids
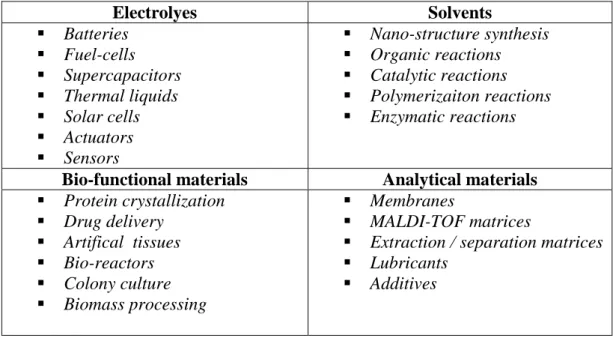
Ionic liquids (ILs) provide a bundle of unusual properties as liquids that are different from those of the molecular solvents, so ILs have attracted a fascinating growing interest in a wide range of scientific and technological applications. Through their primary properties, ILs appear to be alternative to the common molecular liquids and their fine-tunable characteristics open novel application areas (examples are given in Table 1) in designing innovative systems with advanced performance, in addition to the conventional applications covering energy storage,[26-29] energy conversion,[30] catalysis[8, 23, 31-34] or chemical synthesis.[5, 35-40]
6
Table 1. Common Applications of Ionic Liquids
Electrolyes Solvents Batteries Fuel-cells Supercapacitors Thermal liquids Solar cells Actuators Sensors Nano-structure synthesis Organic reactions Catalytic reactions Polymerizaiton reactions Enzymatic reactions
Bio-functional materials Analytical materials Protein crystallization Drug delivery Artifical tissues Bio-reactors Colony culture Biomass processing Membranes MALDI-TOF matrices
Extraction / separation matrices Lubricants
Additives
1.2.1. Ionic Liquids in Electrochemical Systems
Ion conductive and electron conductive materials are two essential materials which have vital significance for electrochemical systems. Electrolytes are aqueous or organic solvent based components and they are essentially used as ion conducting materials in electrochemical systems. However, solvent based conventional electrochemical systems suffer from the volatility and decomposition problems in high operating temperatures and voltages, inflicting poor performance plus short life time to the electrochemical devices. Therefore, ILs appear as innovative solutions, since they are electrolytes, which are merely composed of dense ionic components free of solvent; maintain liquid characteristics and stabilities in wide temperature and voltage intervals.[13, 14] Replacement of aqueous or organic electrolytes with ILs opens new routes in electrochemical applications. For instance, the electrochemical reactions in aqueous or organic media can also be performed in ILs. In addition, use of ILs
7
overcomes the impossibility of certain processes that cannot be performed in aqueous media. [41, 42]
The foremost issues for energy storage devices such as solar cells, fuel cells or double layer capacitors, are primarily safety and performance. Electrolytes, being nonvolatile and free of any molecular solvent, enable safer applications in outdoor use in addition to prolonged operational life times and impart higher performance to the electrochemical energy storage devices. As a result, for applications in electrochemistry, thermodynamically and kinetically stable ionic liquids are suitable electroactive candidates on account of their high ionic conductivity plus durability against flammability and volatility instead of aqueous and / or organic electrolyte solutions that are usually volatile and unstable.
Any kind of electrolyte is usable in electrochemical systems, if and only if the electrolyte of interest can conduct the electrochemical processes of the species devoid of any side redox reactions and / or solvent breakdown, before the electrolyte itself. Besides, not only the electrolyte but also the electrode in the electrochemical system must be stable against either oxidation or reduction within the operating potential range. The operating potential range for an electrochemical system corresponds to electrochemical potential window (EW) that is connected to its electrochemical stability. The limit of the EW appears as the boundary for potential at which the electrochemical decomposition of either ions of the electrolyte and electrode materials deviate from their stability and start to decompose. The conventional aqueous electrolytes have narrow EWs, as small as 0.9 V, and use of organic electrolytes increases this value to around 2.5-2.7V.[43, 44] In contrast, ILs have higher EW values in the range of 4.2 to 5.4 V,
8
typically 4 V but up to 6 V in some cases, compared to the conventional electrode-electrolyte systems.[45-49] This electrochemical stability potential window is directly related with the performance and the energy stored in a given electrode-electrolyte system. For the performance of the electrochemical cell, the electrolyte decomposition at high potentials limits the cell voltage, since the wider the electrolyte stability potential window is the higher the cell voltage and the energy density.[43, 44] Thus ILs enable operation of electrochemical systems in wide potential ranges with improved energy and charge densities.
1.2.1.1. Ionic Liquid Interfaces
In general, average molecular and geometrical properties control thermodynamic and kinetic properties of ILs. So for ILs’ applications in many systems covering electrical energy devices such as fuel cells or double layer capacitors and catalytic processes, the molecular orientation of the charged fragments within the IL structure must be well understood. Although the novel bulk properties of room temperature ILs have been researched extensively over the past decades, their structural and interfacial investigations are limited to few studies. The IL interface region corresponds to the region where the anions and cations of the corresponding IL are in contact with the other phase i.e. gas, liquid or solid phases. The composition and the fragmental arrangement of the ILs at interfaces are very different as compared to those in the bulk. Hence, investigations on the preferential arrangements of the anions and cations at the ILs interface become essential for fundamental understanding in further developments and applications. In general, the structural arrangements of the ionic fragments
9
closer to the IL interfacial region are complicated topics and are still under investigation without deep understanding.
In order to obtain detailed information about the chemical structure of ILs at the surface, the interface between IL and the gas phase molecules has been investigated to understand whether anionic or cationic fragments of ILs dominate the gas interface or both of the ions exist in equal amounts, and whether they are being positioned parallel or perpendicular to the surface plane. For instance, the structure of the IL/gas interface plays a crucial role in catalytic systems’ development, since it has impact on understanding of the chemical reactions at the interfacial region plus their mechanisms, such as adsorption of gaseous molecules on the IL-surface and catalytic reactions taking place therein.
Accordingly the IL/gas interfacial region was studied by direct recoil spectrometry where signal was coming from the outermost 2-4 Å depth of the IL surface, which was combined with time-of-flight analysis, to identify the surface atoms and/or molecular composition.[50] In this work, the ionic fragments were studied with glancing incidence of ion beam as a function of analysis depth. The cationic fragment of imidazolium ring containing ILs was found to be positioned at the surface together with the anionic fragment though perpendicular to the surface plane.[50, 51] IL/gas interface of the similar systems containing imidazolium ring in the ILs’ structures were also studied by sum frequency generation (SFG) vibrational spectroscopy, which is an extremely surface sensitive technique and probes the interfacial structures within 30 nm through their vibrational spectra. [52, 53] It was found that the spectra were dominated by the alkyl chains, which were the lowest energy component of the cationic fragments. Thus, the authors also stated that the composition of the surface is
10
dominated by lowest surface energy component of the system. In another work on imidazolium derivative ionic liquids with two different anions, the X-ray reflectivity analysis were performed to clarify the surface layering and the anion enrichment within the bulk IL-structure as a function of the surface-normal electron density with an angstrom-scale resolution.[54] They found that surface layer within thickness of 6-7Å consisted of the standing up alkyl chains of the IL.
1.2.1.2. Electrode/Ionic Liquid Interface and Electrical Double Layer
The solid/IL interface is a fascinating region and need to be better understood, since when a liquid is brought into contact with an electrified solid surface, the liquid molecules undergo rearrangements adjacent to this well-defined solid surface. The interface between ILs/solid surfaces is established by merely of ions through their interaction with the electrified solid-surface. So the ionic arrangement and the orientation of individual cationic or anionic constituents at charged or uncharged solid interfaces appear to be important point of discussion/investigation.
The relative positions of the negative and positive ions in the structure of IL that is adsorbed on uncharged and charged graphite surface have been modelled to obtain information about the internal orientation at IL/solid interface through computational analysis.[55-57] In these computational works, the cationic fragment was found to be re-oriented to the uncharged electrode surface Moreover, the concentrations of the adsorbed anionic and cationic fragments were found to be controlled by the surface charge of the electrode. As a result of the molecular simulation work, Kislenko and co-workers reported also that the ILs’
11
structure differs from that of the bulk at uncharged graphite surface and yet has an ordered structure, at the negatively charged surface/IL interface.[55] The molecular structure at the interface turns into a multilayered structure of ions as alternating anionic and cationic fragments.
The interaction between IL and a solid surface is strongly dependent on interfacial properties since the solid surface imparts physical and chemical constraints. If the surface is positively polarized the negatively charged fragments of the IL structure are expected to be closer to the interface or positively charged fragments are repelled by the developed charges at IL/solid interface. At the interface between IL and the negatively or positively charged solid surface, there exists a reorientation of the charged fragments of ionic liquid with respect to the surface charge. Thus the polarity difference between the IL and the solid surface is the cause of Electrical Double Layer (EDL) formation depending on the charged fragments’ reorganization at the interfacial region.[58-63]
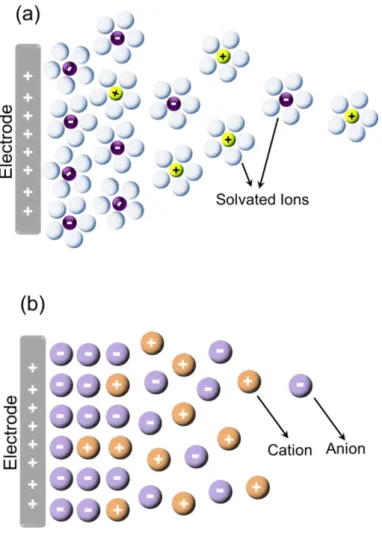
In the classical Electrical Double Layer (EDL) concept, there exists a strong interaction between the electrode surface and electrolyte, when an electrolyte is brought into contact with an electrode. Because the solvated ions are mobile in the electrolyte together with the neutral molecules, the ions undergo a redistribution with respect to charge on the electrode surface through electrostatic interactions, and as they approach the electrode surface a charge balancing layer is also formed at electrode/electrolyte interface.[64] In 1850s Helmholtz suggested his model for the EDL, which described the formation of compact only one-ion thick layer as a result of the electrostatic interaction. Later, in early 1900s Gouy-Chapman model was proposed to modify the thickness of EDL as not being limited to one-ion layer but also to the formation and the existence of ionic diffuse
12
layer. Accordingly, Stern combined these two models in 1920s and defined the EDL concept as a combination of a one-type of solvated layer at the electrode/electrolyte interface together with charge reversed diffuse layer comprised of alternating counter-ion layers.[65]
Gouy-Chapman-Stern EDL theory assumes dilute solvents that contain dissolved ions and neutral molecules as electrolytes. Upon the application of the electrical potential, the charge on the electrode is screened by the local association of the anions and the cations plus the neutral solvent molecules at a simple boundary between electrode surface and electrolyte solution, adopting an opposite net charge with induced structural changes. Since ionic liquids are composed merely of charged fragments and these fragments are mobile under ambient conditions, which enable structural rearrangement of them, they render different properties than those of the electrolytes in an electrochemical system. Therefore classical EDL models are not applicable to the electrode/IL interfaces. This is schematically shown in Figure 3 for representation of the EDL model for the classical electrolyte system and the IL system. Basically, the electrode is assumed to be a planar sheet of charges and the ILs consist of only anions and matching cations in equal amounts. In order to screen the charge on polarized electrode, the exact one-to-one ratio between anion and cations is disturbed at the electrode/IL interface. On this concept, experimental and theoretical works meet in the same question: “How is the interfacial structure and what are the ionic arrangements near the electrode surface?”
The redistribution of the multiple ion layers at electrode/IL is not modest, because of the high electrostatic interactions between anionic-cationic species, predetermined ion size, their large and complicated shape plus the steric
13
hindrance of these ions and are all essential inputs to model EDL structure in ILs. [61, 66-73] In addition, ILs systems with high density of ions prevent the formation of solvation layers at electrode/IL interfaces. This results in the movement of anionic or cationic fragments near electrode region in interfacial ordering and the formation of multiple ionic layers in alternating manner in order to compensate the charge on the electrode surface at the interface between electrode/IL.[56, 60, 73-76]
Figure 3. Schematic representation of (a) Classical EDL model and (b) EDL model for ILs.
14
The work of Baldelli et al., through SFG analysis shows that there exists an oriented layer of cationic and anionic fragments at the Pt electrode/ionic liquid interface where the arrangement of the ionic fragments are controlled with respect to the electrically developed positive or negative surface charge on the Pt-electrode.[66] Hayes et al. studied the interfacial layer that has excessive degree of organization, between IL and Au (111) electrode in order to understand the EDL structure at the electrified electrode/IL interface using AFM as a function of applied potential to the electrode.[61] They concluded that the double layer formation and the relative orientation of the ionic fragments closest to the electrode surface were strongly dependent on the applied electrode potential and electrostatic forces between electrode surface and cations of IL. ILs are found to be inserted into carbon micro-pores of the graphite-electrode without any potential application, but adsorption/desorption of the counter ions from the carbon pores are detected under potential, by Merlet et al. [56] They also showed by molecular simulations of applied constant potential differences to the two graphite electrodes and IL-medium in between then resulted in EDL formation, existence of differential capacitance and charge density fluctuations in the sub-nanometer scale. Moreover they found out that only the half of the applied constant potential was prevailed on the bulk-IL. In their more recent works, molecular details based on the computer simulations showed as a function of voltage, that the number of cations in tilted position is increased at the positive electrode but decreased at the negative one.[57, 77] Also they indicated the number of anions at both electrodes is also increased in order to balance the cations. In turn the anions enter the first ionic layer as a result of compact structural reorganization.
15
Atomic Force Microscopy (AFM) is used to obtain information about IL/electrode interfaces’ structure since the force between AFM probe is surface sensitive to the charges plus dimensions of anions and cations. Similarly, using both AFM and STM techniques, rearrangement of anions and cations was studied at the Au (111) electrode interface with respect to the applied potential.[70] Another AFM and STM study showed that the structure of interfacial region within 5nm between IL/Au-electrode can be tuned and is strongly dependent on the ion structure of the IL, where the ionic arrangements also vary with the sign plus the extent of the applied potential.[78] A recently performed impedance analysis on the ion-electrode interactions examined the differential capacitance developed as a function of the applied potential to the electrode.[79] This differential capacitance is found to be sensitive to the conformational changes, in addition to the interaction between electrode material and the cations and anions.
To sum up, at the ILs/electrode interface, the EDL structure of ILs is defined as combination of a ionic layer that alternates the charges on the electrode surface and the densely packed counter ions alternate the net charges in neighboring layers.[80, 81] Within an electrochemical system consisting of two electrodes and IL-electrolyte, when the potential is applied across the electrodes, anions migrate towards positive electrodes while the cations migrate towards the negative one forming EDL structure with a maximum charge at the electrode surface. The applied potential drops within the range of EDL structure, which is around few nanometers and decays towards equilibrium forming layered-ionic distribution that approaches to the bulk IL structure establishing the overall charge to be neutral.[80, 82, 83]
16
1.2.2. Ionic Liquids and Metal Nanoparticle Syntheses
The properties of bulk materials are independent of their size, though the properties start to be deviating when the size of materials falls in the nano-scales. The “nano” sized materials, as a transition between atomic and bulk forms, exhibit different properties than either those of the bulk material or atomic forms The “nano” term usually refers to the particle size in the 1-100 nm range and the particles in nano-scale dimensions are often called as “nanoparticles”, “nanocrystals” or “nanocolloids.” Nanoparticles (NPs) have been known since ancient time; for example in ancient eras Au NPs had been used to give red color and glittering effect on the bowls or paintings. The very famous “Lycurgus Cup” which belongs to Romans in the 4th century, contains Au NPs inside and shines in red or green with respect to the angle of incoming light. In 1857, Micheal Faraday reported on the optical properties of nano-sized metal particles, and for the first time scientific clarification was given. In his well-known work on the Au NPs with characteristic bright red color were obtained by the chemical reduction of chloroaurate ion in an aqueous solution.[84] The “nano” technology appears to be one of the recent research areas in science with an ever increasing attention over the past two decades leading to numerous innovative approaches for preparation of nano-sized materials, especially the metal NPs, and understanding their new properties. Therefore, the topics in nanotechnology cover a wide range of NPs’ applications including biological systems, catalysis, electrical devices, energy storage systems, environmental issues etc.
Among the research fields on nano-materials, nano-sized particles of gold (Au NPs) exhibit interesting features and gets growing attention. As being one of the most stable NPs, Au NPs have been the topic of interest in electronic,
17
magnetic, optical, biologic and catalytic applications.[85-89] Within the scope of this doctoral thesis examples of Au NPs are discussed since in the upcoming chapters including thesis’s results and discussions, Au NPs will be within the central theme.
1.2.2.1. Metal Nanoparticles
The metal NPs are prepared by various methods; reduction of metal salts through simple chemical reduction, electrochemical reduction, photochemical reduction and sonochemical reduction or photolytic, thermal and sonolytic decomposition of metal organic precursors, where the size and shape of nanomaterials are strongly related with the preparation conditions. Since the NPs have high surface energy and large surface area, the nano-sized particles tend to agglomerate into larger particles through attaching from their surfaces to lower their overall energy and reach the more thermodynamically favored state. In order to stabilize metal NPs against agglomeration, a variety of surfactants or capping agents, which form a steric and/or electrostatic protection layer around the particles, are added into aqueous and/or organic reaction media.[90]
When the size of metal particles are reduced from the well-ordered bulk crystalline to structures in the nanometer scale, they exhibit unique properties over the bulk; their physicochemical properties as well as electronic properties, and the interrelated optical properties are different.[91, 92] The NPs’ intrinsic properties are dominated by their high surface energy (unsaturated nano-sized metal particles are in higher energy state than the entirely coordinated atoms in the crystal structure of the bulk) and their high surface to volume ratio.[93] In addition, NPs’ novel physicochemical properties are strongly related with the size of particles. As
18
a basic background, the metals in bulk form in millimeter scales or larger, do not have discrete energy levels and have no band gap in their electronic structure. In contrast, metals in molecular form have a large band gap between valance and conduction bands. Unlike the metals in bulk or molecular form, metal NPs have discrete energy levels and a small band gap.[90, 94]
1.2.2.2. UV-visible Spectra of Metal Nanoparticles
Illumination of a sample with electromagnetic radiation, results in absorption, reflection or scattering of incoming radiation. The absorbed amount of incoming electromagnetic radiation as a function the wavelength of incident beam is measured in absorbance spectroscopy through relating the intensity of the transmitted light to the incoming light. Beer’s Law, also known as Beer-Lambert Law, defines the absorption quantitatively as a function of path length b and concentration of absorbing species c (see Figure 4). The term Ɛ in Beer’s Law represents the extinction coefficient, which is a material specific property, interconnected with the strength of absorbing species to absorb light at a given wavelength interval.
Figure 4. Schematic representation corresponding to adsorption of incoming radiation I0 through a solution and transmitted light I.
19
The absorption spectroscopy using the ultra violet (UV) – visible (vis) region of the electromagnetic spectrum for incident beam is called as “UV-visible (UV-vis) absorption spectroscopy” and has widespread applications in all branches of science; biology, engineering, physics, chemistry, etc. UV-vis spectroscopy arises as the most common tool for the characterization of metal NPs, because the absorption of light by these NPs is specific to the material. As the electronic structure of the metals is changed with respect to the size of the particles, their interaction with light is also altered. The free electrons in metals start to oscillate when they interact with the incoming light in resonance. The so-called Surface Plasmon Resonance (SPR) is known as the collective free-electron oscillations in the conduction band. The SPR absorbance of the noble metal NPs is in visible region that give rise to their fascinating colors. The “gold color” of the Au-metal as in the bulk, turns into bright-red for its nanoparticles. Since SPR is a surface related property the color is not only varied with the type of the metal NPs but also with the size and shape of NPs. For instance, Ag NPs around 40-60 nm size show an intense-yellow color and their SPR appears as a band around 420 nm in absorbance spectrum, yet the spectrum shifts to 400 nm when the size of Ag NPs is around 5 nm and the color of NPs solution becomes lighter yellow.[94] In absorption spectrum of the nearly mono-dispersed 1-4 nm Au NPs, SPR arises below 525 nm whereas the larger particles give sharper and more intense peak at higher wavelengths.[95] Spherical Au NPs of their size higher than 5 nm, have characteristic absorption band between 520 nm to 580 nm but Au particles in nano-rod form span an absorption range from 700 nm to 1100 nm as the size of the Au nano-rods increased.[89] However as it will be discussed in this
20
thesis, Au NPs prepared in ILs have usually their SPR bands in much lower (450-500 nm) wavelengths range.[96]
1.2.2.3. Transmission Electron Microscopy of Metal Nanoparticles
Interaction of electrons with matter as electrons are passing through the very thin sample is the subject of interest for different characterization technique. The change in the amplitude and intensity of the electron beam is converted into light intensity by Transmission Electron Microscopy (TEM) to acquire morphological information. The resolution of the imaging is strongly linked to the wavelength of the electrons through the De Broglie's well-known equation,
𝜆 =
ℎ
𝑚𝜈
where ℎ is Planck constant, 𝑚 is the mass and 𝜈 is velocity of the electron. De Broglie’ equation states that as the accelerating voltage corresponding to the energy of electrons in the electron microscope is increased the velocity of electrons also increases, thus the de Broglie wavelength of an electron turns to be shorter (for example for 100 keV electron 𝜆 is 4 pm) where the diameter of an atom is typically 30-300 pm for isolated neutral atoms.[97] Accordingly, TEM appears to be a very high resolution tool for morphological characterization of nano-sized metal particles since their sizes and shapes are imperative for further applications. As a result, TEM offers structural identification of a single NP with less than 1 nm resolution. In addition, it offers characterizations of atomic lattices within the particles at atomic resolution.[98]
21
1.2.2.4. Use of Ionic Liquids for Metal Nanoparticle Synthesis
For practical and innovative applications, metal NPs must be initially synthesized successfully, then be dispersed in the medium of interest and must also be protected against agglomeration. The metal NPs preparation requires reproducibility, reliability, simple reaction conditions yielding NPs in narrow size distribution and desired shapes. ILs as being an innovative matrix whose functions and properties can be fine tuned for particular purposes, also appear to be suitable medium for NPs’ synthesis. The natural pre-organized structure within the ILs is formed through extended H-bonding, electrostatic and van der Waals interactions among the constituent ions.[99-101] The extremely structured IL organization consisting of ionic channel networks with high directionality and polarizability makes ILs supramolecular networks an entropic driver for nano-scale structure’s preparation and their dispersion.[102-107] Since both polar and non-polar nano-domains exist in the same supramolecular network, ionic metal precursors have tendencies to be dissolved in IL medium. Thus basic reduction methods; where chemicals or photon beam irradiation are generally used as reductants, are also applicable to obtain metal NPs from metal ions dissolved in ILs. Tsuda and co-workers reported on the reduction of Au3+ ions dissolved in three different types of ILs by electron beam and γ-ray irradiation and presented the characteristics broad SPR absorbance of Au NPs consistent with TEM analysis.[96] Similarly, reduction of Au3+ ions by a chemical reductant SnCl2 in ILs, and Au NP growth,
as well as their dispersion to 2.6 to 200 nm, were studied by following the Au NPs’ absorbance band in UV/vis spectrometry and complementary TEM analysis.[40]
22
The non-polar domains of the highly directional nano-network in ILs support decomposition of neutral organometallic precursors into nano-sized metal NPs. Scariot et al. used this high directionality of the pre-organized IL structure to obtain Co NPs in cubic and irregular shapes by the thermal decomposition of Co2(CO)8 organometallic complex with Co at zero oxidation state.[108]
Preparation of different metal NPs from their metal-carbonyl complexes through photolytic decomposition along with the thermal decomposition, was reported by Krämer et al. (for Fe, Ru and Os NPs) [39] and Redel et al. (Cr, Mo and W).[109] Alternatively, ILs are used as not only supporting but also stabilizing media for finely dispersed NPs that are obtained from the bulk metal precursor bombardment with energetic ion and/or photon beams. In the work published by Torimoto et al., finely dispersed Au NPs (around 1.9 nm and 5.5 nm) were prepared by sputter deposition technique, where the ejected nano-sized Au particles are found to be dispersed as clusters on the surface of the particular IL.[110] In addition, monometallic Au and Ag NPs as well as bimetallic Au/Ag nano-alloys, in altered fractions, were prepared by bombardment of Au and Ag targets.[111] As an alternative approach, Endres and co-workers, for the first time, reported on the electrodeposition of metal and alloys in ILs, for NPs such as Mg, Ti, Si or Ge where their electrodeposition is only possible under high temperatures and in molten salts.[41, 42]
Since ILs have large electrochemical stability windows, they also provide electrochemical reaction media to work under low temperatures. Thus they open a wide window in providing metal particles synthesis that cannot be electrodeposited from aqueous and/or organic electrolyte solutions or at room temperature. Imidazolium-derivative ionic liquids were used as templates for the
23
electrochemical reduction of Ag(CN)- and Au(CN)- anions to form both Ag and Au NPs in a size controlled manner, through controlling of the potential and the current density during electrodeposition.[112] Similarly, electrochemical depositions of Se, In, Cu and Al were also studied in ILs without any additives at room temperature where their favorable dispersion was also confirmed by SEM analysis.[113, 114]
Therefore, ILs emerge to as a green synthesis and stabilization medium for NPs preparation through their characteristics, since ILs combine the electrostatic stabilization as they are composed of merely ions, and steric stabilization through restriction of NPs’ free motion by the ionic fragments.[115] Thus, if ILs are used for reaction medium there is no need for additional stabilizing agents during preparation processes. Hence, ILs eliminate the possibility of byproduct formation, residual constituents or side reactions with the additives. Moreover, as reported by Gao and co-workers on preparation of Au nano- and micro-structures through the reduction of AuCl4- ions, ILs facilitate
spontaneous formation of metal NPs without the need for reducing agents.[116] Additional research showed that, Cu flakes with the size of 1-5 µm spontaneously dissociated into Cu NPs (~10 nm) on account of strong interaction between the partially positive Cu-surface and anionic fragment of the IL, and they are dispersed and stabilized within the IL-medium. [117]
24
1.3. X-ray Photoelectron Spectroscopy and Ionic Liquids
1.3.1. Basic Principles of X-ray Photoelectron Spectroscopy
In X-ray Photoelectron Spectroscopy (XPS), the sample is irradiated by X-ray with a known energy, and as a result photoelectrons are generated. Al Kα and Mg Kα with energies of 1486.6 eV and 1253.6 eV respectively, are the conventional X-ray sources for excitation of photoelectrons. XPS studies are performed under ultra high vacuum conditions around 10-7 to 10-10 mbar, since gaseous atoms/molecules at higher pressure conditions hinder the precision of measurements through interaction of the residual gases with the emitted photoelectrons. The ejected photoelectrons from the sample, which are detected by a particle detector, are measured to determine their kinetic energies (EK). The
binding energies (EB) of those photoelectrons are computed using the Einstein’s
equation; EB = hν – EK – Ф, where hν is energy of the X-ray photons and Ф is the
spectrometer work function, since the Fermi levels of sample and spectrometer are equalized. (See Scheme 1 for EB correlations with the work function).
Scheme 1. Schematic illustration of relation between the energy levels and the work function in XPS for the sample (left), the spectrometer (right).
25
Binding energy of a specific energy level is different for each atom and is also a function of chemical environment. Therefore, information about each element, except for H, can be obtained using XPS. The incoming photons permeate through the sample in the microns range. The interaction between the outgoing beam and the material of interest is strong so that only a fraction of the ejected photoelectrons originating from the top few nanometers depth of the sample’s surface can survive without energy loss through inelastic scattering. The characteristic photoelectron peaks arise from those of electrons leaving the surface without energy loss. The other ejected but inelastically scattered electrons contribute to the background of the spectrum as depicted in Figure 5. Hence, chemical and physical information of the sample are collected from about few outermost atomic layers. In others words XPS has 0-10 nm probe length, of the sample’s surface. In addition using the elemental specific property of XPS, relative amounts of corresponding elements can also be determined.
Figure 5. XP survey of DEME-TFSI on Au-electrode representing the photoelectrons’ contribution to the spectrum and the detected elements. High resolution Au4f and N1s regions are given inlet.
26
In the high resolution mode (see Figure 5 inset), the photoelectron spectrum of a specific element contains information about its chemical or electronic environment. The oxidation state of an atom shifts the binding energy toward higher values, since positively charged atoms have strongly bound electrons and toward lower binding energy in case of negatively charged atoms that have less strongly bound electrons, as presented for N1s region in Figure5. Therefore, not only information on identification and quantification of the same element but also information about the chemical environment can be harvested by XPS analysis. Along with the elemental and chemical sensivity of XPS, additional information is extracted by elemental mapping from a defined area on sample surface.
At the surface of the sample the detected XPS signal, (𝐼) is related to the intensity of the XPS signal (𝐼0 ) originating from the underlying substrate, after attenuation through the overlayer with a thickness of 𝑑 using the following equation:[118-120]
𝐼 = 𝐼
0𝑒
−(𝜆 cos 𝜃)𝑑The attenuation length, λ are tabulated in the literature for many materials and the angle θ is the electron take-off angle normal to the surface which is adjustable for Angle Resolved XPS (AR-XPS) analysis. When the XPS measurements are performed at electron take-off angle θ = 0˚, where collection angle perpendicular to the surface) analysis depth of ~3λ is achieved. By varying the angle θ analysis depth is shortened and gives more information about the outer surface region. As represented in the Figure 5, θ dependent XPS measurements become extremely surface sensitive and are performed with changing the angle where the limiting
27
value for analyses depth is d≅3λcosθ.[119] For instance, if the typical probing depth of XPS at electron collection angle is ~10 nm, the probed depth is decreased to ~3 nm at 70˚ electron take-off angle. Being a non-destructive technique, AR-XPS reveals information from different depths of the sample by changing only the emission angle at which electrons are collected. Therefore, in addition to information about the element and chemical state distribution at different depths, AR-XPS extracts information about the thickness and relative composition in the sample as a depth profile.
Scheme 2. Schematic representation of Angle Resolved XPS and the sampling depth.
As an example, AR-XPS analysis for N1s regions of the DEME-TFSI ionic liquid, recorded at two electron take off angles θ = 0˚ and θ = 45˚ are given in Figure 6. The N1s region of DEME-TFSI contains two distinct nitrogen species corresponding to the anion and the cation within the IL structure. The intensity of negatively charged –N- fragment corresponding to TFSI anion, was found to be higher at θ = 45˚ as compared to the intensity of –N+ fragment. As it is revealed from the Figure 6, the anionic fragments dominate the surface when the underlying substrate was negatively charged. Cremer et al. studied adsorption of
28
imidazolium derived IL’s thin films on Au (111) surface.[121] They calculated the thicknesses of the adsorbed IL-films from the intensity relation of the underlying substrate’s Au4f peaks as a function of electron take-off angle, as described above. They showed by observing the decrease in the photoelectron peak intensities of the imidazolium cation at θ = 80˚ in AR-XPS analysis, TFSI anion of the IL was positioned towards the surface, similar to our work.
Figure 6. AR-XPS spectra for ionic liquid DEME-TFSI at electron take-off angle normal to the surface θ =0 (left side) and θ=45 (right side). N1s region at two different electron take-off angles represented together with the schematic illustration of the AR-XPS method.