The demand for energy in the large-
scale manufacturing sector of
Pakistan
Fakhre Mahmud and Salim Chishti
The extent of interfuel substitution, as well as substitution between energ?’ and non-energ]
inputs, in the large-scale manufacturing sector of Pakistan has been examined. The model
has been estimated in two stages. In the first stage input demand for various energy
components is estimated and hence an aggregate Divisia index is constructed. In the second
stage this index is used as an instrument to estimate aggregate input demandfor capital,
labour and energy along with their price and substitution elasticities. It seems that there is
little interfuel substitution. The results also show that energy and labour are substitutes
while energy and capital are complement.
Keywords: Energy; Manufacturing; Pakistan
Pakistan’s large-scale manufacturing sector has been growing at over 7% per annum. The sector consumes about 35% of total commercial energy, demand for which is growing at over 6% per annum. Energy has been a major constraint on the growth of the sector (Pasha et al [lo]). Pakistan is a net oil-importing country, spending about 22% of its export earnings. While serious strides are underway to cope with the energy constraint from the supply side, in the past efforts have been made to adopt demand management policies to make interfuel, as well as fuel and non-fuel substitutions. However, there are few analytical studies to evaluate the impact of demand management policies. The purpose of this paper is to study the substitution between different carriers of energy as well as between energy and non-energy inputs in the manufacturing sector of Pakistan.
The model and data
Following Fuss [4] the model is estimated in two stages. In the first stage input demands for various energy Fakhre Mahmud is Visiting Professor, Faculty of Economics and Administration, Bilkent University, Maltepe Ankara, Turkey and Salim Chishti is Senior Research Economist at the Applied Economics Research Centre, University of Karachi, PO Box 8403, Karachi 75270, Pakistan.
Final manuscript received 19 December 1989.
components are estimated and hence an aggregate price Divisia index for energy is developed. In the second stage this index is used as an instrument variable to estimate aggregate input demand for capital, labour and energy along with their price and substitution elas- ticities.
It has been assumed that the aggregate production process can be represented by a translog production process with three inputs, namely capital. labour and energy which is weakly separable in energy. Invoking duality relations in production and cost, this can be equivalently represented by a translog cost function which is also weakly separable and can be written as:
InC= Incc,+~ailnPj-taQ InQ+$~~vii lnPi. InP,
i j + c “;Q hQ . hlPi+ $vQQ ( lnQ)2
ij= E
(energy, N (labour), K (capital) (1) wherePE
is an aggregate price index of all energy components. Partially differentiating Equation (l), invoking Shephard’s lemma and imposing homo- geneity, adding up and symmetry restrictions yields the following input demand equations:Si = ai + c ro hlPj+ TiQ InQ i
i, j= E, N, K
(2)
251
Ol40-9883/90/04025lW4 0 1990 Butterworth-Heinemann LtdThe demand.for energy in the large-scale manufacturing sector qf Pakistan: F. Mahnrud and S. Chishti
Corresponding to Equation (2) the Allen-Uzawa par- tial substitution elasticities are given by:
T,,+ s; s, cJ;,= ~ I, j = E, N.-K; i=.j s; s, 6,, = Tr, + S,’ - Si i=E,N,K s2
and price elasticities are given by:
(3)
El/=Sjau
E,, = S; c;, (4)
Before estimating the above model a similar translog sub-module in energy components has been estimated. More specifically the translog cost function correspond- ing to various energy components may be written as follows:
been ensured in both the energy sub-module as well as in the aggregate model by estimating each of the models three times. dropping one share equation at a time.
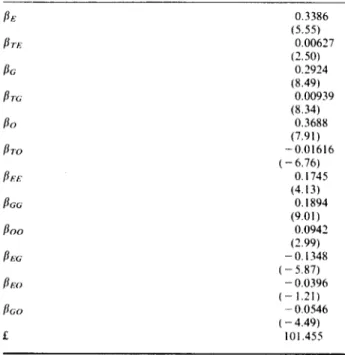
The parameter estimates of the energy sub-module are presented in Table 1. Eleven out of twelve par- ameters are significant at the 1% level. The own- and cross-price elasticities are presented in Table2. Own- price elasticities for electricity and oil take correct signs and are significant at the 5% level. The price elasticity for gas is positive, but insignificant, at the 5% level. Cross-price elasticity between electricity and gas is negative but insignificant. This is also the case with the
Table 1. Parameter estimates oftbe sbareequations(inter-fuel).
lnPE= lr$,+ CPilnPE,+ CCfig 1nPEi lnP, (5)
I 1 .i
where PE is the aggregate price index of energy but can also be viewed as the cost per unit of energy to the optimizing agent.
The cost minimizing input demand functions corres- ponding to Equation (5). after imposing homogeneity, symmetry and adding-up restrictions are given by:
SE; = /3i + C BV lnPEj (6)
i
‘First the sub-module consisting of Equations (5) and (6) has been estimated and hence interfuel substitution and price elasticities are estimated. In addition, the para- meter estimates are substituted in Equation (5) to obtain an aggregate price index for energy which in turn has been used as an instrument variable in the estimation of the aggregate production function. More specifically PE in Equations (1) and (2) has been replaced by the instrument variable thus obtained and then these two equations are estimated.
/1E 0.3386 (5.55) B, 0.00627 (2.50) BG 0.2924 (8.49) Bz 0.00939 (8.34) PO 0.3688 (7.91) BTO -0.01616 (- 6.76) DEE 0.1745 (4.13) BGG 0.1894 (9.01) PO0 0.0942 (2.99) BEG -0.1348 (-5.87) BE0 -0.0396 (- 1.21) PGO - 0.0546 (-4.49) f 101.455
Note: E= electricity, G = gas and 0 = oil.
Annual time series data for the period 1960-80 have been used. All data on quantities and prices, except for energy have been taken from Naqvi et al [9]. The data on energy components, both quantities and prices have been taken from the Energy Year Book.’ All energy quantities have been converted into Btus.
Table 2. Inter-fuel price elasticities
Results
Zellner’s iterative estimation procedure has been used. The invariance of the estimates of the parameters has ‘It includes only commercially purchased energy and therefore does not account for energy (especially electricity) which is self-generated by industry. However. this component has become relatively more significant in recent years. The data on gas excludes the use ofgas as a feedback in fertilizers. fitx -0.1144 (- 1.59) t7G.G +0.1152 (1.14) no0 -0.3304 (-2.11) fiEG -0.01963 (-0.503) fiFx> 0.134 (2.389) fiG0 -0.0598 (- 1.02) liG.E -0.0554 (-0.503) &x 0.393 (2.40) ZOC; - 0.062 (-- 1.02)
The demand.for energy in the large-scale manufacturing sector of Pakistan: F. Mahmud and S. Chishti
Table 3. Parameter estimates with instrument for PE (PE). - 1.405 (-0.311) 1.12 (0.966) 0.279 (1.123) 0.7544 (3.32) - 0.0339 (-0.897) 0.08009 (2.14) 0.1342 (4.356) 0.0647 (9.69) -0.0138 (- 5.89) - 0.0747 (-2.22) - 0.00532 ( - 0.706) - 0.0595 (- 12.49) - 0.07789 (-2.24) - 0.0359) (-6.61) 0.1138 (3.62) - 0.0989 (-4.13) 0.009164 (3.56) 0.00464 (10.55)
5% level. However, the degree of price responsiveness is not high. Particularly the price elasticity of energy demand is quite Iow.~ The cross-price elasticities between employment and energy are positive and sig- nificant. The degree of substitution as depicted by the corresponding substitution elasticity is sizable. This result is similar to earlier such studies for other countries (Apte [l] and Vashist [ 111).
Table4. Price and substitution elasticities between factor inputs,
using P as instrument. ONN GEE ~.KK ONE CEN UK.? CEK ONK OKN SNE s KE SNK Elasticity f-ratio - 3.3653 -4.5539 -0.14096 - 1.7919 - 0.24978 - 3.6724 0.39729 4.3890 0.071998 4.4679 - 0.047005 -4.3471 - 0.25632 - 4.3475 0.29330 4.0557 0.29679 3.9816 0.86190 4.416 - 0.5627 - 4.306 0.64387 4.0218
The more interesting result is the negative cross-price elasticity between capital and energy. The correspond- ing substitution elasticity is also negative and significant at the 5% level. It implies that capital and energy are complements. There has long been controversy about energyxapital complimentarity. Most of the studies which used annual time series data have found energy and capital to be complements (Berndt and Wood [2]. Fuss [4], Hudson and Jorgenson [7] and Magnus [S]). However, some inter-country and cross-sectional stu- dies report the two inputs as substitutes (Griffin and Gregory [6]), one of the explanations, which seems more plausible in our case, relates to the time horizon for which the production relation is estimated.j In the short run, if other inputs can be substituted against the capital-energy aggregate, capital and energy may be complements. In our case also the period covered may not be long enough to let the energyxapital adjust- ments work out fully.
Conclusion
Nore: E= energy, N= labour, K= capital.
cross-price elasticity between oil and gas. Electricity and oil are substitutes. However, the degree of substitution is low. Generally, it seems that there has been little interfuel substitution in the manufacturing sector of Pakistan.
The purpose of this study was to estimate the extent of interfuel substitution as well as substitution between energy and non-energy inputs in the large-scale manu- facturing sector of Pakistan. The results do not provide evidence for significant interfuel substitution. As regards the substitution between energy and other inputs, our results indicate that energy and labour are substitutes whereas energy and capital are comple- ments.
In the second stage the aggregate model consisting of Equations (1) and (2) has been estimated using P,
obtained from Equation (5) as instrument for PE. The parameter estimates are presented in Table 3.
References
Thirteen out of eighteen coefficients are significant at the 5% level. The corresponding price and substitution elasticities are presented in Table 4. All the own-price elasticities take correct signs and are significant at the
‘There had been some rationing policies along with pricing policies, especially in relation to electricity. This may partly explain the relatively inelastic behaviour of energy.
%Mfin has discussed the plausibility of various explanations in more detail [5].
P. C. Apte, ‘Substitution among energy and non-energy inputs in selected Indian manufacturing industries: an econometric analysis’, Indian Economic Journal, Vol3 1, No 2, 1983, pp 71-90.
E. R. Berndt and D. 0. Wood, ‘Technology, prices and the derived demand for energy’, Review of Economics
and Statistics, Vol 57, No 3, August 1975, pp 259-268.
E. R. Berndt and D. 0. Wood, Technical Change, Tax Policy and the Derived Demand for Energy, mimeo,
University of British Columbia.
M. Fuss, ‘The demand for energy in Canadian manu- facturing: an example of the estimation of production structures with many inputs’, Journal of Econometrics, Vol 5, January 1977, ~~89-116.
The demandfor energy in the large-scale manufhcturing sector of Pakistan: F. Mahmud and S. Chishti 5 J. M. Griffin, ‘The energysapital complementarity
controversy: a progress report on reconciliation attempts’, in E. R. Berndt and B. C. Field, eds, Model-
ling and Measuring Natipzal Resource Substitution, MIT
Press, 1981.
6 J. M. Griffin and P. R. Gregory, ‘An intercountry translog model of energy substitution responses’,
American Economic Review, Vo166, December 1976,
pp 8455857.
7 E. A. Hudson and D. W. Jorgenson, ‘US energy policy and economic growth, 1975-2000’, The Bell Journal of
Economics and Management Science. Vo15, No2,
Autumn 1974.
8 J. R. Magnus, Substitution between energy and non- energy inputs in the Netherlands: 1950-1976’. Interna-
tional Economic Review, Vol20, June 1979, pp 465484.
9 S. N. A. Naqui, A. H. Khan. N. M. Khilji and A. M. Ahmad, The PIDE Macro-econometric Model. PIDE.
PBl091, Islamabad.
IO H. A. Pasha. A. Ghaus and S. Malik. ‘The economic cost of power outages in the industrial sector of Pakistan’, Energy Economics. Vol I I, No4. 1989, pp 301-318.
I I D. C. Vashist, ‘Substitution possibilities and price sensi- tivity of energy demand in Indian manufacturing’,
Indian Economic Journal. Vol32. No 2, 1984. pp 84-97.