HISTONE METHYLATION
AND METHYLTRANSFERASE ENZYME SET8
IN HEPATOCELLULAR CARCINOMA
A THESIS SUBMITTED TO
THE DEPARTMENT OF MOLECULAR BIOLOGY AND GENETICS AND THE INSTITUTE OF ENGINEERING AND SCIENCE OF
BILKENT UNIVERSITY
IN PARTIAL FULFILLMENT OF THE REQUIREMENTS FOR THE DEGREE OF
MASTER OF SCIENCE
BY
EYLÜL HARPUTLUGİL AUGUST 2010
ii
I certify that I have read this thesis and that in my opinion it is fully adequate, in scope and in quality, as a thesis for the degree of Master of Science.
Prof. Dr. Mehmet Öztürk
I certify that I have read this thesis and that in my opinion it is fully adequate, in scope and in quality, as a thesis for the degree of Master of Science.
Assist. Prof. Dr. Ali Osmay Güre
I certify that I have read this thesis and that in my opinion it is fully adequate, in scope and in quality, as a thesis for the degree of Master of Science.
Assoc. Prof. Dr. Hilal Özdağ
Approved for the Institute of Engineering and Science
Director of Institute of Engineering and Science Prof. Dr. Levent Onural
iii
ABSTRACT
HISTONE METHYLATION AND METHYLTRANSFERASE ENZYME SET8 IN HEPATOCELLULAR CARCINOMA
Eylül Harputlugil
MSc. in Molecular Biology and Genetics Supervisor: Prof. Dr. Mehmet Öztürk
August 2010, 83 Pages
Hepatocellular carcinoma (HCC) is one of the most prevalent and lethal cancers worldwide. The epigenetic modifications, which are involved in virtually all cellular processes are also involved in the carcinogenic process, and this is a growing new field of investigation. HCC has also been associated with several epigenetic aberrations which include the ones in histone modifications, histone methyltransferase enzymes, and the epigenetic machinery. The transition from cirrhosis to HCC is related to senescence bypass, and the distinctions between senescence and immortality in HCC cell lines. Global levels of H3K4me3, H3K9me3, H3K27me3, H3K36me3, H3R2me2, H3R17me2 and H4K20me3 histone marks were evaluated in well-differentiated and poorly differentiated HCC cell lines in the presence and absence of TGF-β induced senescence. No prominent changes in the levels of these histone modifications were indentified in response to TGF-β induced senescence. However, H4K20me3 levels appeared to correlate with the differentiation status of the cell lines, where a loss of methylation was observed in poorly differentiated cell lines. In order to address the mechanism of this loss, H4K20 specific methyltransferases were analyzed in terms of their transcript levels, and only the expression pattern of monomethyl transferase Set8 was found to correlate with the H4K20me3 methylation patterns. A potential role played by Set8 in HCC development was investigated via overexpression and knockdown studies. But no significant role could be attributed to this enzyme in this study.
iv
ÖZET
KARACİĞER KANSERİNDE HİSTON METİLASYONU VE METİLTRANSFERAZ ENZİMİ SET8
Eylül Harputlugil
Moleküler Biyoloji ve Genetik Yüksek Lisansı Tez Yöneticisi: Prof. Dr. Mehmet Öztürk
Ağustos 2010, 83 Sayfa
Karaciğer kanseri (Hepatoselüler Karsinom, HSK), dünya genelindeki en yaygın ve ölümcül kanser türlerinden biridir. Hücredeki hemen hemen her olayda rol oynayan epigenetik değişimler, kanser oluşumunda da etkilidir, ve bu araştırma alanı giderek genişlemektedir. HSK da, histon modifikasyonları, histon metiltransferaz enzimleri ve epigenetik mekanizmadaki bozuklukları da içeren çeşitli epigenetik bozukluklar ile özdeşleştirilmiştir. Sirozdan karaciğer kanserine geçiş, hücre yaşlanması (senesans) durumunun aşılması ile ilintilidir, ve bu durum hücre hattı modellerinde görülen ölümsüzlük ve hücre yaşlanması durumları arasındaki farklar ile de ilişkilendirilmiştir. H3K4me3, H3K9me3, H3K27me3, H3K36me3, H3R2me2, H3R17me2 ve H4K20me3 histon işaretlerinin global seviyeleri, iyi diferansiye ve kötü diferansiye hücre hatlarında, ölümsüzlük ve TGF-β tarafından indüklenen hücre yaşlanması durumlarında incelenmiştir. TGF-β’nın indüklediği hücre yaşlanması durumunda, sözü edilen histon işaretlerinde göze çarpan bir değişiklik görülmemiştir. Buna karşın, H4K20me3 seviyelerinin hücrelerin farklılaşma durumu ile ilişkisi olduğu, ve kötü diferansiye hücre hatlarına özgü bir kayba uğradıkları saptanmıştır. Söz konusu kaybın mekanizmasını araştırmak amacıyla, H4K20 rezidüsüne özgü metiltransferazların tüm izoformlarının ifade seviyeleri hücre hatlarında incelenmiş, ve yalnızca Set8 enziminin ifade düzeninin H4K20 trimetilasyon düzeni ile örtüştüğü tespit edilmiştir. Set8 enziminin hepatoselüler karsinom oluşumunda oynadığı olası bir rolü araştırmak amacıyla enzimin ifadesini arttıran ve susturan çalışmalar yapılmıştır. Ancak sözü edilen çalışmalar sonucunda Set8 enzimine bu konuda anlamlı bir görev atfedilememiştir.
v
vi
ACKNOWLEDGEMENTS
First of all, I would like to thank my supervisor, Prof. Dr. Mehmet Öztürk for his guidance throughout the project. He is a great scientist, and it was a privilege to work in his laboratory.
I would also like to thank Assoc. Prof. Dr. Rengül Çetin Atalay, Assoc. Prof. Dr. İhsan Gürsel and Tamer Kahraman, Assoc. Prof. Dr. Esra Erdal and İmge Kunter from 9 Eylül University, for providing me experimental support.
It was great to have people like Füsun Elvan, Bilge Kılıç and Abdullah Ünnü in the lab, with their invaluable help, they made life a lot easier.
All past and present members of our group, especially Gökhan Yıldız, Haluk Yüzügüllü, Özge Yüzügüllü, Tülin Erşahin, Ebru Bilget Güven, Mustafa Yılmaz, Şerif Şentürk, İrem Durmaz, Dr. Ayça Arslan Ergül, Dr. Sevgi Bağışlar, Dr. Mine Mumcuoğlu and Suna Pelin Gülay have been a wonderful help in the laboratory and also great friends outside.
I would like to thank all of my friends, especially İrem Gürbüz, Nilüfer Sayar and Gurbet Karahan for their endless support whenever I needed anything.
This master thesis work was supported by grants from TÜBİTAK and DPT to Mehmet Öztürk. Additionally, I was personally supported by TÜBİTAK, through BIDEB 2210 scholarship.
vii
TABLE OF CONTENTS
THESIS TITLE ... I SIGNATURE PAGE ... II ABSTRACT ... III ÖZET ... IV DEDICATION ... V ACKNOWLEDGEMENTS ... VI LIST OF TABLES ... XI LIST OF FIGURES ... XIICHAPTER 1. INTRODUCTION ...1
1.1. HEPATOCELLULAR CARCINOMA ...1
1.1.1 Aetiologies of hepatocellular carcinoma ...1
1.1.2 Pathogenesis of hepatocellular carcinoma ...2
1.1.3 Cellular senescence ...3
1.1.4 Senescence and hepatocellular carcinoma ...4
1.2. EPIGENETIC CHANGES AND HEPATOCELLULAR CARCINOMA ...5
1.2.1 DNA methylation ...6
1.2.2 Histone variants and genomic imprinting ...7
1.2.3 Covalent histone modifications ...8
viii
1.2.3.2 Histone methylations, methyltransferase and demethylase enzymes ... 10
1.2.3.3 Histone 4 lysine 20 methylation ... 13
1.2.3.4 Histone 4 lysine 20 methyltransferases and their cellular functions ... 14
CHAPTER 2. OBJECTIVES AND RATIONALE ... 16
CHAPTER 3. MATERIALS AND METHODS ... 17
3.1 MATERIALS ... 17
3.1.1 Reagents ... 17
3.1.2 PCR and cDNA synthesis reagents ... 17
3.1.3 Nucleic acids and oligonucleotides ... 18
3.1.4 Electrophoresis, photography and spectrophotometer ... 18
3.1.5 Cell culture reagents and materials ... 18
3.1.6 Antibodies ... 19
3.2 SOLUTIONS AND MEDIA ... 20
3.2.1 General and cell culture solutions ... 20
3.2.2 Sodium Deodecyl Sulphate (SDS) – Polyacrylamide Gel Electrophoresis (PAGE) and immunoblotting materials and solutions ... 20
3.2.3 Immunoperoxidase and Immunofluorescence solutions ... 21
3.2.4 Senescence associated β-galactosidase (SABG) assay solutions ... 22
3.2.5 BrdU incorporation assay solutions ... 22
3.3 METHODS ... 22
3.3.1 General methods ... 22
3.3.1.1 Quantification and qualification of nucleic acids ... 22
3.3.1.2 Agarose gel electrophoresis of nucleic acids ... 22
3.3.1.3 Computer, software and database tools ... 23
3.3.2 Cell and tissue culture techniques ... 23
ix
3.3.2.2 Thawing cells ... 24
3.3.2.3 Growth conditions of cells ... 24
3.3.2.4 Cryopreservation of cells ... 25
3.3.2.5 Transient transfection of eukaryotic cells using Lipofectamine 2000 reagent ... 25
3.3.2.6 Transient transfection of eukaryotic cells using Lipofectamine RNAi-max reagent ... 26
3.3.2.7 Lentiviral Infection of eukaryotic cells... 26
3.3.3 Extraction of total RNA from cultured cells and tissue samples ... 27
3.3.4 First strand cDNA synthesis ... 27
3.3.5 Primer design for gene expression analysis by RT-PCR ... 28
3.3.6 Gene expression analysis by semi-quantitative RT-PCR ... 29
3.3.7 Gene expression analysis by quantitative RT-PCR ... 29
3.3.8 Crude total protein extraction from cultured cells ... 30
3.3.9 Acid extraction of histones ... 30
3.3.10 Western blotting ... 30
3.3.11 Immunoperoxidase staining ... 32
3.3.12 BrdU incorporation and immunofluorescence staining... 32
3.3.13 SABG assay ... 33
3.3.14 Flow cytometry of histone residues ... 33
3.3.15 Cellular growth rate measurements with Roche xCELLigence system ... 34
CHAPTER 4. RESULTS ... 35
4.1. HISTONE METHYLATION ... 35
4.1.1 Histone methylation levels in HCC cell lines ... 35
4.1.1.1 Histone H3 lysine 27 trimethylation in HCC cell lines ... 36
x
4.1.1.3 Histone H3 lysine 9 trimethylation in HCC cell lines ... 41
4.1.1.4 Histone H3 lysine 36 trimethylation in HCC cell lines ... 43
4.1.1.5 Histone H3 arginine 2 dimethylation in HCC cell lines ... 46
4.1.1.6 Histone H3 arginine 17 dimethylation in HCC cell lines ... 48
4.1.1.7 Histone H4 lysine 20 trimethylation in HCC cell lines ... 51
4.1.1.8 Histone H4 lysine 20 monomethylation in HCC cell lines ... 55
4.2 HISTONE METHYLTRANSFERASES THAT ACT ON H4K20 ... 56
4.2.1 H4K20 methyltransferases Suv4-20h1 and Suv4-20h2 ... 56
4.2.1.1. Suv4-20h1 levels in HCC cell lines ... 58
4.2.1.2. Suv4-20h2 levels in HCC cell lines ... 59
4.2.2 H4K20 methyltransferase Set8 ... 60
4.2.2.1 Set8 Levels in HCC cell lines ... 61
4.2.2.2 Set8 levels in patient liver tissue samples ... 64
4.2.2.3 Set8 Overexpression in SNU-475 cell line ... 65
4.2.2.4 Comparison of parental SNU-475 and SNU-475-Set8 overexpression clone ... 69
4.2.2.5 Set8 siRNA knockdown... 71
CHAPTER 5. DISCUSSION ... 73
CHAPTER 6. FUTURE PERSPECTIVES ... 77
xi
LIST OF TABLES
Table 1.1: Summary of histone methyltransferases and histone demethylases……..11
Table 3.1: Antibody dilutions……….………...………...…...20
Table 3.2: siRNA sequences………...26
Table 3.3: Primers and working conditions………28
Table 4.1: Summary of histone methylation marks and H4K20 methyltransferase levels in HCC cell lines………....72
xii
LIST OF FIGURES
Figure 1.1: Cell cycle dependency of Set8 and Suv4-20 activities ... 15
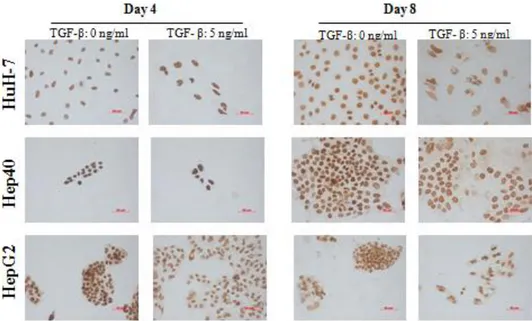
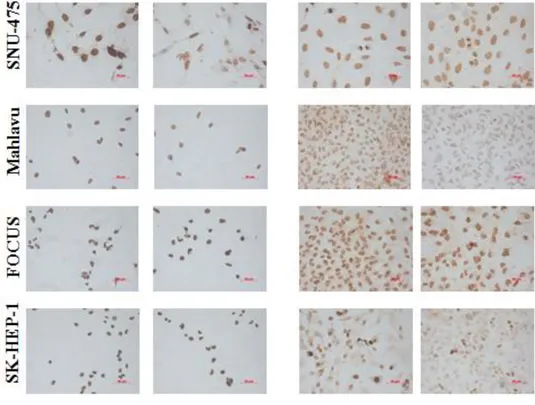
Figure 4.1.1: Global levels of H3K27me3 in HCC cell lines in the presence or absence of TGF-β induced senescence; determined by immunoperoxidase staining. ... 36
Figure 4.1.1 (continued): Global levels of H3K27me3 in HCC cell lines in the presence or absence of TGF-β induced senescence; determined by immunoperoxidase staining. ... 38
Figure 4.1.2: Global levels of H3K4me3 in HCC cell lines in the presence or absence of TGF-β induced senescence; determined by immunoperoxidase staining. ... 39
Figure 4.1.2 (continued): Global levels of H3K4me3 in HCC cell lines in the presence or absence of TGF-β induced senescence; determined by immunoperoxidase staining. ... 40
Figure 4.1.3: Global levels of H3K9me3 in HCC cell lines in the presence or absence of TGF-β induced senescence; determined by immunoperoxidase staining. ... 41
Figure 4.1.3 (continued): Global levels of H3K9me3 in HCC cell lines in the presence or absence of TGF-β induced senescence; determined by immunoperoxidase staining. ... 43
Figure 4.1.4: Global levels of H3K36me3 in HCC cell lines in the presence or absence of TGF-β induced senescence; determined by immunoperoxidase staining ... 44
Figure 4.1.4 (continued): Global levels of H3K36me3 in HCC cell lines in the presence or absence of TGF-β induced senescence; determined by immunoperoxidase staining. ... 45
Figure 4.1.5: Global levels of H3R2me2 in HCC cell lines in the presence or absence of TGF-β induced senescence; determined by immunoperoxidase staining. ... 46
xiii
Figure 4.1.5 (continued): Global levels of H3R2me2 in HCC cell lines in the presence or absence of TGF-β induced senescence; determined by immunoperoxidase staining. ... 48
Figure 4.1.6: Global levels of H3R17me2 in HCC cell lines in the presence or absence of TGF-β induced senescence; determined by immunoperoxidase staining ... 49
Figure 4.1.6 (continued): Global levels of H3R17me2 in HCC cell lines in the presence or absence of TGF-β induced senescence; determined by immunoperoxidase staining ... 50
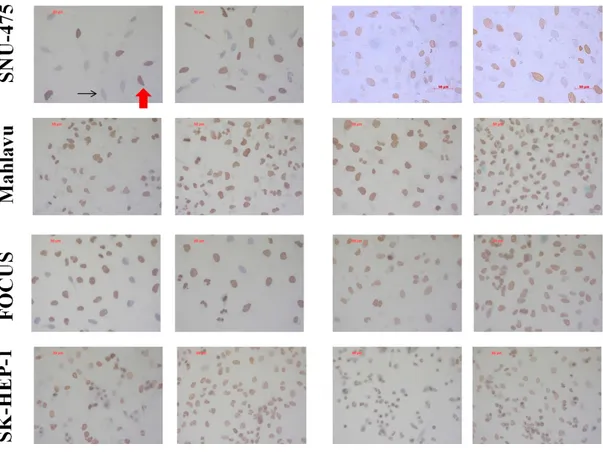
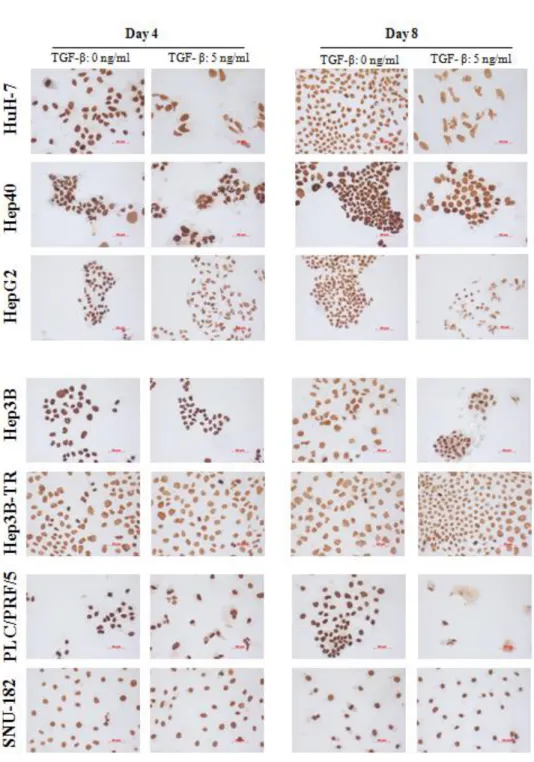
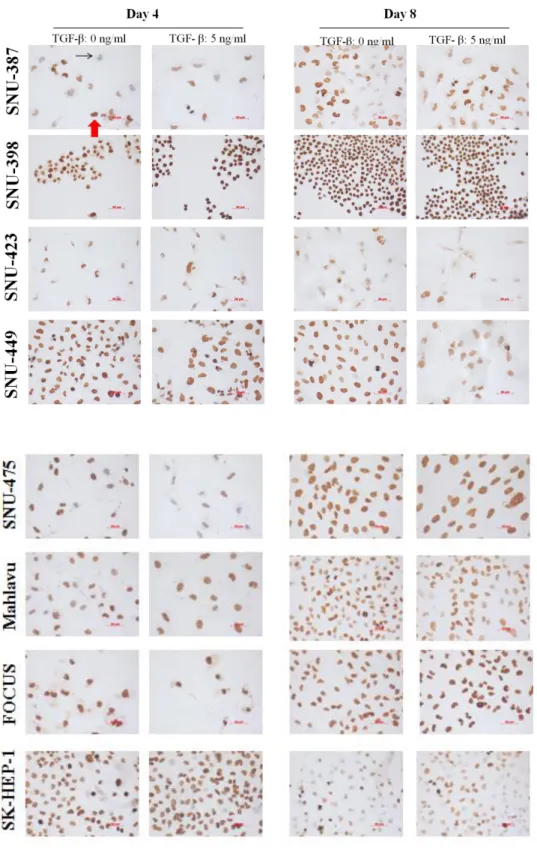
Figure 4.1.7: Global levels of H4K20me3 in HCC cell lines in the presence or absence of TGF-β induced senescence; determined by immunoperoxidase staining. ... 52
Figure 4.1.7 (continued): Global levels of H4K20me3 in HCC cell lines in the presence or absence of TGF-β induced senescence; determined by immunoperoxidase staining. ... 53
Figure 4.1.8: H4K20me3 levels in HCC cell lines; determined by western blotting. 54
Figure 4.1.9: H4K20me1 levels in HCC cell lines; determined by western blotting. 55
Figure 4.2.1.a: Suv4-20h1 transcript variants and RT-PCR primers. ... 57
Figure 4.2.1.b: Suv4-20h2 transcript variants and RT-PCR primers. ... 57
Figure 4.2.2: Suv4-20h1 levels in HCC cell lines, determined by RT-PCR. ... 58
Figure 4.2.3.a: Suv4-20h2 Variants 1 and 2 levels in HCC cell lines, determined by semi quantitative RT-PCR. ... 59
Figure 4.2.3.b: Suv4-20h2 Variant 3 is not expressed in HCC cell lines, determined by semi quantitative RT-PCR. ... 59
Figure 4.2.4: Set transcript variants and RT-PCR primers. ... 61
Figure 4.2.5.a: Set8 transcript variants 1 and 4 levels in HCC cell lines, determined by semi-quantitative RT-PCR. ... 62
xiv
Figure 4.2.5.b: Set transcript variants 1 and 4 levels in HCC cell lines, by quantitative RT-PCR.. ... 62
Figure 4.2.5.c: Set Variant 3 is not expressed in HCC cell lines, determined by semi-quantitative RT-PCR. ... 63
Figure 4.2.5.d: Expression of Set8 full length product in HCC cell lines, determined by RT-PCR. ... 63
Figure 4.2.6: Set8 expression in patient liver tissue samples, determined by quantitative RT-PCR ... 64
Figure 4.2.7: Clustal W multiple sequence alignment of the T8950-Set8 overexpression vector with the Set8 cDNA sequences from NCBI and Ensembl ... 65
Figure 4.2.8.a: Set8 mRNA levels in parental SNU-475 and Set8 overexpression clones, determined by quantitative RT-PCR. ... 66
Figure 4.2.8.b: HA-tag immunoblotting in parental SNU-475, SNU-475-Set8, and transiently transfected SNU-475 in whole cell lysates. ... 67
Figure 4.2.9.a: H4K20me1 levels were not affected by Set8 overexpression: western blot. ... 67
Figure 4.2.9.b: H4K20me1 levels were not affected by Set8 overexpression: flow cytometry ... 68
Figure 4.2.10: There is no significant difference between SNU-475 and SNU-475-Set8 in terms of BrdU incorporation. ... 69
Figure 4.2.11: There is no significant difference between SNU-475 and SNU-475-Set8; determined by xCELLigence system. ... 70
1
CHAPTER 1. INTRODUCTION
1.1. HEPATOCELLULAR CARCINOMA
More than 80 % of liver cancers arise from hepatocytes or hepatocyte progenitors, which are the parenchymal cells of the liver (American Cancer Society, Facts and Figures 2010). These cancers are accordingly named as hepatocellular carcinoma (HCC). HCC is highly frequent, being the fifth most frequent cancer worldwide, and has increasing rates of incidence and mortality in the West since 1980s (Bruix, J et al, 2004). HCC is also an important cause of cancer related death, with a 5 year relative survival rate of 14 % (American Cancer Society, 2010).
1.1.1 Aetiologies of hepatocellular carcinoma
There are several aetiological factors that have been associated with hepatocarcinogenesis, which include: chronic alcohol abuse, Aflatoxin B1 exposure; which might occur by the consumption of contaminated food, chronic HBV or HCV infections, non-alcoholic fatty liver disease; which is also associated with obesity, long-term oral contraceptive use in women, diabetes, and finally certain metabolic disorders such as hereditary haemochromatosis (Badvie S, et al, 2000; Farazi PA, et al, 2006). The most prevalent risk factors of HCC are variable due to regionality, for example chronic HBV and HCV infections are the major risk factors worldwide, whereas these cases constitute less than half in the US. In most western countries, the major risk factors of hepatocarcinogenesis are alcoholic cirrhosis and obesity related non-alcoholic fatty liver disease (American Cancer Society, 2010).
2
1.1.2 Pathogenesis of hepatocellular carcinoma
Molecular mechanisms leading to the development of HCC are quite variable, representing the variability of HCC aetiology, which results in high genetic and phenotypic heterogeneity of these tumors. HCC development occurs in chronically injured livers, in a multi-step process (Feo F, et al, 2009). Liver injury might result from one or more of the major HCC risk factors, such as chronic Hepatitis B Virus (HBV) or Hepatitis C Virus (HCV) infections, alcohol-related cirrhosis, Aflatoxin B1 exposure, or genetic disorders. The initial liver injury manifests itself as necrosis, which is followed by continuous cycles of proliferation and damage. On the one hand, these continuous cycles of proliferation and necrosis cause telomere shortening, which eventually result in hepatocyte proliferative arrest. On the other hand, liver injury provokes activation of stellate cells, which play role in the synthesis and deposition collagen. Both of these contribute to the formation of abnormal liver nodules, together with fibrous scar tissue, a state which is called cirrhosis (Feo F, et al, 2009; Farazi PA, et al, 2006). Formation of hyperplastic nodules is the next step in the pathogenesis of HCC, which are still considered as pre-malignant lesions. Together with the accumulation of genetic damage, leading to moderate genomic instability, these pre-malignant lesions progress into dysplastic nodules which have the ability of autonomous growth. Dysplastic nodules are composed of cells with altered characteristics such as increased nuclear to cytoplasmic ratio, and they tend to form mild trabecular disarrays (Feo F, et al, 2009).
Where telomere shortening is associated with chronic liver disease and cirrhosis as mentioned, telomerase reactivation is an important characteristic of HCC, together with notable genomic instability and either mutation or loss of p53 tumor suppressor. Although, the specific stages at which these changes occur is not clear, aided with these molecular changes, dysplastic nodules evolve progressively into different stages of hepatocellular carcinoma (Farazi PA, et al, 2006). HCC can be classified into four different stages, namely: well differentiated, moderately differentiated, poorly differentiated and undifferentiated. Generally, HCC arises as a well
3
differentiated cancer, which then dedifferentiates into the other stages through a stepwise process (Kojiro M, 2005; Yuzugullu H, et al, 2009).
1.1.3 Cellular senescence
The term senescence means ―becoming old‖ in the general sense, and it is associated with certain morphological and gene-expression related features. The inability of cell strains to grow indefinitely in culture was first described by Hayflick, who used the term ―cellular senescence‖ (Weinberg RA, The Biology of Cancer). Replicative senescence is characterized by irreversible cell cycle arrest due to telomere shortening, and in addition to that, there are also other immature senescence types which occur due to stress and damage (Ozturk M, et al, 2009). These stress and damage conditions that are known to induce senescence include oncogenic stress, which results in oncogene induced senescence (Bartkova J, et al, 2006; Di Micco R, et al, 2006; Mallette FA, et al, 2007) and oxidative stress, which results in Reactive Oxygen Species (ROS) induced senescence. Additionally, exposure to certain signaling molecules have also been shown to induce senescence, such as TGF-β or β-interferon in various cell types (Senturk S, et al, 2010; Moisseva O, et al, 2006).
Senescent cells exhibit certain characteristic features such as senescence-associated β-galactosidase (SABG) activity at pH 6.0, altered morphology resulting in diverse morphotypes and usually bigger cells, formation of senescence-associated DNA damage foci and senescence associated heterochromatin foci, chromosomal aberrations and polyploidy, and alterations in the expression of several genes. Although they all involve different mechanisms, all senescence pathways converge on the DNA damage response (DDR) (Ozturk M, et al, 2009). In telomere dependent senescence pathway, unprotected telomere ends resulting from telomere shortening are sensed as DNA damage. In oncogene induced senescence pathway, hyper-replication of cells which is promoted by the oncogenes result in accumulation of DNA replication errors. And finally in ROS induced senescence pathway, reactive oxygen species directly cause DNA damage themselves. Therefore, persistent DNA
4
damage and DDR is of pivotal importance in all senescence pathways. The DNA damage response involves activation of signaling cascades that involve the actions of ATM/ATR and CHK1/CHK2, and converge on p53 protein, which acts through p21cip1 cyclin dependent kinase inhibitor (CDKI) activation. Alternative pathways converge on p16INK4a and p15INK4b CDKIs. Both CDKI pathways lead to the activation of retinoblastoma protein (pRb), which then plays role in the arrest of cell cycle, and thus senescence phenotype occurs (Ozturk M, et al, 2009; Senturk S, et al, 2010).
1.1.4 Senescence and hepatocellular carcinoma
Like most of the human somatic cells, hepatocytes normally do not have telomerase activity and they do not proliferate rapidly. The continuous rounds of cell division and damage cycles which pave the way to chronic liver injury and cirrhosis also play role in the shortening of telomeres. Therefore, cellular senescence which is associated with hepatocyte telomere shortening is a general characteristic of liver cirrhosis. This was illustrated by SABG staining in normal and cirrhotic livers, which revealed 84 % senescent cells in cirrhosis as opposed to only 10 % in normal liver (Wiemann SU, et al, 2002). However, in order to undergo malignant transformation, cells have to find a way to regain their ability to proliferate, and to maintain their telomeres while doing so. In that context, cellular senescence acts as a barrier in front of malignant transformation of hepatocytes to hepatocellular carcinoma. This was also supported by a study which showed 60 % SABG staining in HCC samples (Paradis V, et al, 2001).
Numerous genetic and epigenetic aberrations have been associated with hepatocarcinogenesis, that effect important actors of senescence induction, therefore help the cells to overcome the senescence barrier. These aberrations include inactivating mutations of p53, which is frequently observed in HCC (Soussi, T, 2007). Despite the lack of frequent mutations, CDK inhibitor p16INK4a is epigenetically silenced in half of the HCCs through promoter methylation (Ozturk
5
M, et al, 2009). According to a study which analyzed molecular aberrations in HCC samples from different aetiological backgrounds, 83 % of the analyzed HCC samples displayed alterations in the pRb pathway components, 31 % displayed alterations in p53 pathway components, and 30 % displayed both (Edamoto Y, et al, 2003; Ozturk M, et al, 2009).
Taken as a whole, the aberrations explained above are likely to play an important role in overcoming the senescence barrier, together with the possible involvement of telomerase reactivation. Molecular understanding of the mechanisms that drive senescence, senescence bypass, and senescence induction in cancer cells is very important since senescence induction is considered as a potential new area of anti-cancer therapy. A recent study by our group described the molecular mechanisms of TGF-β induced senescence in HCC cell lines, and showed that the specific senescence program was dependent on p21Cip1 and p15INK4b, but independent from p53 and p16INK4a (Senturk S, et al, 2010).
1.2. EPIGENETIC CHANGES AND HEPATOCELLULAR CARCINOMA
Although originally defined in a different context, the term epigenetics is currently used to mean heritable changes in the DNA or its associated proteins, which is independent from the DNA sequence information (Feinberg AP, et al, 2010). Mechanisms of epigenetic control include DNA methylation, covalent histone modifications and involvement of histone variants in the chromatin structure, which actively take role in an interplay. These factors, together with chromatin remodeling complexes and non-coding RNAs, play role in the determination of the chromatin structure. They interact in order to attain nuclear compartmentalization, as well as to establish heterochromatic and euchromatic regions of the chromatin. Epigenetic control has been shown to be involved in virtually all biological processes, which vary from embryogenesis, and cellular differentiation to learning, memory and aging (Delcuve GP, et al, 2009). As can easily be seen from this fact, errors which occur during the establishment or maintenance of the epigenetic codes play role in the
6
development of various diseases including cancer. Since epigenetic codes are more versatile in comparison to the genetic code, it is important to understand the mechanisms involved in the formation and upholding of these codes, in order to be able to reverse such errors, which makes epigenetic therapy an attractive new field.
1.2.1 DNA methylation
In the human genome, most of the CpG dinucleotides are methylated at the C5 position of cytosine bases, which is commonly referred to as DNA methylation. About 50 % of the CpG dinucleotides are concentrated in promoter regions, as well as 5’ untranslated regions of genes, and the remaining 50 % is located in the intragenic regions or the gene bodies (Delcuve GP, et al, 2009). These regions with concentrated CpG dinucleotides are referred to as CpG islands. DNA methylation which occurs in the CpG islands at gene promoters has generally been associated with gene silencing, in contrast to the DNA methylation in gene bodies, which might be involved in transcriptional activation (Hellman A, et al, 2007). Additionally, CpG island methylation is also observed in repetitive DNA sequences and transposable elements, and it might play a role in preventing translocations (Esteller, M, 2007).
Cancer development involves two type of aberrant DNA methylation processes, both hypermethylation and hypomethylation. The better established mode of DNA methylation alteration observed in various cancers is DNA hypermethylation found in the promoter regions in several tumor suppressors, which results in silencing of those genes. This process is responsible, at least in part, for escaping from apoptosis, loss of cell adhesion and angiogenesis, which are common features of tumors (Herceg Z, 2007). Although the direct mechanism of action has not been well established, global hypomethylation is observed in almost all types of cancers. It is hypothesized that global hypomethylation might act through several mechanisms which include: loss of imprinting, inappropriate cell type expression, genome vulnerability or the activation of endoparasitic sequences (Esteller, M, 2007).
7
Studies have revealed that promoter hypermethylation of tumor suppressor genes is an early event in hepatocellular carcinogenesis, given that it has been observed in non-cancerous liver tissues. The genes that have been shown to be silenced via promoter hypermethylation in HCC include: p16INK4a, DLC1, E-Cadherin, PTEN, and many others (Wong CM, et al, 2007).
1.2.2 Histone variants and genomic imprinting
Genomic imprinting is an epigenetically regulated phenomenon, which is observed in a limited set of genes, where genes exhibit expression differences depending on whether they are paternally or maternally inherited (Jelinic P, et al, 2007). Genes which are subject to genomic imprinting appear in clusters, and the expression from those genes is coordinately regulated by imprinting control centers. DNA methylation is observed in only one allele in imprinting control centers, depending on which allele is to be expressed, additionally covalent histone modifications and recruitment of non conventional histone variants are involved in the process (Delaval K, et al, 2004). This heterochromatin structure is established in embryonic stages, and maintained in the adult organism, misregulation of which might result in loss of imprinting: one of the accepted hallmarks of cancer (Jelinic P, et al, 2007).
Genes which are subject to genomic imprinting usually have functions in embryonic development, placenta formation and adult metabolism. Some of the best studied examples of these genes include: Igf2, H19, Igf2R and Kvlqt. H19 imprinting control center is located at chromosome 11p15.5, and is responsible for the expression from Igf2 and H19 genes, which have opposite monoallelic expression (Matouk IJ, et al, 2007). Igf2 gene codes for a fetal growth factor, and H19 codes for a non translated RNA message, and anomalies of both have been associated with the pathogenesis of HCC (Boyault S, et al, 2007). In a study which compared normal liver and HCC samples, it was shown that around 40 % of the studied HCC samples displayed
8
abnormal genomic imprinting in at least one of these two genes, which was manifested as biallelic expression due to loss of imprinting (Wu J, et al, 2008).
Histone variants, which are low expressed, non-allelic forms of the conventional histones, serve in providing specific structural and functional characteristics to the nucleosome (Talbert PB, et al, 2010). These characteristics include gene expression control, genomic imprinting, X-chromosome inactivation and DNA repair. For example, macro-H2A1 histone variant was shown to be enriched in the inactive X-chromosome, and imprinted loci such as the Igf2/H19 imprinting control center, whereas H2ABbd histone variant was implicated in promoting gene expression (Mietton F, et al, 2009; Sha K, 2008). More interestingly, histone variants have also been implicated in processes such as senescence, specifically macro-H2A histone variant nucleosomes were found to be enriched in senescence-associated heterochromatin foci, although it is not clear that the role played by this histone variant is causative (Zhang R, et al, 2005; Bushbeck M, et al, 2010). Additionally, low levels of macroH2A histone variant were found to be in correlation with high proliferation and bad prognosis in lung cancer (Bushbeck M, et al, 2010). Taken as a whole, these cases exemplify the potential importance of histone variants in cancer.
1.2.3 Covalent histone modifications
DNA is wrapped around octameric protein structures which consist of the four so called core histones: H2A, H2B, H3 and H4. The histone octamer has a globular domain, which functions in packaging the DNA, as well as free ―tail‖ structures which protrude out from the N-terminal ends of histone proteins. These tail regions of histones are particularly of interest, due to the importance of diverse sets of covalent modifications that they can be subjected to. At least eight different types of such modifications have been described in no less than 60 different modification sites to date, which include: acetylation of lysines, methylation of lysine and arginines, phosphorylation of serine and threonines, ubiquitylation of lysines, sumoylation of lysines, deimination of arginines, ADP ribosylation of glutamic acids,
9
and finally proline isomerization, which are all associated with certain biological processes (Kouzarides T, 2007; Wang GG, et al, 2007). Among all these modifications, the best studied ones are acetylations, methylations and phosphorylations.
These modifications were shown to get involved in biological processes by two mechanisms. The first mechanism is interfering with nucleosome contacts, which results in disentanglement of the chromatin structure. The second and better characterized mechanism involves interacting with and recruiting certain proteins to the nucleosome, or oppositely, detaching certain proteins from the nucleosome. Hence, histone modifications are key players of the determination of the accessibility of the chromatin, and their involvement in cancer pathogenesis is a growing new field (Kouzarides T, 2007; Wang GG, et al, 2007).
1.2.3.1 Histone acetylations, acetyltransferase and deacetylase enzymes
Several lysine residues on histone H3 and H4 tails are subject to acetylation by numerous histone acetyltransferase enzymes (HATs), some of which are: HAT1, CBP/P300, PCAF/GCN5, TIP60 and HB01 (Kouzarides T, 2007). HATs are poorly specific for their histone and non-histone substrates in the sense that they are capable of acetylating multiple residues on histones, and they also have non-histone substrates including E2F, p53 and pRb (Yang XJ, et al, 2004; Wang GG, et al, 2007).
Since the acetylation status of histone tails is of crucial importance for the formation of chromatin architecture, as well as regulation of gene expression, it is easy to deduce that misregulation of HAT activity might be involved in pathological conditions. Accordingly, disruption and misregulation of several HATs have been associated with different cancers. Mechanistically, decreased levels of histone acetylation is thought to give rise to a more compact chromatin structure, and hence transcription factors and RNA polymerases cannot access the chromatin.
10
Importantly, loss of acetylation in histone 4 lysine 16 has been detected in repetitive DNA sequences in many primary tumors (Wang GG, et al, 2007). However, interestingly, both aberrant activation and inactivation of HDAC enzymes were observed in malignancies (Ellis L, et al, 2009).
Histone acetylation is dynamic, and can be reversed by histone deacetylase enzymes (HDACs) which have opposing roles with HATs. HDACs are likely to function in transcriptional repression since they decrease histone acetylation levels. There are more than 10 HDACs currently identified, and they are similarly misregulated in various cancer types (Ellis L, et al, 2009). Again similarly as the HATs, HDACs are also poorly specific for their histone and non-histone substrates. Instead, the general paradigm is that they gain specificity by interacting with proteins which carry HDACs to their specific localizations. In the recent years HDAC inhibitors have emerged as a new class of anticancer drugs showing potential. Although the mechanism of action of this new class of drugs in still incompletely described, it is known that they display a variety of cellular effects. Some of these effects are induction of apoptosis, differentiation and growth arrest (Wang GG, et al, 2007).
1.2.3.2 Histone methylations, methyltransferase and demethylase enzymes
Numerous lysine and arginine residues in the N-terminal tails of histone H3 and histone H4 are subject to methylation by histone methyltransferase enzymes (HMTs). All of these residues can have mono, di or trimethyl groups attached to them. Although it was long thought that histone lysine methylation is irreversible, it is now well established that lysine methylation is also dynamically regulated through several demethylase enzymes (Trojer P, et al, 2006; Kouzarides T, 2007). A summary of HMT and demethylase enzymes acting on several residues is shown in Table 1.1.
11
Residues Modified
Lysine
Methyltransferases Lysine Demethylases
Arginine Methlytransferases H3K9 SUV39H1 SUV39H2 G9a ESET/SETDB1 EuHMTase/GLP CLL8 RIZ1 JHDM2a JHDM2b JMJD2A/JHDM3A JMJD2B JMJD2C/GASC1 JMJD2D H3K4 MLL1 MLL2 MLL3 MLL4 MLL5 SET1A SET1B SET1 LSD1/BHC110 H3K36 SET2 NSD1 SYMD2 JHDM1a JHDM1b JMJD2A/JHDM3A JMJD2C/GASC1 H3K79 DOT1 H4K20 SET8 SUV420H1 SUV420H2 H3K27 EZH2 H3 (R2, R17, 26) CARM1 H4R3 PRMT4 H3R8, H4R3 PRMT5
Table 1.1: Summary of histone methyltransferases and histone demethylases. (Adapted from
Kouzarides T, 2007)
Involvement of histone methylation processes in various biological phenomena is diverse. Unlike the relative uniformity of the association between histone acetylation and open chromatin conformation, the methylated residues and the degree of methylation result in dramatically different outcomes (Trojer P, et al, 2006). Generally, histone 3 lysine 4 (H3K4), histone 3 lysine 36 (H3K36), and histone 3
12
lysine 79 (H3K79) methylations have been associated with transcriptional activation and a more relaxed and open chromatin structure in contrast to histone 3 lysine 9 (H3K9), histone 3 lysine 27 (H3K27), and histone 4 lysine 20 (H4K20) methylations, which were found to be enriched in heterochromatic regions, and were linked with transcriptional repression, as well as a condensed chromatin state (Trojer P, et al, 2006; Wang GG, et al, 2007). Nevertheless, exceptions to this generalization do exist, and have been described by newly emerged next generation sequencing technologies which were coupled with chromatin immunoprecipitation (ChIP) technique. According to the analysis of various histone modifications on the whole genome scale, it was revealed that H3K27, H3K9, and H4K20 monomethylated forms were associated with gene activation. The trimethylated forms of H3K27 and H3K9 were confirmed to be involved in gene repression, which is in accordance with the conventional understanding. Still, trimethylated H3K79 was also implicated in gene repression (Ellis L, et al, 2009).
There are several lines of evidence showing the involvement of various histone methylations, and the enzymes functioning in histone methylation processes, in carcinogenesis, including hepatocarcinogenesis (Ellis L, et al, 2009). Some of the examples include tumor cell selective loss of global H4K20me3 levels, which is very well established (Fraga MF, et al, 2005). This was observed in numerous cancer models, including a rodent model of HCC, which was induced by methyl-deficient diet (Pogribny IP, et al, 2006). Some other HMTs and related proteins, aberrations of which have been associated with HCC include NSD1, a methyltransferase acting on H3K36, and serving in context dependent transcriptional activation or repression; HP1, a protein which binds to methylated H3K9 and has a vital role on transcriptional silencing and heterochromatin formation; and finally RIZ1/PRDM2, a family of SET-domain containing methyltransferases, acting also on H3K9 (Wang GG, et al, 2007).
13
1.2.3.3 Histone 4 lysine 20 methylation
Although histone H4 tail comprises 5 lysine residues, lysine 20 is the only one subject to methylation in mammals. H4K20 methylation is present in a wide variety of species, ranging from Schizosaccharomyces pombe (S. pombe) to human, with different levels of elaboration. In S. pombe, mono, di and trimethyl forms of H4K20 are all established by the same enzyme: Set9. Nevertheless, in humans, H4K20 methylation is more complex, resulting from the involvement of multiple methyltransferase enzymes, as well as multiple proteins which interact with H4 with different affinities depending on the degree of methylation (Yang H, et al, 2009). As can be judged from this level of elaboration, mono, di and trimethyl forms of H4K20 are likely to play distinct roles in the cell.
The cellular distribution of mono, di and trimethylated forms of H4K20 was analyzed in multiple settings such as normal and cancerous human cells, as well as drosophila, mouse and rat cells by using mass spectrometry. The analysis revealed that the dimethylated form of H4K20 was much more abundant than the other two in all cases. The results of the analysis on asynchronous HeLa (cervical cancer derived cell line) cells revealed a distribution of 10 % monomethylated, 80 % dimethylated and 5 % trimethylated H4K20 (Yang H, et al, 2009).
The sub nuclear distribution of these forms is rather contradictory. H4K20me1 has usually been associated with condensed chromatin and the inactivated X chromosome, and it was proposed that this histone modification facilitates chromatin maturation (Trojer P, et al, 2006; Scharf AND; 2009). It was proposed that, L3MBTL1 protein binds preferentially to monomethylated and dimethylated H4K20, and assists compaction of the chromatin. This interaction was shown specifically on the promoter of Cyclin E gene, where L3MBTL1 recruitment by H4K20me1 was involved in silencing of this gene (Kalakonda N et al, 2008). Nevertheless, the conclusions of the high resolution histone modification profiling study by Barski et al contradicts with those findings, since according to this study, monomethylated
14
form of H4K20 was associated with gene activation (Barski A, et al, 2007). Similarly, the data about H4K20me2 sub nuclear distribution is also contradictory, which might be attributed to the ubiquitous disposition of this residue (Yang H, et al, 2009).
H4K20me3 has consistently been coupled with constitutive heterochromatin including centromeric and telomeric regions, satellite and long terminal repeats, as well as imprinted genes. Nevertheless, it was not reliably associated with a certain pattern of transcriptional activity, as exemplified by the failure of genome-wide chip approaches in forming such a relationship (Yang H, et al, 2009; Barski A, et al, 2007). As mentioned earlier, Histone 4 lysine 20 trimethylation has been associated with various cancers, and loss of H4K20 trimethylation has been proposed to be a hallmark of cancer (Fraga MF, et al, 2005). Although trimethylated H4K20 levels are highly cell cycle dependent, transformed cells are subject to a specific loss. Liver tumors in rats induced by a methyl deficient diet showed a progressive decrease in H4K20 trimethylation (Pogribny IP, et al, 2006). Additionally, in human breast cancer cell lines, loss of H4K30me3 mark corresponded to more aggressive phenotypes (Tryndyak, VP, et al, 2006). Similarly, in a study of non-small cell lung cancer, cancer cells displayed loss of H4K20 trimethylation compared to normal lung cells (Broeck AVD, et al, 2008).
1.2.3.4 Histone 4 lysine 20 methyltransferases and their cellular functions
In human, there are three known enzymes which are known to act on H4K20 methylation status. Set8 (alternatively known as Setd8, Pr-Set07 or KMT5A) is the enzyme which monomethylates the unmodified H4K20. Suv4-20h1 and Suv4-20h2 enzymes use non methylated, or preferentially monomethylated H4K20 as a substrate and dimethylate or trimethylate this residue. Additional reports have argued the involvement of Ash1 and NSD1 enzymes in H4K20 methylation, but evidence is contradictory and insufficient (Yang H, et al, 2009). There are no identified demethylase enzymes that act on H4K20.
15
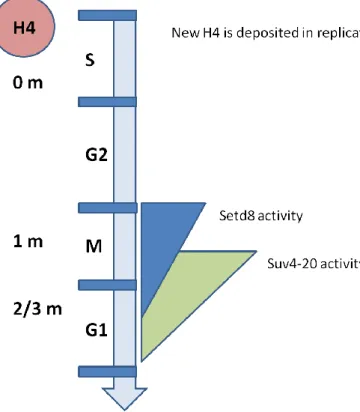
The activities of H4K20 methyltransferases are strictly regulated during the cell cycle, as well as the levels of methylated H4K20. As summarized in Figure 1.1, when newly synthesized H4 is joined into the chromatin structure during the S phase, it remains non methylated at K20 until almost the G2/M transition. With the peaking Set8 activity during the M phase, H4K20 starts to get monomethylated, which is followed by largely dimethylation and to a certain extent trimethylation by Suv4-20 activity (Yang H, et al, 2009; Trojer P, et al, 2006). Despite this paradigm, some reports have demonstrated that Set8 activity is required for cell cycle progression, especially in the S phase (Jorgensen S et. al, 2007; Yin, Y et al, 2008). It is possible however that Set8 might play its cell cycle related roles through other substrates, as evidenced by the identification of p53 as a Set8 substrate (Shi X, et al, 2007).
Figure 1.1: Cell cycle dependency of Set8 and Suv4-20 activities. (Adapted from Yang H, et al,
16
CHAPTER 2. OBJECTIVES AND RATIONALE
Despite the high mortality rate and prevalence of hepatocellular carcinoma, the available treatment options are insufficient, and there are numerous things about the pathogenesis of HCC waiting to be unraveled (Farazi PA, et al, 2006). Understanding those mechanisms, and utilizing them against HCC presents challenges. In this respect, epigenetics is a newly emerging field with lots of evidence showing the relevance and importance of several epigenetic phenomena in cancer pathogenesis, including HCC; an important example is the development of liver tumors in rodents fed with a methyl deficient diet (Pogribny IP, et al, 2006).
In a previous study performed by our group, samples from normal, cirrhotic and HCC tissues; together with senescent and immortal HuH-7 clones, were subjected to microarray analysis. According to the results of this study, epigenetic players, specifically histone modifying enzymes turned out to be promising factors that might be involved in HCC pathogenesis (unpublished data). Considering these facts, the question that if different histone methylation marks and histone modifying enzymes play roles in HCC pathogenesis came into being. Therefore, in this study, we first screened global levels of several histone methylation marks in immortal and senescent HCC cell lines. Following the identification of a marked difference of H4K20me3 levels between well differentiated and poorly differentiated HCC cell lines, and the consistent literature evidence showing the involvement of this residue in various cancer types (Yang H, et al, 2009), we decided to concentrate on trimethylated H4K20, and the methyltransferase enzymes which function in formation of this histone mark. In this context, a detailed analysis of all the transcript variants of all three enzymes involved in the H4K20 methylation process was performed. Set8 monomethyl transferase enzyme was the most prominent candidate that could play a role in HCC pathogenesis, consequently we tried to address its involvement in HCC development via overexpression and knockdown studies. The obtained results are presented and discussed in the following chapters.
17
CHAPTER 3. MATERIALS AND METHODS
3.1 MATERIALS
3.1.1 Reagents
Most of the chemicals used in the laboratory were purchased from Sigma-Aldrich (St. Louis, MO, USA) and Merck (Darmstadt, Germany). Additionally, Bradford reagent, Haematoxylin, Ethanol and Methanol were also from Sigma-Aldrich. ECL and ECL+ Western blot detection kits were from Amersham Pharmacia Biotech Ltd. (Buckinghamshire, UK). Fluorescent mounting medium was from Dako. Ponceau S and DMSO were from Applichem Biochemica (Darmstadt, Germany). X-Gal was from MBI Fermentas GmbH (Germany). Total RNA isolation kit: Nucleospin RNA II was from Macherey-Nagel (Duren, Germany). Standard agarose was from Sigma Biosciences (St. Louis, MO, USA). Purified recombinant human TGF-β1 was from R&D Systems (Minneapolis, USA).
3.1.2 PCR and cDNA synthesis reagents
cDNA synthesis was performed using Fermentas RevertAid First Strand cDNA synthesis kit (MBI Fermentas, Leon-Rot, Germany). Polymerase Chain Reaction (PCR) reagents; 10X Taq DNA Polymerase Buffer (+(NH4)2SO4, -MgCl2), Taq DNA
Polymerase, 2 mM dNTP, 25 mM MgCl2, were also purchased from Fermentas.
DyNAmo HS SYBR Green qPCR Kit F-410 from Finnzymes was used for quantitative PCR reactions.
18
3.1.3 Nucleic acids and oligonucleotides
DNA molecular weight markers and 6x gel loading buffer were purchased from Fermentas. The primers used in PCR reactions were synthesized by İONTEK (Istanbul, Turkey). Ex-T8950-Lv06 (Set8 plasmid)was purchased from GeneCopoeia company (USA). Set8 and control siRNAs were synthesized by Eurogentec (Belgium).
3.1.4 Electrophoresis, photography and spectrophotometer
Horizontal electrophoresis was done using Thermo Electron Corporation. Power supplies Power-PAC200 and Power-PAC300, and the analysis software for agarose gel imaging were from Bio Rad Laboratories (CA, USA). Spectrophotometer used in Bradford assay for protein concentration measurements was Beckman Du640, from Beckman Instruments Inc. (CA, USA). NanoDrop used for nucleic acid concentration measurements was from Thermo Scientific (Wilmington, USA).
3.1.5 Cell culture reagents and materials
For cultivation of cell lines, Dulbecco’s modified Eagle’s medium (DMEM) and Roswell Park Memorial Institute (RPMI) 1640 medium were purchased from GIBCO (Invitrogen, Carlsbad, CA, USA). Additionally, Optimem medium for transfection, penicillin/streptomycin solution, trypsin-EDTA, fetal bovine serum (FBS), L-glutamine and Geneticin-G418 sulphate were also from GIBCO. All cell culture plastic ware (flasks, petri dishes, plates, cryovials) were from Corning Life Sciences Incorporated (USA). Serological pipettes and sealed-cap polycarbonate centrifuge tubes were from Costar Corporation (Cambridge, UK). Lipofectamine 2000, and Lipofectamine RNAimax were also from Invitrogen.
19
3.1.6 Antibodies
Working dilutions and sources for all the antibodies used in different experiments are given in Table 3.1.
Antibody Company and catalog
number
Western Blot working dilution
Immunostaining working dilution
H3K4me3 (rabbit polyclonal) Abcam, ab8580 - 1:1000 (IP)
H3K9me3 (rabbit antiserum) Upstate, 07-523 - 1:1000 (IP)
H3K27me3 (rabbit polyclonal) Upstate, 07-449 - 1:1000 (IP)
H3K36me3 (rabbit polyclonal) Abcam, ab9050 - 1:1000 (IP)
H3R2me2 (rabbit polyclonal) Upstate, 07-585 - 1:600 (IP)
H3R17me2 (rabbit polyclonal) Abcam, ab8284 - 1:900 (IP)
H3 (mouse monoclonal) Abcam, ab24834 1:1000 -
H4K20me3 (rabbit polyclonal) Upstate, 07-463 1:2000 1:500 (IP)
H4K20me1 (rabbit polyclonal) Abcam, ab9051 1:5000 1:200 (FC)
HA-tag (mouse monoclonal) Covance, MMS-101P 1:500 -
Calnexin (rabbit, polyclonal) Sigma, C4731 1:5000 -
BrdU DAKO, M0744 - 1:500 (IF)
Anti-mouse-HRP Sigma, A0168 1:5000 -
Anti-rabbit-HRP Sigma, 6154 1:5000 -
20
Anti-mouse-Alexa Fluor 568 Invitrogen, A11031 - 1:750 (IF)
Rabbit polyclonal IgG (isotype control)
Abcam, ab27472 - 1:1 (FC)
Table 3.1: Antibody dilutions. IP: immunoperoxidase staining, IF: immunofluorescent staining, FC:
flow cytometry.
3.2 SOLUTIONS AND MEDIA
3.2.1 General and cell culture solutions
50x Tris Acetate EDTA (TAE): 242 g Tris base, 57,1 ml glacial acetic acid, 18,6 g EDTA in 1 liter ddH2O (Working dilution is 1x).
Ethidium bromide: 10 mg/ml stock is dissolved in water
(Working solution is 30 ng/ml).
10x Phosphate buffered saline (PBS): 80 g NaCl, 2 g KCl, 14,4 g Na2HPO4, 2,4
g KH2PO4 in 1 liter ddH2O (Working dilution is 1x, autoclaved for use in cell
culture).
DMEM/RPMI 1640 working medium: 10% Fetal bovine serum (FBS), 1% penicillin/streptomycin, 1% Non-essential amino acids were added to obtain complete medium.
3.2.2 Sodium Deodecyl Sulphate (SDS) – Polyacrylamide Gel Electrophoresis (PAGE) and immunoblotting materials and solutions
NuPAGE NOVEX pre-cast gel system from Invitrogen (CA, USA) was employed for running denaturing gels. 4-12 % gradient or 12 % Bis-Tris mini gels were used with either MES or MOPS running buffer, which were also purchased from Invitrogen.
21
4x sample loading buffer, 10x denaturing agent and antioxidant were also from Invitrogen, and they were used according to the manufacturer’s protocols.
20x transfer buffer was also from Invitrogen, it was diluted to 1x working concentration, and used with 10 % methanol.
NP-40 lysis buffer: 150 mM NaCl, 50 mM TrisHCl (pH 8.0),
1 % NP-40, 0,1 % SDS, 1x protease inhibitor cocktail (from 25x stock) in ddH2O.
10x Tris buffered saline (TBS): 12,19 g Trisma base, 87,76 g NaCl in 1 liter ddH2O, pH is adjusted to 8 (Working dilution is 1x).
TBS-tween (TBS-T): 0,2 % Tween-20 was dissolved in 1x
TBS.
Ponceau S solution: 0,1 % (w/v) Ponceau, 5 % (v/v) acetic acid in ddH2O.
Blocking solution: 5 % (w/v) non-fat dry milk was
dissolved in 0,2 % TBS-T.
3.2.3 Immunoperoxidase and immunofluorescence solutions
Immunoperoxidase blocking solution: 10 % FBS, 0,1% Triton-X in 1x PBS.
Immunofluorescence blocking solution: 10 % FBS in 0,2% PST-Tween 20.
4’, 6-diamino-2-phenylindole (DAPI): 0,1-1 μg/ml (Working solution in ddH2O)
22
3.2.4 Senescence associated β-galactosidase (SABG) assay solutions
SABG buffer: 40 mM citric acid/sodium phosphate
buffer (pH 6.0), 5 mM potassium ferrocyanide, 5 mM potassium ferricyanide, 150 mM NaCl, 2 mM MgCl2, 1 mg/ml X-gal in ddH2O. pH is adjusted to 6.0, and the
solution is filtered prior to use.
3.2.5 BrdU incorporation assay solutions
BrdU stock solution: 10 mg/ml BrdU in ddH2O (Working
solution is 30 μM)
3.3 METHODS
3.3.1 General methods
3.3.1.1 Quantification and qualification of nucleic acids
NanoDrop ND-1000 Full-spectrum UV/Vis spectrophotometer (Thermo Fisher Scientific, Wilmington, DE, USA) was employed in order to quantify DNA and RNA. Quality and purity of nucleic acids were determined by calculation of OD260 to OD280
ratio.
3.3.1.2 Agarose gel electrophoresis of nucleic acids
DNA fragments obtained by PCR were fractioned by horizontal electrophoresis apparatus. Agarose gels were prepared using 1x TAE buffer; agarose concentration was calculated as weight / volume, and agarose was dissolved completely in 1x TAE by heating in the microwave oven. Ethidium bromide was added to a final concentration of 30 μg/ml after some cooling. All PCR products were less than 1 kb,
23
therefore they were separated on 2 % agarose gel with 1x TAE running buffer. Samples were prepared by the addition of 6x loading buffer from Fermentas to a final concentration of 1x. Gels were usually run at 110 V, with different time periods depending on the size of the product. Bands were visualized under UV light, and fragment sizes were estimated using Fermentas Gene Ruler DNA ladders, especially 100 bp ladder and 1 kb ladder were used for PCR products.
3.3.1.3 Computer, software and database tools
The sequences and all other information about the genes were obtained from NCBI (National Center for Biotechnology Information) website at: http://www.ncbi.nlm.nih.gov/, and Ensembl Genome Browser website at: http://www.ensembl.org/index.html. Primers were designed using the online web tool Primer3, provided by Steve Rozen and Helen J. Skaletsky (2000) at: http://frodo.wi.mit.edu/primer3/. In silico PCR to confirm that the primers hit only a single location in the genome was performed using UCSC (University of California, Santa Cruz) Genome Bioinformatics website, in silico PCR online tool at: http://genome.ucsc.edu/. The alignment of nucleic acid or protein sequences were performed by using Clustal W algorithm, provided by SDSC (San Diego Supercomputer Center) Biology Workbench website at: http://workbench.sdsc.edu/. Information about proteins was retrieved from Uniprot (Universal Protein Resource) database at: http://www.uniprot.org/.
3.3.2 Cell and tissue culture techniques
3.3.2.1 Cell lines and stable clones
15 HCC derived cell lines were used in this study, which were: HuH-7, Hep40, HepG2, Hep3B, Hep3B-TR, PLC/PRF/5, SNU-182, SNU-387, SNU-398, SNU-423, SNU-449, SNU-475, Mahlavu, FOCUS, SK-HEP-1. These cell lines were cultured as previously (Cagatay T. and Ozturk M, 2002). Briefly, HuH-7, Hep40, HepG2,
24
Hep3B, Hep3B-TR, PLC/PRF/5, , Mahlavu, FOCUS and SK-HEP-1cell lines were cultured in DMEM working medium, and all the SNU cell lines were cultured in RPMI 1640 working medium. SNU-475 derived stable clone SNU-475-Set8 was selected by G-418 antibiotic after 1 week of lentiviral infection. G-418 selection was performed with a concentration of 400 μg/ml in complete medium. G418 was renewed every 3 days. After 2 weeks of G-418 selection, selected cells were maintained in the presence of 100 μg/ml G-418 and G-418 was withdrawn from the medium when experiments are set-up with this clone. When a certain number of cells are needed, cells were counted by using a haemocytometer after trypsinization and resuspension in growth medium.
3.3.2.2 Thawing cells
Frozen cells in cryovials from liquid nitrogen or -80ºC freezer were taken and immediately put on ice. Vials were placed in 37 ºC water bath and waited 1-2 min to thaw. Before the cells were completely thawed, the suspension was taken into 15 ml sterile centrifuge tube with approximately 10 ml growth medium and resuspended. Cells were centrifuged at 1500 rpm for 3 minutes, supernatant was discarded, and the pellet was resuspended in 10 ml fresh growth medium to be placed into 75 cm2 flasks or 100 mm dishes. Flasks or dishes were rocked back and forth gently in order to allow the cell suspension to mix, and they were incubated overnight at a 37ºC humidified incubator with 5 % CO2. The next day, cells were washed with 1x PBS,
and culture mediums were replaced with fresh growth mediums.
3.3.2.3 Growth conditions of cells
HCC cell lines were cultured in DMEM or RPMI 1640 mediums supplemented with 10 % FBS, 1 % penicillin/streptomycin and 1 % Non-essential amino acids as specified previously. Cells were incubated in humidified 37ºC incubators with 5 % CO2 in the air. Cells were passaged regularly, approximately 2-3 days apart,
depending on the cell type, but before reaching confluency each time. When passaging cells, old growth medium was aspirated, cells were washed with 1x PBS
25
once, after aspirating the PBS, trypsin-EDTA solution was added on to the cells with the amount depending on the size of the culture flask, usually 1-2 ml for 100 mm dishes were used. After waiting 1-2 minutes when trypsin removed the monolayer of the cells from the surface, fresh medium was added and cells were collected by pipetting up and down with serological pipettes several times, and therefore mixed thoroughly. Afterwards, cells were re-seeded on fresh dishes or flasks with the required dilutions. All mediums, 1x PBS and trypsin-EDTA were stored at +4ºC refrigerator. FBS stock solutions were stored at -20ºC refrigerators, thawed in 37ºC water bath, heat-inactivated at 56ºC for 30 minutes, then aliquoted into sterile 50 ml centrifuge tubes and stored at -20ºC, they were also filter-sterilized prior to use. All solutions and media were warmed at 37ºC water bath prior to use.
3.3.2.4 Cryopreservation of cells
Cells were harvested when they were approximately 60 % confluent, at their exponential growth phase. Cells were collected by trypsinization, neutralized by growth medium, centrifuged at 1500 rpm for 3 minutes and the supernatant was aspirated. The pellet was resuspended in freezing medium, which contained 8 % FBS and 8 % DMSO in growth medium, at a concentration of approximately 4 x 10⁶ cells/ml. 1 ml of these cells were stored in cryovials, these were immediately placed at -20ºC for 1 hour, then stored at -80ºC overnight, then transferred into liquid nitrogen tanks for long term storage.
3.3.2.5 Transient transfection of eukaryotic cells using Lipofectamine 2000 reagent
Plasmid DNA transfection of cells were performed by using Lipofectamine 2000 reagent from Invitrogen (CA, USA), according to the manufacturer’s protocols, with a DNA:Lipofectamine ratio of 1:3. OPTI-MEM reduced serum medium from GIBCO, Invitrogen was used for transfection experiments.
26
3.3.2.6 Transient transfection of eukaryotic cells using Lipofectamine RNAi-max reagent
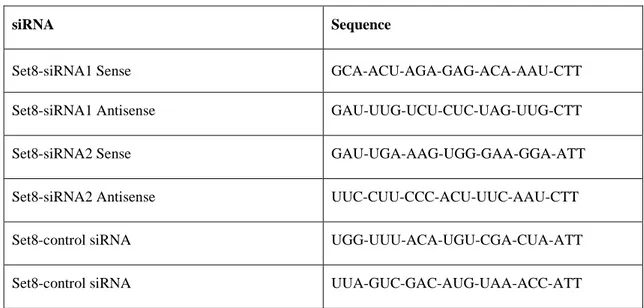
Cells were transfected with siRNAs using Lipofectamine RNAi-max reagent from Invitrogen according to the manufacturer’s protocols. OPTI-MEM reduced serum medium from GIBCO, Invitrogen was again used for transfection experiments. Final siRNA concentrations were determined by optimization. siRNA sequences for Set8 gene were obtained from the literature (Huen MSY, et al, 2008), similarly like control siRNAs (Shi X, et al, 2007), and synthesized by Eurogentec company (Belgium). List and sequences of the siRNAs used in this study are given in Table 3.2.
siRNA Sequence
Set8-siRNA1 Sense GCA-ACU-AGA-GAG-ACA-AAU-CTT
Set8-siRNA1 Antisense GAU-UUG-UCU-CUC-UAG-UUG-CTT
Set8-siRNA2 Sense GAU-UGA-AAG-UGG-GAA-GGA-ATT
Set8-siRNA2 Antisense UUC-CUU-CCC-ACU-UUC-AAU-CTT
Set8-control siRNA UGG-UUU-ACA-UGU-CGA-CUA-ATT
Set8-control siRNA UUA-GUC-GAC-AUG-UAA-ACC-ATT
Table 3.2: siRNA sequences
3.3.2.7 Lentiviral Infection of eukaryotic cells
Lentiviral infection of eukaryotic cells was performed using GeneCopoeia Lenti-Pac FIV Expression Packaging Kit, according to the manufacturer’s protocol. Briefly; on Day 0 packaging cells were seeded (HEK 293 cells) on 100 mm dishes. On Day 1, packaging cells were transfected with the target vector (Ex-T8950-Lv06 in this case) and the Lenti-Pac packaging mix using Endofectin transfection reagent for 14 hours at a 37ºC incubator. After changing the medium with growth medium supplemented with 5 % FBS and titer boost reagent, incubation was continued for an additional 24 hours, in order to let the virus particles form. Virus particles were harvested from the
27
supernatant of the packaging cells, filtered with a 0,2 μm filter. 1,5 ml of the collected virus containing medium was added on each well of cells to be infected (SNU-475 in this case) in 6-well plates. The next day, their medium was changed with normal growth medium, and the incubation was continued with normal growth medium until the cells approached confluency. Then they were transferred to 25 cm2 flasks, and G-418 antibiotic selection was started within a week.
3.3.3 Extraction of total RNA from cultured cells and tissue samples
Total RNA was extracted from cultured cells and tissue samples by using Macherey-Nagel (MN) Nucleospin RNA II kit (MN, Duren, Germany) according to the manufacturer’s protocol. When RNA was isolated from liver tissues, samples were first homogenized by pestle and mortar in the presence of liquid nitrogen, then the procedure was continued with the MN kit.
3.3.4 First strand cDNA synthesis
First strand cNDA was synthesized from total RNA using Fermentas RevertAid cDNA synthesis kit (MBI Fermentas, Germany) according to the manufacturer’s protocols. For RNA samples from cultured cells, reactions were primed with Oligo(dT)18 primers, and for RNA samples from tissues, reactions were primed with
a 1:1 mixture of Oligo(dT)18 and Random Hexamer primers. First strand cDNA
products obtained from this kit were used directly as templates for RT-PCR reactions. First strand cDNA was synthesized from 2 μg RNA for cultured cell samples, and from 4 μg RNA for tissue samples, in total 30 μl volume, and 2 μl of this product was used as RT-PCR template. In order to check for genomic DNA contamination, RT (-) cDNA samples were also synthesized from total RNA, where no reverse transcriptase enzyme was added in the reaction, therefore the only DNA template obtained was from the possible genomic DNA contamination.
28
3.3.5 Primer design for gene expression analysis by RT-PCR
When primers were designed for RT-PCR reactions, forward and reverse primers were positioned on different exons. That way, it was ensured that product size would be much higher if there was amplification from genomic DNA. Difference between the melting temperatures of forward and reverse primers were set to be no greater than 1ºC, and the GC contents were no greater than 60 %. Amplicon sizes were variable; in order to differentiate between different transcript variants, different amplicon sizes were used. All primers used for gene expression analysis are listed in Table 3.3.
Primer Sequence Tm (ºC) Number
of cycles
Suv4-20h1, Variant 1 F1: TGGAGATGGGTTCTTTGGAG R1: GCTTTGCAGGCTTCTTCAGT
58 30
Suv4-20h1, Variant 2 F1: TGGAGATGGGTTCTTTGGAG R2: TGAAGTGCAGCCAAAGCTC
56 35
Suv4-20h2, Variants 1 & 2 F1: CTCACCTGCTCCTGCTCTCT R2: TCCTGATTCCTTCTGCTTCC
63 35
Suv4-20h2, Variant 3 F1: CTCACCTGCTCCTGCTCTCT R1: CTTGCGGGTTGAGTACATGA
58 35
Set8, Variants 1 & 4 F1: AGAGGCAGGAAGATGTCCAA R2: TGCCCGGTAAATACGTTCTC
60 30
Set8, Variant 3 F2: CAGTCACCCTGAGAGAAGTCCT R1: TTCCTGGCGTCTTTGATCTT
63 35
Set8, Full length F1: AGAGGCAGGAAGATGTCCAA R3: GTCCTTTGAAGAAGGGAAAGTG
58 30
GAPDH F: GGCTGAGAACGGGAAGCTTGTCAT
R: CAGCCTTCTCCATGGTGGTGAAGA
60 21
29
3.3.6 Gene expression analysis by semi-quantitative RT-PCR
Firstly, before starting the gene expression analysis by RT-PCR, possible genomic DNA contamination was controlled by GAPDH RT-PCR. GAPDH primers were designed so that they amplify a 151 bp fragment from cDNA, but a 250 bp fragment from genomic DNA. Additionally, RT (-) cDNAs were also employed in order to control for possible genomic DNA contamination. When semi-quantitative RT-PCR reactions were set up, firstly 2 μl of each sample were used to setup GAPDH RT-PCR in order to do normalization. After GAPDH products were run on an agarose gel and band intensities were compared, adjustments for the cDNA amount to be used were made (if required). After then, the GAPDH RT-PCR reaction and the RT-PCR reaction for the gene of interest were set up with the adjusted amounts of cDNAs.
In order to determine the optimum cycle number for each semi-quantitative RT-PCR reaction, PCR reactions with different cycle numbers were set up and the minimum cycle number that allows the visualization of the desired product were selected.
3.3.7 Gene expression analysis by quantitative RT-PCR
Stratagene Mx 3005P system was used for quantitative PCR analysis. Reactions were performed using DyNAmo HS SYBR Green qPCR Kit F-410 from Finnzymes. Reactions were set up in a total volume of 25 μl with 2 μl cDNA for each sample. Reactions were started with 10 minutes initial denaturation at 95ºC, then amplification was performed with 40 to 45 cycles of: 30 seconds at 95ºC, 30 seconds at Tm of primer pair, 30 seconds at 72ºC. Samples were analyzed in triplicates, GAPDH reactions were performed in duplicates. Product purity was addressed by a dissociation curve. For each primer pair, prior to analysis, standard curve for the primer efficiency was obtained by setting up multiple reactions with 2 fold dilutions of selected cDNAs from 1 to 1:256. Primer efficiency was then calculated as: E = 2